Mga Batayang Estadistika
| Pemilik Institusional | 144 total, 144 long only, 0 short only, 0 long/short - change of 2.86% MRQ |
| Alokasi Portofolio Rata-rata | 0.3730 % - change of 5.48% MRQ |
| Saham Institusional (Jangka Panjang) | 10,690,937 (ex 13D/G) - change of -0.05MM shares -0.45% MRQ |
| Nilai Institusional (Jangka Panjang) | $ 709,241 USD ($1000) |
Kepemilikan Institusional dan Pemegang Saham
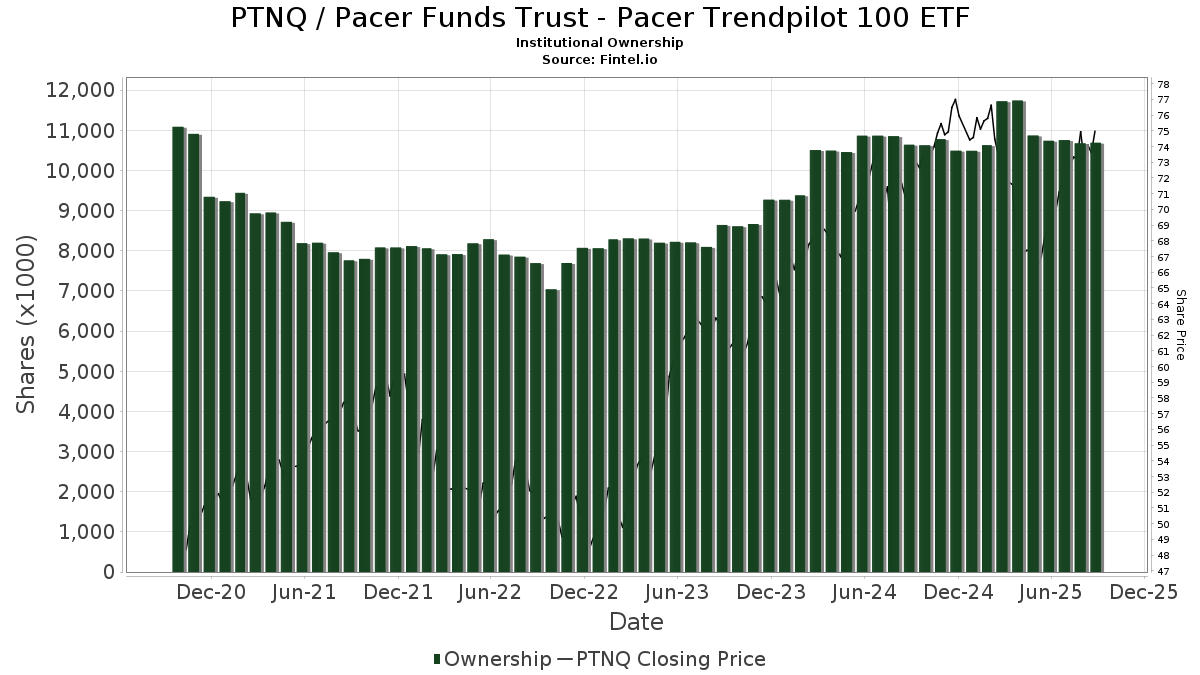
Pacer Funds Trust - Pacer Trendpilot 100 ETF (US:PTNQ) memiliki 144 pemilik institusional dan pemegang saham yang telah mengajukan formulir 13D/G atau 13F kepada Komisi Bursa Efek (Securities Exchange Commission/SEC). Lembaga-lembaga ini memegang total 10,690,937 saham. Pemegang saham terbesar meliputi LPL Financial LLC, Morgan Stanley, Bank Of America Corp /de/, Raymond James Financial Inc, Wells Fargo & Company/mn, Cetera Investment Advisers, Cambridge Investment Research Advisors, Inc., Avantax Advisory Services, Inc., UBS Group AG, and ODonnell Financial Services, LLC .
Struktur kepemilikan institusional Pacer Funds Trust - Pacer Trendpilot 100 ETF (NasdaqGM:PTNQ) menunjukkan posisi terkini di perusahaan oleh institusi dan dana, serta perubahan terbaru dalam ukuran posisi. Pemegang saham utama dapat mencakup investor individu, reksa dana, dana lindung nilai, atau institusi. Jadwal 13D menunjukkan bahwa investor memegang (atau pernah memegang) lebih dari 5% saham perusahaan dan bermaksud (atau pernah bermaksud) untuk secara aktif mengejar perubahan strategi bisnis. Jadwal 13G menunjukkan investasi pasif lebih dari 5%.
The share price as of September 5, 2025 is 74.26 / share. Previously, on September 6, 2024, the share price was 69.87 / share. This represents an increase of 6.28% over that period.
Skor Sentimen Dana
Skor Sentimen Dana (sebelumnya dikenal sebagai Skor Akumulasi Kepemilikan) menemukan saham-saham yang paling banyak dibeli oleh dana. Ini adalah hasil dari model kuantitatif multi-faktor yang canggih yang mengidentifikasi perusahaan dengan tingkat akumulasi institusional tertinggi. Model penilaian menggunakan kombinasi dari total peningkatan pemilik yang diungkapkan, perubahan dalam alokasi portofolio pada pemilik tersebut, dan metrik lainnya. Angka berkisar dari 0 hingga 100, dengan angka yang lebih tinggi menunjukkan tingkat akumulasi yang lebih tinggi dibandingkan dengan perusahaan sejenisnya, dan 50 adalah rata-ratanya.
Frekuensi Pembaruan: Setiap Hari
Lihat Ownership Explorer, yang menyediakan daftar perusahaan dengan peringkat tertinggi.
Rasio Put/Call Institusional
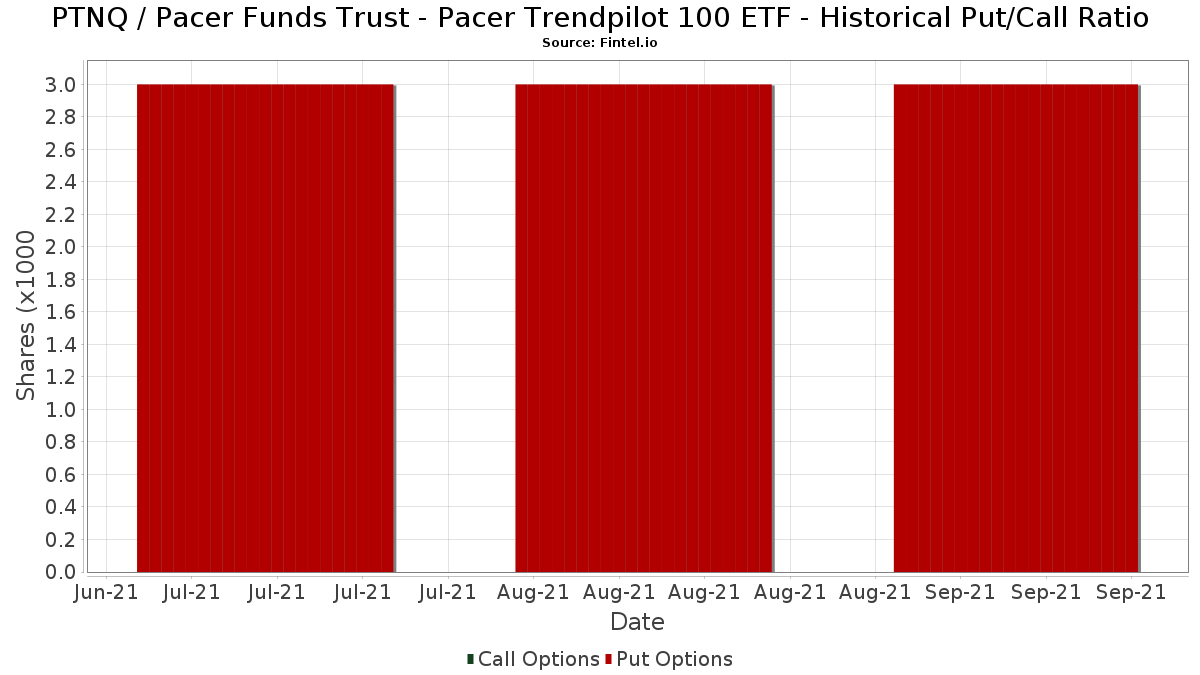
Selain melaporkan isu ekuitas dan utang standar, institusi dengan aset di bawah manajemen lebih dari 100 juta dolar AS juga harus mengungkapkan kepemilikan opsi put dan call mereka. Karena opsi put umumnya menunjukkan sentimen negatif, dan opsi call menunjukkan sentimen positif, kita dapat mengetahui sentimen institusional secara keseluruhan dengan memplot rasio put terhadap call. Grafik di sebelah kanan memplot rasio put/call historis untuk instrumen ini.
Menggunakan Rasio Put/Call sebagai indikator sentimen investor mengatasi salah satu kekurangan utama dari penggunaan total kepemilikan institusional, yaitu sejumlah besar aset yang dikelola diinvestasikan secara pasif untuk melacak indeks. Dana yang dikelola secara pasif biasanya tidak membeli opsi, sehingga indikator rasio put/call lebih akurat dalam melacak sentimen dana yang dikelola secara aktif.
Pengajuan 13F dan NPORT
Detail pada pengajuan 13F tersedia gratis. Detail pada pengajuan NP memerlukan keanggotaan premium. Baris berwarna hijau menunjukkan posisi baru. Baris berwarna merah menunjukkan posisi yang sudah ditutup. Klik tautan ini ikon untuk melihat riwayat transaksi selengkapnya.
Tingkatkan
untuk membuka data premium dan mengekspor ke Excel ![]() .
.
| Tanggal File | Sumber | Investor | Ketik | Presyo ng Avg (Silangan) |
Saham | Δ Saham (%) |
Dilaporkan Nilai ($1000) |
Nilai Δ (%) |
Alokasi Port (%) |
|
|---|---|---|---|---|---|---|---|---|---|---|
| 2025-07-24 | 13F | Us Bancorp \de\ | 0 | -100.00 | 0 | |||||
| 2025-08-11 | 13F | Citigroup Inc | 492 | 0.00 | 35 | 2.94 | ||||
| 2025-08-06 | 13F | Mascagni Wealth Management, Inc. | 4,550 | 16.94 | 325 | 17.39 | ||||
| 2025-07-29 | 13F | Stratos Wealth Partners, LTD. | 19,743 | 0.84 | 1,409 | 1.37 | ||||
| 2025-08-14 | 13F | Bank Of America Corp /de/ | 1,098,718 | -6.05 | 78,415 | -5.58 | ||||
| 2025-08-14 | 13F | IHT Wealth Management, LLC | 2,956 | -11.12 | 211 | -11.02 | ||||
| 2025-07-14 | 13F | Golden State Equity Partners | 8,308 | 593 | ||||||
| 2025-04-21 | 13F | PSI Advisors, LLC | 0 | -100.00 | 0 | -100.00 | ||||
| 2025-04-29 | 13F | Brookstone Capital Management | 0 | -100.00 | 0 | |||||
| 2025-07-17 | 13F | SWS Partners | 3,484 | 0.00 | 249 | 0.40 | ||||
| 2025-07-25 | 13F | Midwest Capital Advisors, LLC | 858 | 0.00 | 61 | 1.67 | ||||
| 2025-07-28 | 13F | Harbour Investments, Inc. | 13,933 | 3.16 | 994 | 3.65 | ||||
| 2025-08-12 | 13F | Change Path, LLC | 18,391 | -17.61 | 1,313 | -17.22 | ||||
| 2025-08-15 | 13F | Kestra Advisory Services, LLC | 54,199 | 11.41 | 3,868 | 11.99 | ||||
| 2025-08-14 | 13F/A | Rockefeller Capital Management L.P. | 90,295 | 0.63 | 6,444 | 1.15 | ||||
| 2025-04-09 | 13F | Milestone Asset Management, Llc | 0 | -100.00 | 0 | |||||
| 2025-06-30 | NP | TRND - Pacer Trendpilot Fund of Funds ETF | 161,335 | 12.61 | 10,872 | 0.83 | ||||
| 2025-07-21 | 13F | New Century Financial Group, LLC | 3,452 | 246 | ||||||
| 2025-08-07 | 13F | PFG Advisors | 18,841 | -2.13 | 1,345 | -1.68 | ||||
| 2025-08-14 | 13F | Comerica Bank | 10,434 | 7.19 | 745 | 7.67 | ||||
| 2025-08-08 | 13F | Avantax Advisory Services, Inc. | 270,924 | 36.17 | 19,336 | 36.86 | ||||
| 2025-07-25 | 13F | Sequoia Financial Advisors, LLC | 5,135 | -0.58 | 366 | 0.00 | ||||
| 2025-08-11 | 13F | Advisor Resource Council | 17,368 | -42.20 | 1,240 | -41.91 | ||||
| 2025-05-16 | 13F/A | Kestra Investment Management, LLC | 0 | -100.00 | 0 | |||||
| 2025-08-14 | 13F | Hilltop Holdings Inc. | 6,828 | 1.46 | 487 | 2.10 | ||||
| 2025-07-16 | 13F | Register Financial Advisors LLC | 871 | 0.00 | 62 | 1.64 | ||||
| 2025-08-08 | 13F | Thoroughbred Financial Services, Llc | 5,046 | -89.89 | 0 | -100.00 | ||||
| 2025-08-12 | 13F | Jacobi Capital Management LLC | 3,040 | 0.00 | 217 | 0.47 | ||||
| 2025-08-14 | 13F | Royal Bank Of Canada | 187,798 | -4.00 | 13,403 | -3.51 | ||||
| 2025-08-12 | 13F | Marshall & Sterling Wealth Advisors Inc. | 0 | -100.00 | 0 | -100.00 | ||||
| 2025-08-11 | 13F | Oder Investment Management, LLC | 11,873 | 1.26 | 847 | 1.80 | ||||
| 2025-07-31 | 13F | Oppenheimer & Co Inc | 14,065 | -10.71 | 1,004 | -10.29 | ||||
| 2025-08-14 | 13F | UBS Group AG | 257,071 | -0.94 | 18,347 | -0.43 | ||||
| 2025-08-14 | 13F | Wells Fargo & Company/mn | 633,628 | -4.39 | 45,222 | -3.91 | ||||
| 2025-04-28 | 13F | Strategic Financial Concepts, LLC | 0 | -100.00 | 0 | -100.00 | ||||
| 2025-07-29 | 13F | Private Trust Co Na | 6,075 | 0.00 | 434 | 0.46 | ||||
| 2025-08-28 | 13F | Stark Wealth Management LLC | 4,350 | 310 | ||||||
| 2025-07-22 | 13F | Legacy Trust | 6,683 | 0.00 | 477 | 0.42 | ||||
| 2025-07-15 | 13F | Burns Matteson Capital Management, LLC | 0 | -100.00 | 0 | |||||
| 2025-08-01 | 13F | Schmidt P J Investment Management Inc | 0 | -100.00 | 0 | |||||
| 2025-07-15 | 13F | EWG Elevate Inc. | 9,933 | 4.15 | 709 | 4.58 | ||||
| 2025-08-14 | 13F | Camarda Financial Advisors, LLC | 7,701 | 14.58 | 550 | 15.09 | ||||
| 2025-07-22 | 13F | Merit Financial Group, LLC | 0 | -100.00 | 0 | |||||
| 2025-08-13 | 13F | Baird Financial Group, Inc. | 3,358 | -2.10 | 240 | -1.65 | ||||
| 2025-08-12 | 13F | Proequities, Inc. | 0 | 0 | ||||||
| 2025-05-15 | 13F/A | Orion Portfolio Solutions, LLC | 11,193 | 4.19 | 795 | -0.13 | ||||
| 2025-07-25 | 13F | Cwm, Llc | 23,568 | 0.00 | 2 | 0.00 | ||||
| 2025-08-12 | 13F | CIBC Private Wealth Group, LLC | 777 | -22.30 | 55 | -17.91 | ||||
| 2025-04-23 | 13F | International Assets Investment Management, Llc | 0 | -100.00 | 0 | |||||
| 2025-08-15 | 13F | First Heartland Consultants, Inc. | 0 | -100.00 | 0 | |||||
| 2025-08-13 | 13F | Trustmark National Bank Trust Department | 7,089 | 0.00 | 506 | 0.40 | ||||
| 2025-08-14 | 13F | Jane Street Group, Llc | 9,421 | 672 | ||||||
| 2025-08-14 | 13F | Arete Wealth Advisors, LLC | 11,833 | 11.26 | 1 | |||||
| 2025-09-04 | 13F/A | Advisor Group Holdings, Inc. | 175,193 | -6.99 | 12,504 | -6.51 | ||||
| 2025-08-04 | 13F | Arkadios Wealth Advisors | 12,834 | 0.63 | 916 | 1.10 | ||||
| 2025-08-14 | 13F | Napa Wealth Management | 26,017 | 1,857 | ||||||
| 2025-04-15 | 13F | Noble Wealth Management PBC | 1,400 | 21.74 | 99 | 16.47 | ||||
| 2025-07-10 | 13F | Financial Management Network Inc | 38,442 | -5.76 | 2,766 | 0.95 | ||||
| 2025-07-17 | 13F | Janney Montgomery Scott LLC | 27,656 | 6.91 | 2 | 0.00 | ||||
| 2025-08-12 | 13F | Insigneo Advisory Services, Llc | 4,519 | -8.09 | 323 | -7.74 | ||||
| 2025-08-12 | 13F | Calton & Associates, Inc. | 9,603 | -79.85 | 685 | -79.76 | ||||
| 2025-05-12 | 13F | Independent Advisor Alliance | 0 | -100.00 | 0 | |||||
| 2025-08-13 | 13F | Proactive Wealth Strategies LLC | 19,802 | -6.69 | 1 | 0.00 | ||||
| 2025-04-17 | 13F | FNY Investment Advisers, LLC | 0 | -100.00 | 0 | |||||
| 2025-07-14 | 13F | GAMMA Investing LLC | 80 | 0.00 | 6 | 0.00 | ||||
| 2025-08-14 | 13F | Susquehanna International Group, Llp | 20,198 | 1,442 | ||||||
| 2025-08-14 | 13F | Mml Investors Services, Llc | 44,892 | -21.13 | 3 | -25.00 | ||||
| 2025-08-11 | 13F | Anfield Capital Management, LLC | 130 | 0.00 | 9 | 0.00 | ||||
| 2025-08-14 | 13F | Mariner, LLC | 7,691 | 2.27 | 549 | 2.62 | ||||
| 2025-08-14 | 13F | Old Mission Capital Llc | 4,338 | 310 | ||||||
| 2025-07-18 | 13F | Truist Financial Corp | 50,074 | -10.81 | 3,574 | -10.36 | ||||
| 2025-08-05 | 13F | GPS Wealth Strategies Group, LLC | 8,580 | 0.00 | 612 | 0.49 | ||||
| 2025-08-14 | 13F | Wiley Bros.-aintree Capital, Llc | 10,717 | -11.20 | 765 | -10.75 | ||||
| 2025-08-14 | 13F | CoreCap Advisors, LLC | 746 | 4.04 | 53 | 6.00 | ||||
| 2025-07-17 | 13F | XML Financial, LLC | 10,724 | -15.57 | 765 | -15.09 | ||||
| 2025-07-21 | 13F | Ameriflex Group, Inc. | 2,588 | -33.64 | 183 | -34.06 | ||||
| 2025-08-05 | 13F | Sigma Planning Corp | 14,590 | -0.27 | 1,041 | 0.29 | ||||
| 2025-08-18 | 13F | Geneos Wealth Management Inc. | 183,469 | 42.46 | 13,094 | 43.18 | ||||
| 2025-07-23 | 13F | Clear Creek Financial Management, LLC | 12,169 | -60.23 | 869 | -60.04 | ||||
| 2025-07-08 | 13F | Nbc Securities, Inc. | 2,165 | 0.00 | 0 | |||||
| 2025-07-30 | 13F | Gimbal Financial | 38,461 | -27.04 | 2,745 | -26.69 | ||||
| 2025-08-14 | 13F | Vienna Asset Management LLC | 68,465 | 28.86 | 4,886 | 29.53 | ||||
| 2025-07-29 | 13F | Stratos Wealth Advisors, LLC | 0 | -100.00 | 0 | |||||
| 2025-08-13 | 13F | MONECO Advisors, LLC | 64,772 | -3.86 | 4,623 | -3.39 | ||||
| 2025-07-24 | 13F | IFP Advisors, Inc | 5,818 | 27.90 | 415 | 28.48 | ||||
| 2025-04-11 | 13F | IAM Advisory, LLC | 0 | -100.00 | 0 | -100.00 | ||||
| 2025-05-13 | 13F | Aptus Capital Advisors, LLC | 0 | -100.00 | 0 | |||||
| 2025-08-08 | 13F | Cetera Investment Advisers | 427,015 | -14.42 | 30,476 | -13.98 | ||||
| 2025-07-22 | 13F | Confluence Wealth Services, Inc. | 8,124 | -0.87 | 580 | 5.27 | ||||
| 2025-07-14 | 13F | MY Wealth Management Inc. | 131,087 | 9,356 | ||||||
| 2025-08-13 | 13F | JBR Co Financial Management Inc | 21,571 | -19.06 | 1,540 | -18.66 | ||||
| 2025-08-14 | 13F | Raymond James Financial Inc | 804,067 | -1.67 | 57,386 | -1.17 | ||||
| 2025-05-15 | 13F | StoneX Group Inc. | 0 | -100.00 | 0 | -100.00 | ||||
| 2025-08-06 | 13F | AE Wealth Management LLC | 953 | 0.00 | 68 | 1.49 | ||||
| 2025-08-13 | 13F | EverSource Wealth Advisors, LLC | 1,672 | 0.00 | 119 | 0.85 | ||||
| 2025-07-29 | 13F | ODonnell Financial Services, LLC | 219,653 | 2.27 | 15,677 | 2.79 | ||||
| 2025-08-12 | 13F | Global Retirement Partners, LLC | 47 | 3 | ||||||
| 2025-08-14 | 13F | EP Wealth Advisors, Inc. | 1,550 | 0.00 | 111 | 0.00 | ||||
| 2025-07-24 | 13F | Cyndeo Wealth Partners, LLC | 3,559 | 254 | ||||||
| 2025-07-31 | 13F | Cambridge Investment Research Advisors, Inc. | 422,624 | -15.71 | 30 | -14.29 | ||||
| 2025-08-14 | 13F | Stifel Financial Corp | 82,344 | 7.87 | 5,877 | 8.41 | ||||
| 2025-07-15 | 13F | Clarus Group, Inc. | 3,818 | 0.00 | 272 | 0.37 | ||||
| 2025-08-12 | 13F | Pacer Advisors, Inc. | 156,854 | 3.22 | 11,195 | 3.74 | ||||
| 2025-07-25 | 13F | Atria Wealth Solutions, Inc. | 107,640 | -16.99 | 7,682 | -16.57 | ||||
| 2025-07-28 | 13F | Axxcess Wealth Management, Llc | 7,555 | -28.83 | 539 | -28.42 | ||||
| 2025-07-21 | 13F | Financial Services Advisory Inc | 22,791 | 0.92 | 1,627 | 1.43 | ||||
| 2025-08-12 | 13F | SRS Capital Advisors, Inc. | 2,754 | 14.80 | 197 | 15.29 | ||||
| 2025-08-11 | 13F | Empirical Finance, LLC | 47,352 | 0.00 | 3,380 | 0.51 | ||||
| 2025-04-23 | 13F | PBMares Wealth Management LLC | 0 | -100.00 | 0 | |||||
| 2025-07-18 | 13F | Trust Co Of Vermont | 925 | 66 | ||||||
| 2025-08-01 | 13F | Brookwood Investment Group LLC | 0 | -100.00 | 0 | |||||
| 2025-08-27 | 13F/A | Brinker Capital Investments, LLC | 12,906 | 15.30 | 921 | 15.99 | ||||
| 2025-08-11 | 13F | HighTower Advisors, LLC | 76,265 | 5,443 | ||||||
| 2025-08-12 | 13F | Jpmorgan Chase & Co | 378 | -55.05 | 27 | -54.24 | ||||
| 2025-08-14 | 13F | Elevatus Welath Management | 0 | -100.00 | 0 | |||||
| 2025-07-23 | 13F | Tyche Wealth Partners LLC | 3,256 | -19.45 | 232 | -18.88 | ||||
| 2025-08-11 | 13F | Private Advisor Group, LLC | 55,026 | 2.94 | 3,927 | 3.48 | ||||
| 2025-08-06 | 13F | Prospera Financial Services Inc | 55,913 | -20.86 | 3,996 | -20.43 | ||||
| 2025-08-13 | 13F | Quadrant Capital Group Llc | 0 | -100.00 | 0 | |||||
| 2025-08-05 | 13F | Sensible Money, LLC | 3,000 | 0.00 | 214 | 0.47 | ||||
| 2025-08-07 | 13F | Kestra Private Wealth Services, Llc | 17,402 | -9.52 | 1,242 | -9.08 | ||||
| 2025-07-07 | 13F | Nova Wealth Management, Inc. | 5,133 | -85.51 | 366 | -85.45 | ||||
| 2025-07-22 | 13F | MBL Wealth, LLC | 47,385 | 3,382 | ||||||
| 2025-08-11 | 13F | Western Wealth Management, LLC | 37,729 | -14.33 | 2,693 | -13.91 | ||||
| 2025-08-12 | 13F | Financial Advocates Investment Management | 3,991 | -2.06 | 285 | -1.73 | ||||
| 2025-08-13 | 13F | Northwestern Mutual Wealth Management Co | 811 | 58 | ||||||
| 2025-08-05 | 13F | Bank Of Montreal /can/ | 600 | 43 | ||||||
| 2025-07-29 | 13F | Stephens Inc /ar/ | 79,800 | -5.70 | 5,695 | -5.23 | ||||
| 2025-08-04 | 13F | Assetmark, Inc | 2,522 | 0.00 | 180 | 0.00 | ||||
| 2025-08-06 | 13F | Commonwealth Equity Services, Llc | 179,441 | -9.17 | 13 | -14.29 | ||||
| 2025-05-14 | 13F | Brown Brothers Harriman & Co | 0 | -100.00 | 0 | |||||
| 2025-08-13 | 13F | Level Four Advisory Services, Llc | 122,128 | 0.87 | 8,716 | 1.38 | ||||
| 2025-07-10 | 13F | Wealth Enhancement Advisory Services, Llc | 13,845 | -71.29 | 996 | -70.91 | ||||
| 2025-08-11 | 13F | CFS Investment Advisory Services, LLC | 7,450 | 1 | ||||||
| 2025-07-07 | 13F | Capital Asset Advisory Services LLC | 7,455 | -29.77 | 527 | -30.70 | ||||
| 2025-08-13 | 13F | Continuum Advisory, LLC | 0 | -100.00 | 0 | |||||
| 2025-08-14 | 13F | Ameriprise Financial Inc | 22,338 | -6.98 | 1,594 | -6.57 | ||||
| 2025-08-15 | 13F | Equitable Holdings, Inc. | 53,917 | -32.58 | 3,848 | -32.23 | ||||
| 2025-08-12 | 13F | LPL Financial LLC | 1,516,605 | 6.61 | 108,240 | 7.15 | ||||
| 2025-08-12 | 13F | J.w. Cole Advisors, Inc. | 18,676 | 0.85 | 1,333 | 1.29 | ||||
| 2025-07-17 | 13F | Tempus Wealth Planning, LLC | 3,166 | -49.63 | 226 | -49.55 | ||||
| 2025-05-06 | 13F | Venturi Wealth Management, LLC | 0 | -100.00 | 0 | |||||
| 2025-08-19 | 13F | National Asset Management, Inc. | 0 | -100.00 | 0 | |||||
| 2025-07-25 | 13F | Lion Street Advisors, LLC | 5,080 | 0.00 | 363 | 0.56 | ||||
| 2025-07-17 | 13F | Beacon Capital Management, LLC | 595 | 0.00 | 42 | 0.00 | ||||
| 2025-08-12 | 13F | Steward Partners Investment Advisory, Llc | 144,276 | 7.02 | 10,297 | 7.56 | ||||
| 2025-08-07 | 13F | Parkside Financial Bank & Trust | 2,465 | 0.00 | 176 | 0.00 | ||||
| 2025-08-14 | 13F | Citadel Advisors Llc | 9,079 | 17.51 | 648 | 18.07 | ||||
| 2025-07-22 | 13F | Unique Wealth, Llc | 3,041 | 0.00 | 217 | 0.93 | ||||
| 2025-08-19 | 13F | Asset Dedication, LLC | 3,000 | 0.00 | 214 | 0.47 | ||||
| 2025-07-02 | 13F | HBW Advisory Services LLC | 3,317 | 237 | ||||||
| 2025-07-11 | 13F | SILVER OAK SECURITIES, Inc | 6,858 | -1.15 | 489 | -0.61 | ||||
| 2025-08-12 | 13F | PKS Advisory Services, LLC | 12,162 | 3.07 | 868 | 3.70 | ||||
| 2025-07-14 | 13F | Southland Equity Partners LLC | 12,368 | 0.24 | 883 | 0.68 | ||||
| 2025-08-14 | 13F | Aft, Forsyth & Sober, LLC | 57,225 | 0.88 | 4,084 | 1.39 | ||||
| 2025-08-01 | 13F | Gwn Securities Inc. | 0 | -100.00 | 0 | |||||
| 2025-07-21 | 13F | Ameritas Advisory Services, LLC | 40,088 | -13.49 | 2,861 | -13.22 | ||||
| 2025-08-01 | 13F | Envestnet Asset Management Inc | 79,069 | -16.24 | 5,643 | -15.81 | ||||
| 2025-08-14 | 13F | Family Office Research LLC | 7,870 | -3.19 | 562 | -2.77 | ||||
| 2025-08-15 | 13F | Morgan Stanley | 1,189,468 | -4.08 | 84,892 | -3.60 | ||||
| 2025-07-22 | 13F | DAVENPORT & Co LLC | 8,344 | 2.14 | 596 | 2.59 | ||||
| 2025-08-08 | 13F | Foundations Investment Advisors, LLC | 4,893 | -61.50 | 349 | -61.31 | ||||
| 2025-08-14 | 13F | GWM Advisors LLC | 149,890 | 76.82 | 10,698 | 77.72 | ||||
| 2025-07-31 | 13F | Stegent Equity Advisors, Inc. | 3,375 | -14.86 | 241 | -14.59 | ||||
| 2025-08-14 | 13F | Kovitz Investment Group Partners, LLC | 3,927 | 0.00 | 280 | 0.72 | ||||
| 2025-08-04 | 13F | Creative Financial Designs Inc /adv | 180,961 | 11.17 | 12,915 | 11.74 | ||||
| 2025-08-04 | 13F | Integrity Alliance, Llc. | 11,062 | -18.47 | 789 | -18.07 | ||||
| 2025-08-14 | 13F | Fmr Llc | 2,970 | -11.34 | 212 | -10.97 | ||||
| 2025-08-07 | 13F | Allworth Financial LP | 1,526 | 0.00 | 109 | 5.88 | ||||
| 2025-07-25 | 13F | Concurrent Investment Advisors, LLC | 28,551 | -4.89 | 2,038 | -4.41 | ||||
| 2025-07-30 | 13F | Strategic Blueprint, LLC | 6,182 | 27.97 | 441 | 28.57 | ||||
| 2025-07-30 | 13F/A | Old Point Trust & Financial Services N A | 452 | 0.00 | 32 | 0.00 |