Mga Batayang Estadistika
| Pemilik Institusional | 121 total, 115 long only, 4 short only, 2 long/short - change of -9.02% MRQ |
| Alokasi Portofolio Rata-rata | 0.1620 % - change of -15.49% MRQ |
| Saham Institusional (Jangka Panjang) | 8,442,335 (ex 13D/G) - change of -1.04MM shares -10.96% MRQ |
| Nilai Institusional (Jangka Panjang) | $ 175,081 USD ($1000) |
Kepemilikan Institusional dan Pemegang Saham
iShares Trust - iShares Mortgage Real Estate ETF (US:REM) memiliki 121 pemilik institusional dan pemegang saham yang telah mengajukan formulir 13D/G atau 13F kepada Komisi Bursa Efek (Securities Exchange Commission/SEC). Lembaga-lembaga ini memegang total 8,442,348 saham. Pemegang saham terbesar meliputi Wells Fargo & Company/mn, Morgan Stanley, Envestnet Asset Management Inc, Bank Of America Corp /de/, Bnp Paribas Arbitrage, Sa, Advisor Group Holdings, Inc., Evergreen Capital Management Llc, Ameriprise Financial Inc, LPL Financial LLC, and VisionPoint Advisory Group, LLC .
Struktur kepemilikan institusional iShares Trust - iShares Mortgage Real Estate ETF (BATS:REM) menunjukkan posisi terkini di perusahaan oleh institusi dan dana, serta perubahan terbaru dalam ukuran posisi. Pemegang saham utama dapat mencakup investor individu, reksa dana, dana lindung nilai, atau institusi. Jadwal 13D menunjukkan bahwa investor memegang (atau pernah memegang) lebih dari 5% saham perusahaan dan bermaksud (atau pernah bermaksud) untuk secara aktif mengejar perubahan strategi bisnis. Jadwal 13G menunjukkan investasi pasif lebih dari 5%.
The share price as of September 5, 2025 is 23.58 / share. Previously, on September 9, 2024, the share price was 23.61 / share. This represents a decline of 0.15% over that period.

Skor Sentimen Dana
Skor Sentimen Dana (sebelumnya dikenal sebagai Skor Akumulasi Kepemilikan) menemukan saham-saham yang paling banyak dibeli oleh dana. Ini adalah hasil dari model kuantitatif multi-faktor yang canggih yang mengidentifikasi perusahaan dengan tingkat akumulasi institusional tertinggi. Model penilaian menggunakan kombinasi dari total peningkatan pemilik yang diungkapkan, perubahan dalam alokasi portofolio pada pemilik tersebut, dan metrik lainnya. Angka berkisar dari 0 hingga 100, dengan angka yang lebih tinggi menunjukkan tingkat akumulasi yang lebih tinggi dibandingkan dengan perusahaan sejenisnya, dan 50 adalah rata-ratanya.
Frekuensi Pembaruan: Setiap Hari
Lihat Ownership Explorer, yang menyediakan daftar perusahaan dengan peringkat tertinggi.
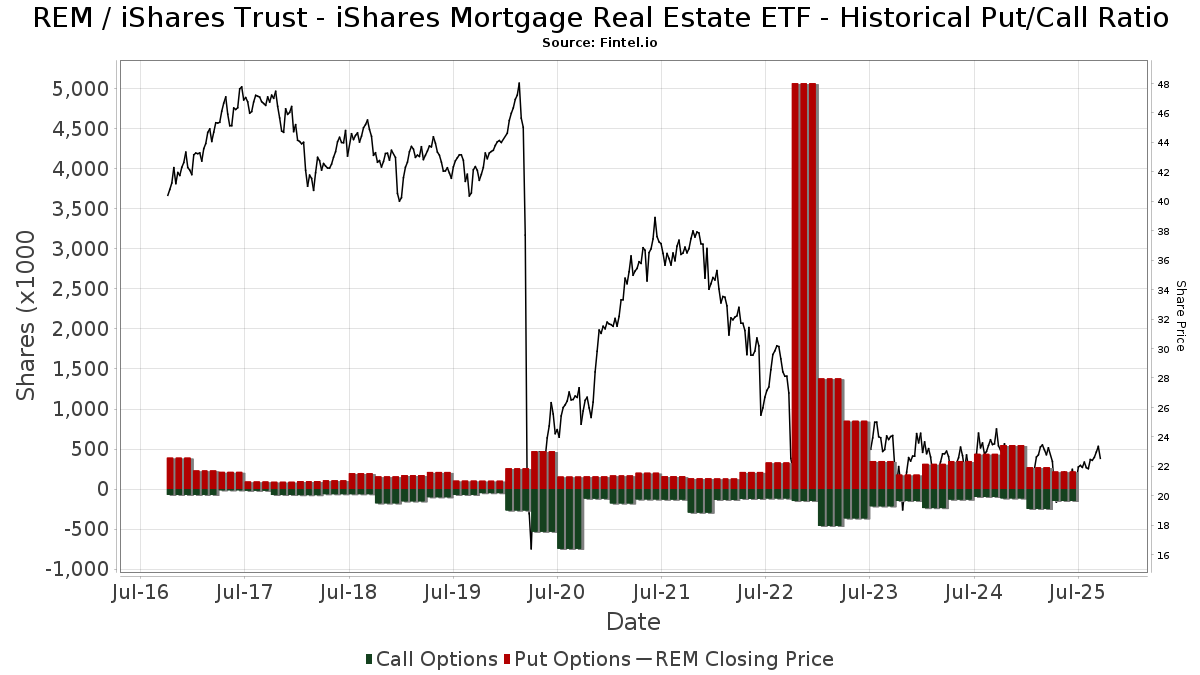
Rasio Put/Call Institusional
Selain melaporkan isu ekuitas dan utang standar, institusi dengan aset di bawah manajemen lebih dari 100 juta dolar AS juga harus mengungkapkan kepemilikan opsi put dan call mereka. Karena opsi put umumnya menunjukkan sentimen negatif, dan opsi call menunjukkan sentimen positif, kita dapat mengetahui sentimen institusional secara keseluruhan dengan memplot rasio put terhadap call. Grafik di sebelah kanan memplot rasio put/call historis untuk instrumen ini.
Menggunakan Rasio Put/Call sebagai indikator sentimen investor mengatasi salah satu kekurangan utama dari penggunaan total kepemilikan institusional, yaitu sejumlah besar aset yang dikelola diinvestasikan secara pasif untuk melacak indeks. Dana yang dikelola secara pasif biasanya tidak membeli opsi, sehingga indikator rasio put/call lebih akurat dalam melacak sentimen dana yang dikelola secara aktif.
Pengajuan 13F dan NPORT
Detail pada pengajuan 13F tersedia gratis. Detail pada pengajuan NP memerlukan keanggotaan premium. Baris berwarna hijau menunjukkan posisi baru. Baris berwarna merah menunjukkan posisi yang sudah ditutup. Klik tautan ini ikon untuk melihat riwayat transaksi selengkapnya.
Tingkatkan
untuk membuka data premium dan mengekspor ke Excel ![]() .
.
| Tanggal File | Sumber | Investor | Ketik | Presyo ng Avg (Silangan) |
Saham | Δ Saham (%) |
Dilaporkan Nilai ($1000) |
Nilai Δ (%) |
Alokasi Port (%) |
|
|---|---|---|---|---|---|---|---|---|---|---|
| 2025-07-16 | 13F/A | CX Institutional | 402 | 1.26 | 0 | |||||
| 2025-08-14 | 13F | Mariner, LLC | 20,854 | -32.59 | 446 | -35.88 | ||||
| 2025-08-14 | 13F | Susquehanna International Group, Llp | Put | 70,200 | 1.74 | 1,501 | -3.10 | |||
| 2025-08-14 | 13F | Susquehanna International Group, Llp | 54,226 | -7.77 | 1,159 | -12.13 | ||||
| 2025-07-09 | 13F | VisionPoint Advisory Group, LLC | 203,395 | -3.45 | 4,349 | -8.02 | ||||
| 2025-08-14 | 13F | Susquehanna International Group, Llp | Call | 112,600 | -27.73 | 2,407 | -31.15 | |||
| 2025-05-13 | 13F | EverSource Wealth Advisors, LLC | 0 | -100.00 | 0 | |||||
| 2025-08-04 | 13F | Spire Wealth Management | 96 | 0.00 | 2 | 0.00 | ||||
| 2025-08-14 | 13F | UBS Group AG | 172,058 | 15.01 | 3,679 | 9.56 | ||||
| 2025-05-14 | 13F | Oarsman Capital, Inc. | 0 | -100.00 | 0 | -100.00 | ||||
| 2025-08-12 | 13F | Proequities, Inc. | 0 | 0 | ||||||
| 2025-07-15 | 13F | Fifth Third Bancorp | 212 | 0.00 | 5 | 0.00 | ||||
| 2025-08-14 | 13F | Fwl Investment Management, Llc | 14,061 | -25.57 | 301 | -29.08 | ||||
| 2025-07-30 | 13F | Mid-American Wealth Advisory Group, Inc. | 269 | 6 | ||||||
| 2025-08-18 | 13F | Wolverine Trading, Llc | Put | 0 | -100.00 | 0 | -100.00 | |||
| 2025-08-14 | 13F | Smartleaf Asset Management LLC | 900 | 19 | ||||||
| 2025-08-08 | 13F | Cetera Investment Advisers | 35,672 | 17.69 | 763 | 12.06 | ||||
| 2025-08-12 | 13F | LPL Financial LLC | 219,571 | 10.84 | 4,694 | 5.60 | ||||
| 2025-07-21 | 13F | DHJJ Financial Advisors, Ltd. | 50 | 0.00 | 1 | 0.00 | ||||
| 2025-08-07 | 13F | Kestra Private Wealth Services, Llc | 32,954 | -41.32 | 705 | -44.13 | ||||
| 2025-08-12 | 13F | CIBC Private Wealth Group, LLC | 0 | -100.00 | 0 | |||||
| 2025-05-29 | NP | SYMIX - AlphaCentric Symmetry Strategy Fund Class I | 16,147 | 85.92 | 362 | 95.68 | ||||
| 2025-08-13 | 13F | Bayview Asset Management, Llc | Put | 71,500 | 1,529 | |||||
| 2025-08-14 | 13F | Goldman Sachs Group Inc | 0 | -100.00 | 0 | |||||
| 2025-08-11 | 13F | Synergy Investment Management, LLC | 0 | -100.00 | 0 | |||||
| 2025-07-17 | 13F | Barry Investment Advisors, LLC | 144,845 | -0.54 | 3,097 | -5.23 | ||||
| 2025-07-29 | 13F | Salomon & Ludwin, LLC | 247 | 0.00 | 5 | 0.00 | ||||
| 2025-07-30 | 13F | Drive Wealth Management, Llc | 142,151 | 388.95 | 3,039 | 366.10 | ||||
| 2025-07-08 | 13F | Nbc Securities, Inc. | 11,231 | 0.00 | 0 | |||||
| 2025-07-18 | 13F | Clarity Financial LLC | 145,019 | -40.80 | 3,101 | -43.60 | ||||
| 2025-08-14 | 13F | Macquarie Group Ltd | 35,243 | 11,766.33 | 753 | 12,450.00 | ||||
| 2025-08-07 | 13F | Cascade Financial Partners, LLC | 17,450 | 0.00 | 373 | -4.60 | ||||
| 2025-08-13 | 13F | Lido Advisors, LLC | 12,637 | 0.93 | 270 | -3.57 | ||||
| 2025-07-28 | 13F | Harbour Investments, Inc. | 84,876 | 10.51 | 1,815 | 5.28 | ||||
| 2025-08-11 | 13F | PFG Private Wealth Management, LLC | 0 | -100.00 | 0 | |||||
| 2025-08-13 | 13F | Townsquare Capital Llc | 0 | -100.00 | 0 | |||||
| 2025-07-11 | 13F | Farther Finance Advisors, LLC | 1,528 | 239.56 | 33 | 220.00 | ||||
| 2025-08-14 | 13F | Citadel Advisors Llc | Call | 13,800 | 79.22 | 295 | 71.51 | |||
| 2025-08-08 | 13F | Avantax Advisory Services, Inc. | 24,691 | -22.69 | 528 | -26.40 | ||||
| 2025-08-14 | 13F | Citadel Advisors Llc | 37,897 | -77.53 | 810 | -78.59 | ||||
| 2025-08-14 | 13F | Citadel Advisors Llc | Put | 66,800 | -63.68 | 1,428 | -65.39 | |||
| 2025-08-14 | 13F | Federation des caisses Desjardins du Quebec | 576 | 0.00 | 12 | 0.00 | ||||
| 2025-08-14 | 13F | Two Sigma Securities, Llc | 0 | -100.00 | 0 | |||||
| 2025-08-14 | 13F | Fmr Llc | 275 | -25.68 | 6 | -37.50 | ||||
| 2025-07-25 | 13F | Endowment Wealth Management, Inc. | 9,565 | 205 | ||||||
| 2025-08-14 | 13F | Raymond James Financial Inc | 133,338 | 85.26 | 2,851 | 76.47 | ||||
| 2025-07-30 | 13F | Phillips Financial Management, Llc | 0 | -100.00 | 0 | |||||
| 2025-07-25 | 13F | Cwm, Llc | 2,346 | 0.26 | 0 | |||||
| 2025-08-14 | 13F | IHT Wealth Management, LLC | 51,797 | 0.07 | 1,107 | -4.65 | ||||
| 2025-08-14 | 13F | Evergreen Capital Management Llc | 321,751 | 6.03 | 6,879 | 1.03 | ||||
| 2025-08-14 | 13F/A | Rockefeller Capital Management L.P. | 10,340 | 1.10 | 221 | -3.49 | ||||
| 2025-08-06 | 13F | Commonwealth Equity Services, Llc | 11,225 | -28.38 | 0 | |||||
| 2025-08-11 | 13F | Mount Lucas Management LP | 0 | -100.00 | 0 | |||||
| 2025-08-14 | 13F | Quantessence Capital LLC | 23,470 | 502 | ||||||
| 2025-07-16 | 13F | ORG Wealth Partners, LLC | 589 | 0.00 | 13 | -7.69 | ||||
| 2025-08-14 | 13F | Group One Trading, L.p. | 0 | -100.00 | 0 | |||||
| 2025-07-14 | 13F | Park Avenue Securities Llc | 25,183 | 1 | ||||||
| 2025-08-07 | 13F | Allworth Financial LP | 68 | 3.03 | 1 | 0.00 | ||||
| 2025-08-26 | 13F/A | Thrivent Financial For Lutherans | 10,950 | -57.15 | 0 | |||||
| 2025-06-26 | NP | FIXP - FolioBeyond Enhanced Fixed Income Premium ETF | 27,807 | -47.25 | 592 | -49.79 | ||||
| 2025-08-12 | 13F | Steward Partners Investment Advisory, Llc | 279 | -76.24 | 6 | -80.77 | ||||
| 2025-08-14 | 13F | Millennium Management Llc | 0 | -100.00 | 0 | |||||
| 2025-08-27 | NP | RYDEX VARIABLE TRUST - Multi-Hedge Strategies Fund Variable Annuity | Short | -8 | -71.43 | -0 | ||||
| 2025-08-14 | 13F | Bnp Paribas Arbitrage, Sa | 397,414 | 4,415,611.11 | 8,497 | |||||
| 2025-08-13 | 13F | Baker Avenue Asset Management, LP | 0 | -100.00 | 0 | |||||
| 2025-05-13 | 13F | SFI Advisors, LLC | 0 | -100.00 | 0 | |||||
| 2025-07-28 | 13F | BRYN MAWR TRUST Co | 375 | 0.00 | 8 | 0.00 | ||||
| 2025-08-14 | 13F | Robinson Capital Management, Llc | 29,420 | 18.45 | 629 | 13.74 | ||||
| 2025-05-06 | 13F | Wedbush Securities Inc | 0 | -100.00 | 0 | |||||
| 2025-07-17 | 13F/A | Capital Investment Advisors, LLC | 39,499 | -11.95 | 844 | -16.10 | ||||
| 2025-07-15 | 13F | Fortitude Family Office, LLC | 223 | 48.67 | 5 | 33.33 | ||||
| 2025-08-12 | 13F | Global Retirement Partners, LLC | 783 | 347.43 | 17 | 433.33 | ||||
| 2025-03-12 | 13F/A | Private Capital Management Llc | 0 | -100.00 | 0 | |||||
| 2025-07-22 | 13F | Wealthcare Advisory Partners LLC | 33,758 | 1.05 | 722 | -3.74 | ||||
| 2025-08-13 | 13F | Russell Investments Group, Ltd. | 74 | -23.71 | 2 | -50.00 | ||||
| 2025-08-14 | 13F | Comerica Bank | 14,880 | 12.48 | 318 | 7.43 | ||||
| 2025-08-28 | NP | TFAFX - Tactical Growth Allocation Fund Class I | 1,980 | 23.75 | 42 | 20.00 | ||||
| 2025-07-07 | 13F | Investors Research Corp | 177 | 0.00 | 4 | 0.00 | ||||
| 2025-08-06 | 13F | Golden State Wealth Management, LLC | 149 | 2.76 | 3 | 0.00 | ||||
| 2025-07-28 | 13F | Bridges Investment Management Inc | 66,044 | 38.99 | 1,412 | 32.46 | ||||
| 2025-08-14 | 13F | Mml Investors Services, Llc | 114,073 | 4.73 | 2 | 0.00 | ||||
| 2025-07-21 | 13F | Future Financial Wealth Managment LLC | 2,900 | 0.00 | 62 | -4.62 | ||||
| 2025-07-24 | 13F | IFP Advisors, Inc | 10,243 | -11.08 | 219 | -15.50 | ||||
| 2025-07-15 | 13F | MCF Advisors LLC | 6,453 | 0.00 | 138 | -4.86 | ||||
| 2025-08-11 | 13F | Principal Securities, Inc. | 933 | 0.00 | 20 | 0.00 | ||||
| 2025-08-14 | 13F | Royal Bank Of Canada | 103,293 | -52.35 | 2,208 | -54.61 | ||||
| 2025-07-31 | 13F | Wealthfront Advisers Llc | 28,970 | 19.63 | 619 | 14.00 | ||||
| 2025-07-31 | 13F | Cambridge Investment Research Advisors, Inc. | 40,100 | -0.85 | 1 | |||||
| 2025-08-19 | 13F | Anchor Investment Management, LLC | 200 | 0.00 | 4 | 0.00 | ||||
| 2025-08-12 | 13F | SRS Capital Advisors, Inc. | 3 | 0.00 | 0 | |||||
| 2025-08-12 | 13F | MAI Capital Management | 1,822 | -10.99 | 39 | -15.56 | ||||
| 2025-08-14 | 13F | Jane Street Group, Llc | Call | 0 | -100.00 | 0 | ||||
| 2025-08-14 | 13F | Jane Street Group, Llc | Put | 10,800 | 11.34 | 231 | 5.99 | |||
| 2025-08-12 | 13F | Change Path, LLC | 18,098 | 12.20 | 387 | 6.93 | ||||
| 2025-08-13 | 13F | Cerity Partners LLC | 0 | -100.00 | 0 | |||||
| 2025-07-30 | 13F | Brookstone Capital Management | 18,578 | -17.35 | 397 | -21.23 | ||||
| 2025-08-15 | 13F | Tower Research Capital LLC (TRC) | 55,151 | -14.25 | 1,179 | -18.30 | ||||
| 2025-04-29 | 13F | Element Wealth, LLC | 0 | -100.00 | 0 | |||||
| 2025-08-14 | 13F | Jane Street Group, Llc | 0 | -100.00 | 0 | |||||
| 2025-05-15 | 13F | Schonfeld Strategic Advisors LLC | 0 | -100.00 | 0 | |||||
| 2025-07-17 | 13F | Paradigm Financial Partners, Llc | 161,240 | -0.08 | 3,447 | -4.81 | ||||
| 2025-08-14 | 13F | Wells Fargo & Company/mn | 1,577,216 | 25.04 | 33,721 | 19.13 | ||||
| 2025-08-06 | 13F | AE Wealth Management LLC | 29,425 | 2.94 | 629 | -1.87 | ||||
| 2025-08-08 | 13F | Advyzon Investment Management, LLC | 14,646 | 1.78 | 313 | -2.80 | ||||
| 2025-08-13 | 13F | Northwestern Mutual Wealth Management Co | 22,287 | 39.77 | 476 | 33.33 | ||||
| 2025-08-08 | 13F | Emerald Investment Partners, Llc | 1,000 | 0.00 | 21 | -4.55 | ||||
| 2025-08-14 | 13F | Toroso Investments, LLC | 49,767 | -9.36 | 1,064 | -13.64 | ||||
| 2025-07-29 | 13F | Private Trust Co Na | 150 | 0.00 | 3 | 0.00 | ||||
| 2025-08-14 | 13F | Ameriprise Financial Inc | 296,604 | -8.33 | 6,341 | -12.65 | ||||
| 2025-08-14 | 13F | Man Group plc | 0 | -100.00 | 0 | |||||
| 2025-04-23 | 13F | Creative Financial Designs Inc /adv | 0 | -100.00 | 0 | |||||
| 2025-08-11 | 13F | Citigroup Inc | 18,497 | 0.33 | 395 | -4.36 | ||||
| 2025-05-08 | 13F | Us Bancorp \de\ | 0 | -100.00 | 0 | |||||
| 2025-08-14 | 13F | Napa Wealth Management | 22,193 | 3.97 | 474 | -1.04 | ||||
| 2025-08-15 | 13F | Kestra Advisory Services, LLC | 26,576 | 13.01 | 568 | 7.78 | ||||
| 2025-07-11 | 13F | SILVER OAK SECURITIES, Inc | 15,384 | 2.97 | 329 | -0.61 | ||||
| 2025-08-14 | 13F | GWM Advisors LLC | 533 | 0.00 | 11 | 0.00 | ||||
| 2025-08-13 | 13F | Transce3nd, LLC | 66,184 | 5.77 | 1,416 | 1.07 | ||||
| 2025-08-12 | 13F | Cynosure Management, Llc | 161,494 | 25.91 | 3,453 | 19.94 | ||||
| 2025-08-15 | 13F | Morgan Stanley | 741,903 | 0.44 | 15,862 | -4.31 | ||||
| 2025-07-17 | 13F | Janney Montgomery Scott LLC | 39,509 | -43.96 | 1 | -100.00 | ||||
| 2025-09-04 | 13F/A | Advisor Group Holdings, Inc. | 379,671 | 14.07 | 8,117 | 8.68 | ||||
| 2025-08-05 | 13F | Simplex Trading, Llc | 0 | -100.00 | 0 | |||||
| 2025-08-14 | 13F | Financial Advisory Service, Inc. | 422 | 0.00 | 9 | 0.00 | ||||
| 2025-04-23 | 13F | Symphony Financial, Ltd. Co. | 0 | -100.00 | 0 | -100.00 | ||||
| 2025-08-12 | 13F | Pathstone Holdings, LLC | 32,214 | 100.46 | 701 | 94.72 | ||||
| 2025-08-11 | 13F | TD Waterhouse Canada Inc. | 375 | 0.00 | 8 | 0.00 | ||||
| 2025-08-13 | 13F | Cambria Investment Management, L.P. | 0 | -100.00 | 0 | |||||
| 2025-07-28 | 13F | Mutual Advisors, LLC | 17,550 | -11.36 | 392 | -4.85 | ||||
| 2025-05-29 | NP | TFAZX - TFA Tactical Income Fund Class I | 8,400 | 0.00 | 188 | 5.03 | ||||
| 2025-08-13 | 13F | Sumitomo Mitsui Financial Group, Inc. | 14,223 | 0.00 | 304 | -4.70 | ||||
| 2025-08-14 | 13F | Hrt Financial Lp | 0 | -100.00 | 0 | |||||
| 2025-08-14 | 13F | Safeguard Investment Advisory Group, LLC | 0 | -100.00 | 0 | |||||
| 2025-08-27 | NP | RBNAX - Robinson Opportunistic Income Fund Class A Shares | 29,250 | 18.18 | 625 | 12.61 | ||||
| 2025-08-15 | 13F | Captrust Financial Advisors | 31,547 | -1.38 | 674 | -6.00 | ||||
| 2025-08-12 | 13F | J.w. Cole Advisors, Inc. | 15,104 | 323 | ||||||
| 2025-07-25 | 13F | Allspring Global Investments Holdings, LLC | 24,900 | -12.94 | 532 | -17.00 | ||||
| 2025-08-15 | 13F | Prevail Innovative Wealth Advisors, Llc | 111,968 | 14.54 | 2,394 | 9.12 | ||||
| 2025-08-01 | 13F | Envestnet Asset Management Inc | 600,405 | 8.37 | 12,837 | 3.25 | ||||
| 2025-07-24 | 13F | Copperwynd Financial, LLC | 0 | -100.00 | 0 | |||||
| 2025-08-14 | 13F | First Foundation Advisors | 30,064 | -9.29 | 643 | -13.59 | ||||
| 2025-08-13 | 13F | Natixis | 5 | 0.00 | 0 | |||||
| 2025-08-13 | 13F | Manning & Napier Advisors Llc | 33,803 | 0.16 | 723 | -4.62 | ||||
| 2025-08-14 | 13F | Stifel Financial Corp | 10,881 | 233 | ||||||
| 2025-08-18 | 13F | Wolverine Trading, Llc | Call | 22,200 | -20.43 | 471 | -23.66 | |||
| 2025-08-13 | 13F | Twin Peaks Wealth Advisors, LLC | 4,241 | 94 | ||||||
| 2025-08-13 | 13F | Virtus ETF Advisers LLC | 23 | 0 | ||||||
| 2025-08-11 | 13F | Private Advisor Group, LLC | 18,788 | -64.64 | 402 | -66.36 | ||||
| 2025-08-13 | 13F | Jones Financial Companies Lllp | 246 | 0.00 | 5 | 0.00 | ||||
| 2025-07-31 | 13F | Sumitomo Mitsui Trust Holdings, Inc. | 31,279 | 5.88 | 669 | 0.91 | ||||
| 2025-08-13 | 13F | Rsm Us Wealth Management Llc | 54,552 | -14.63 | 1,166 | -18.63 | ||||
| 2025-08-14 | 13F | Two Sigma Investments, Lp | 0 | -100.00 | 0 | |||||
| 2025-08-27 | NP | RYMSX - Guggenheim Multi-Hedge Strategies Fund Class P | Short | -5 | -76.19 | -0 | ||||
| 2025-08-12 | 13F | Jpmorgan Chase & Co | 4,980 | -32.63 | 106 | -35.76 | ||||
| 2025-08-14 | 13F | Bank Of America Corp /de/ | 523,995 | 1.88 | 11,203 | -2.93 | ||||
| 2025-08-14 | 13F | Aster Capital Management (DIFC) Ltd | 148,992 | 3,185 | ||||||
| 2025-07-08 | 13F | Parallel Advisors, LLC | 91 | 0.00 | 2 | -50.00 | ||||
| 2025-06-03 | 13F | Invst, LLC | 25,924 | 33.57 | 582 | 40.34 |
Other Listings
| MX:REM |