Mga Batayang Estadistika
| Pemilik Institusional | 119 total, 119 long only, 0 short only, 0 long/short - change of 4.39% MRQ |
| Alokasi Portofolio Rata-rata | 0.4051 % - change of 0.84% MRQ |
| Saham Institusional (Jangka Panjang) | 16,389,304 (ex 13D/G) - change of 1.30MM shares 8.63% MRQ |
| Nilai Institusional (Jangka Panjang) | $ 385,789 USD ($1000) |
Kepemilikan Institusional dan Pemegang Saham
SSGA Active Trust - SPDR SSGA Multi-Asset Real Return ETF (US:RLY) memiliki 119 pemilik institusional dan pemegang saham yang telah mengajukan formulir 13D/G atau 13F kepada Komisi Bursa Efek (Securities Exchange Commission/SEC). Lembaga-lembaga ini memegang total 16,389,304 saham. Pemegang saham terbesar meliputi Hantz Financial Services, Inc., Envestnet Asset Management Inc, D.a. Davidson & Co., Corrigan Financial, Inc., Savant Capital, LLC, First International Bank & Trust, Morgan Stanley, Bank Of America Corp /de/, Capital Analysts, Inc., and New England Capital Financial Advisors LLC .
Struktur kepemilikan institusional SSGA Active Trust - SPDR SSGA Multi-Asset Real Return ETF (ARCA:RLY) menunjukkan posisi terkini di perusahaan oleh institusi dan dana, serta perubahan terbaru dalam ukuran posisi. Pemegang saham utama dapat mencakup investor individu, reksa dana, dana lindung nilai, atau institusi. Jadwal 13D menunjukkan bahwa investor memegang (atau pernah memegang) lebih dari 5% saham perusahaan dan bermaksud (atau pernah bermaksud) untuk secara aktif mengejar perubahan strategi bisnis. Jadwal 13G menunjukkan investasi pasif lebih dari 5%.
The share price as of September 5, 2025 is 30.21 / share. Previously, on September 9, 2024, the share price was 27.52 / share. This represents an increase of 9.76% over that period.

Skor Sentimen Dana
Skor Sentimen Dana (sebelumnya dikenal sebagai Skor Akumulasi Kepemilikan) menemukan saham-saham yang paling banyak dibeli oleh dana. Ini adalah hasil dari model kuantitatif multi-faktor yang canggih yang mengidentifikasi perusahaan dengan tingkat akumulasi institusional tertinggi. Model penilaian menggunakan kombinasi dari total peningkatan pemilik yang diungkapkan, perubahan dalam alokasi portofolio pada pemilik tersebut, dan metrik lainnya. Angka berkisar dari 0 hingga 100, dengan angka yang lebih tinggi menunjukkan tingkat akumulasi yang lebih tinggi dibandingkan dengan perusahaan sejenisnya, dan 50 adalah rata-ratanya.
Frekuensi Pembaruan: Setiap Hari
Lihat Ownership Explorer, yang menyediakan daftar perusahaan dengan peringkat tertinggi.
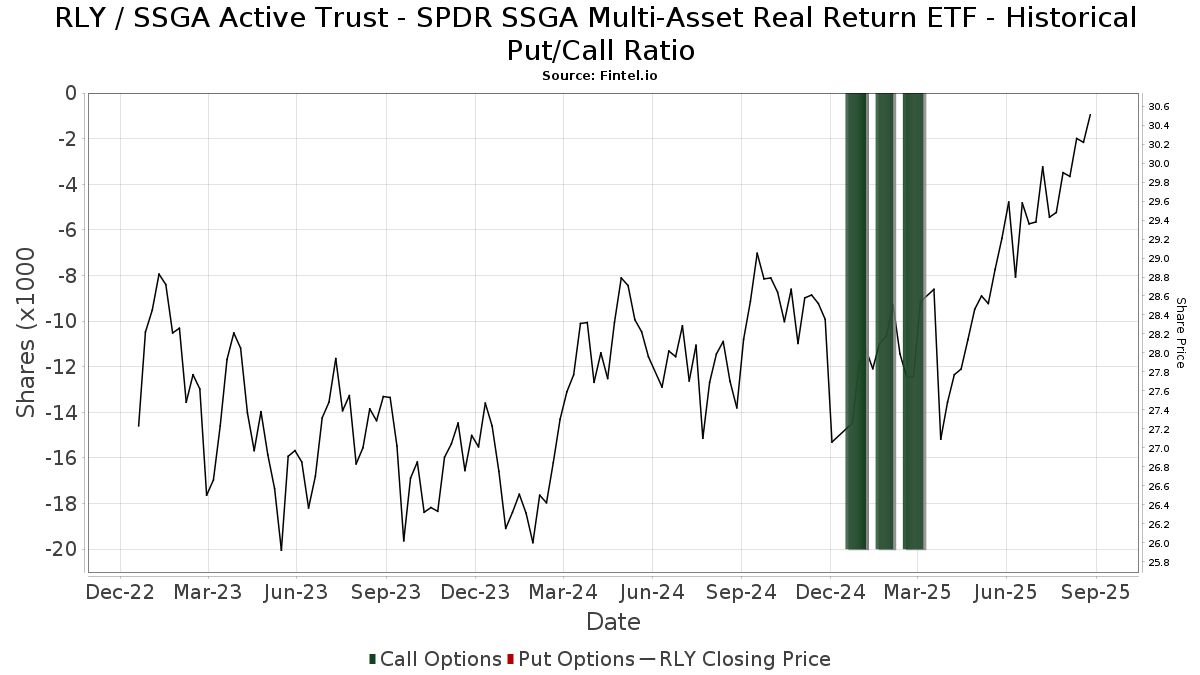
Rasio Put/Call Institusional
Selain melaporkan isu ekuitas dan utang standar, institusi dengan aset di bawah manajemen lebih dari 100 juta dolar AS juga harus mengungkapkan kepemilikan opsi put dan call mereka. Karena opsi put umumnya menunjukkan sentimen negatif, dan opsi call menunjukkan sentimen positif, kita dapat mengetahui sentimen institusional secara keseluruhan dengan memplot rasio put terhadap call. Grafik di sebelah kanan memplot rasio put/call historis untuk instrumen ini.
Menggunakan Rasio Put/Call sebagai indikator sentimen investor mengatasi salah satu kekurangan utama dari penggunaan total kepemilikan institusional, yaitu sejumlah besar aset yang dikelola diinvestasikan secara pasif untuk melacak indeks. Dana yang dikelola secara pasif biasanya tidak membeli opsi, sehingga indikator rasio put/call lebih akurat dalam melacak sentimen dana yang dikelola secara aktif.
Pengajuan 13F dan NPORT
Detail pada pengajuan 13F tersedia gratis. Detail pada pengajuan NP memerlukan keanggotaan premium. Baris berwarna hijau menunjukkan posisi baru. Baris berwarna merah menunjukkan posisi yang sudah ditutup. Klik tautan ini ikon untuk melihat riwayat transaksi selengkapnya.
Tingkatkan
untuk membuka data premium dan mengekspor ke Excel ![]() .
.
| Tanggal File | Sumber | Investor | Ketik | Presyo ng Avg (Silangan) |
Saham | Δ Saham (%) |
Dilaporkan Nilai ($1000) |
Nilai Δ (%) |
Alokasi Port (%) |
|
|---|---|---|---|---|---|---|---|---|---|---|
| 2025-07-01 | 13F | Private Client Services, Llc | 110,787 | 45.41 | 3,223 | 48.21 | ||||
| 2025-08-11 | 13F | Strategic Wealth Partners, Ltd. | 56 | 2 | ||||||
| 2025-04-22 | 13F/A | NorthRock Partners, LLC | 0 | -100.00 | 0 | |||||
| 2025-08-08 | 13F | Principal Financial Group Inc | 18,118 | 527 | ||||||
| 2025-05-12 | 13F | Fmr Llc | 0 | -100.00 | 0 | |||||
| 2025-08-12 | 13F | Park Square Financial Group, LLC | 29 | 0.00 | 1 | |||||
| 2025-08-14 | 13F | Colony Group, LLC | 263,332 | 5.45 | 7,660 | 7.48 | ||||
| 2025-05-15 | 13F | Two Sigma Securities, Llc | 0 | -100.00 | 0 | -100.00 | ||||
| 2025-08-13 | 13F | Cheviot Value Management, LLC | 111 | 0.00 | 3 | 0.00 | ||||
| 2025-08-15 | 13F | Kestra Advisory Services, LLC | 26,110 | -0.62 | 760 | 1.34 | ||||
| 2025-08-07 | 13F | Prairieview Wealth Partners, Llc | 14,696 | 428 | ||||||
| 2025-08-14 | 13F | Comerica Bank | 1,088 | -46.54 | 32 | -46.55 | ||||
| 2025-08-05 | 13F | Bank Of Montreal /can/ | 8,474 | 0.00 | 247 | 2.07 | ||||
| 2025-08-13 | 13F | Shepherd Financial Partners LLC | 9,255 | -2.72 | 269 | -0.74 | ||||
| 2025-08-14 | 13F | Jane Street Group, Llc | 0 | -100.00 | 0 | |||||
| 2025-07-10 | 13F | Trust Point Inc. | 0 | -100.00 | 0 | |||||
| 2025-07-10 | 13F | Sovran Advisors, LLC | 0 | -100.00 | 0 | |||||
| 2025-08-06 | 13F | Horan Securities, Inc. | 42,838 | -4.13 | 1,246 | -2.27 | ||||
| 2025-08-08 | 13F | Larson Financial Group LLC | 127,870 | -37.83 | 3,720 | -36.64 | ||||
| 2025-07-28 | 13F | Private Wealth Asset Management, LLC | 125 | 4 | ||||||
| 2025-07-15 | 13F | Legacy Financial Group LLC | 20,526 | -2.46 | 597 | -0.50 | ||||
| 2025-08-14 | 13F | RMB Capital Management, LLC | 282,230 | 1.66 | 8,210 | 3.62 | ||||
| 2025-08-14 | 13F | Bank Of America Corp /de/ | 715,255 | -4.66 | 20,807 | -2.82 | ||||
| 2025-08-14 | 13F | Qube Research & Technologies Ltd | 177 | 5 | ||||||
| 2025-07-25 | 13F | Apollon Wealth Management, LLC | 80,410 | -0.49 | 2,339 | 1.43 | ||||
| 2025-08-12 | 13F | Proequities, Inc. | 0 | 0 | ||||||
| 2025-04-15 | 13F | Corrigan Financial, Inc. | 904,459 | 1.67 | 25,813 | 7.39 | ||||
| 2025-07-22 | 13F | Merit Financial Group, LLC | 18,077 | -34.22 | 526 | -33.04 | ||||
| 2025-08-14 | 13F | Coastal Bridge Advisors, LLC | 34,946 | 139.54 | 1,017 | 144.23 | ||||
| 2025-08-01 | 13F | Schmidt P J Investment Management Inc | 9,175 | 20.77 | 267 | 23.15 | ||||
| 2025-08-11 | 13F | Private Advisor Group, LLC | 16,120 | -22.70 | 469 | -21.34 | ||||
| 2025-07-08 | 13F | First International Bank & Trust | 804,999 | -6.29 | 23,417 | -4.49 | ||||
| 2025-08-28 | NP | MFUL - Mindful Conservative ETF | 55,795 | -26.07 | 1,623 | -20.40 | ||||
| 2025-08-12 | 13F | LPL Financial LLC | 303,410 | -17.10 | 8,826 | -15.51 | ||||
| 2025-07-17 | 13F | Eclectic Associates Inc /adv | 23,156 | -18.24 | 674 | -16.71 | ||||
| 2025-07-28 | 13F | Harbour Investments, Inc. | 3,159 | 14.91 | 92 | 16.67 | ||||
| 2025-08-11 | 13F | Regal Investment Advisors LLC | 78,336 | -3.20 | 2,279 | -1.34 | ||||
| 2025-08-14 | 13F | Wiley Bros.-aintree Capital, Llc | 0 | -100.00 | 0 | |||||
| 2025-08-14 | 13F | Visionary Wealth Advisors | 106,307 | -69.54 | 3,092 | -68.95 | ||||
| 2025-08-01 | 13F | Pasadena Private Wealth, LLC | 12,447 | 8.26 | 362 | 10.37 | ||||
| 2025-08-14 | 13F | Catalyst Financial Partners Llc | 37,822 | 24.93 | 1,100 | 27.31 | ||||
| 2025-05-02 | 13F | Fortress Wealth Management, Inc. | 0 | -100.00 | 0 | |||||
| 2025-08-14 | 13F | Betterment LLC | 15,254 | -61.72 | 0 | -100.00 | ||||
| 2025-08-14 | 13F | LaSalle St. Investment Advisors, LLC | 8,728 | 0.28 | 0 | |||||
| 2025-08-14 | 13F | Citadel Advisors Llc | Put | 0 | -100.00 | 0 | ||||
| 2025-07-16 | 13F/A | CX Institutional | 137 | 0.00 | 0 | |||||
| 2025-08-04 | 13F | HBK Sorce Advisory LLC | 10,261 | -44.66 | 298 | -43.67 | ||||
| 2025-08-13 | 13F | Keystone Financial Group | 19,012 | -1.21 | 553 | 0.73 | ||||
| 2025-08-04 | 13F | Hantz Financial Services, Inc. | 1,984,674 | 0.07 | 58 | 1.79 | ||||
| 2025-05-15 | 13F | Creative Planning | 0 | -100.00 | 0 | |||||
| 2025-08-04 | 13F | Flagship Harbor Advisors, Llc | 15,331 | -5.58 | 446 | -3.89 | ||||
| 2025-08-06 | 13F | Commonwealth Equity Services, Llc | 38,232 | 68.11 | 1 | |||||
| 2025-08-15 | 13F | First Heartland Consultants, Inc. | 311,211 | 18.92 | 9,053 | 21.22 | ||||
| 2025-08-14 | 13F | Royal Bank Of Canada | 8,363 | 2.85 | 244 | 5.17 | ||||
| 2025-07-21 | 13F | Ameritas Advisory Services, LLC | 2,115 | 62 | ||||||
| 2025-05-14 | 13F | Orion Portfolio Solutions, LLC | 27,370 | 0.00 | 740 | 0.00 | ||||
| 2025-07-14 | 13F | Harbor Group, Inc. | 298,862 | -0.30 | 8,694 | 1.61 | ||||
| 2025-08-26 | 13F/A | Thrivent Financial For Lutherans | 74,308 | 145.20 | 2 | |||||
| 2025-08-01 | 13F | Envestnet Asset Management Inc | 1,332,162 | 4.89 | 38,753 | 6.91 | ||||
| 2025-07-16 | 13F | Twelve Points Wealth Management LLC | 50,592 | 2.58 | 1,472 | 4.55 | ||||
| 2025-08-04 | 13F | Atria Investments Llc | 69,258 | 2.87 | 2,015 | 4.84 | ||||
| 2025-07-09 | 13F | Fermata Advisors, LLC | 8,653 | -0.93 | 252 | 0.80 | ||||
| 2025-08-05 | 13F | Aviance Capital Partners, LLC | 29,857 | -4.27 | 869 | -2.47 | ||||
| 2025-08-27 | 13F/A | Brinker Capital Investments, LLC | 14,009 | 408 | ||||||
| 2025-07-16 | 13F | MBE Wealth Management, LLC | 86,710 | 0.11 | 2,522 | 2.02 | ||||
| 2025-07-16 | 13F | Register Financial Advisors LLC | 39,715 | 6.11 | 1,155 | 8.15 | ||||
| 2025-08-06 | 13F | Golden State Wealth Management, LLC | 79 | 0.00 | 2 | 0.00 | ||||
| 2025-08-12 | 13F | Steward Partners Investment Advisory, Llc | 400 | 0.00 | 12 | 0.00 | ||||
| 2025-08-15 | 13F | Captrust Financial Advisors | 62,206 | 13.70 | 1,810 | 15.89 | ||||
| 2025-04-15 | 13F | Ellenbecker Investment Group | 0 | -100.00 | 0 | |||||
| 2025-08-12 | 13F | Auxano Advisors, LLC | 7,244 | -28.27 | 211 | -27.08 | ||||
| 2025-08-14 | 13F | Wells Fargo & Company/mn | 296,665 | 2.64 | 8,630 | 4.61 | ||||
| 2025-05-14 | 13F | TD Capital Management LLC | 0 | -100.00 | 0 | |||||
| 2025-08-12 | 13F | Barnes Pettey Financial Advisors, Llc | 17,961 | 18.20 | 522 | 20.55 | ||||
| 2025-08-13 | 13F | Jones Financial Companies Lllp | 1,072 | 62.42 | 31 | 72.22 | ||||
| 2025-08-04 | 13F | Creative Financial Designs Inc /adv | 19,053 | -3.39 | 554 | -1.42 | ||||
| 2025-08-13 | 13F | Capital Analysts, Inc. | 660,306 | 2.18 | 19 | 5.56 | ||||
| 2025-07-18 | 13F | Trilogy Capital Inc. | 398,184 | -3.15 | 11,583 | -1.29 | ||||
| 2025-08-14 | 13F | CoreCap Advisors, LLC | 0 | -100.00 | 0 | |||||
| 2025-08-07 | 13F | Tilson Financial Group, Inc. | 258,999 | -3.34 | 8 | 0.00 | ||||
| 2025-08-11 | 13F | Brass Tax Wealth Management, Inc | 9,444 | 0.00 | 275 | 1.86 | ||||
| 2025-07-28 | 13F | Davidson Trust Co | 8,414 | 245 | ||||||
| 2025-08-07 | 13F | Illumine Investment Management, LLC | 52,656 | 1.38 | 1,532 | 3.31 | ||||
| 2025-07-09 | 13F | Veracity Capital LLC | 14,813 | 17.53 | 431 | 19.78 | ||||
| 2025-08-11 | 13F | HighTower Advisors, LLC | 364,177 | 18.02 | 10,594 | 20.29 | ||||
| 2025-07-14 | 13F | Matrix Trust Co | 48,058 | -4.65 | 1 | 0.00 | ||||
| 2025-07-28 | 13F | Cornerstone Wealth Group, LLC | 7,936 | 0.00 | 231 | 1.77 | ||||
| 2025-07-23 | 13F | L.K. Benson & Company, P.C. | 9,132 | 0.37 | 266 | 2.32 | ||||
| 2025-07-25 | 13F | Cwm, Llc | 147 | 0 | ||||||
| 2025-08-14 | 13F | Raymond James Financial Inc | 315,239 | 52.37 | 9,170 | 55.32 | ||||
| 2025-08-11 | 13F | United Advisor Group, LLC | 35,194 | 32.59 | 1,024 | 35.14 | ||||
| 2025-07-10 | 13F | Wealth Enhancement Advisory Services, Llc | 53,089 | -18.73 | 1,567 | -15.99 | ||||
| 2025-08-13 | 13F | Continuum Advisory, LLC | 0 | -100.00 | 0 | |||||
| 2025-08-12 | 13F | Cornerstone Wealth Management, LLC | 15,464 | 12.23 | 450 | 14.25 | ||||
| 2025-08-11 | 13F | Principal Securities, Inc. | 458 | 49.67 | 13 | 62.50 | ||||
| 2025-08-12 | 13F | Eldridge Investment Advisors, Inc. | 333,177 | 4.12 | 9,692 | 6.13 | ||||
| 2025-08-05 | 13F | Bank of New York Mellon Corp | 41,627 | 103.93 | 1,211 | 107.90 | ||||
| 2025-07-16 | 13F | ORG Partners LLC | 758 | 0.80 | 22 | 4.76 | ||||
| 2025-08-08 | 13F | Intrua Financial, LLC | 118,354 | 165.92 | 3,443 | 171.02 | ||||
| 2025-08-14 | 13F | Freedom Financial Partners LLC | 299,579 | 6.17 | 8,715 | 8.23 | ||||
| 2025-08-14 | 13F/A | Skopos Labs, Inc. | 5,309 | 154 | ||||||
| 2025-08-14 | 13F | GWM Advisors LLC | 165 | 0.00 | 5 | 0.00 | ||||
| 2025-08-04 | 13F | Capital Performance Advisors Llp | 228,667 | 24.57 | 6,652 | 26.98 | ||||
| 2025-08-12 | 13F | Advisors Asset Management, Inc. | 16,794 | 52.58 | 489 | 55.41 | ||||
| 2025-08-14 | 13F | Susquehanna International Group, Llp | 10,074 | 24.89 | 293 | 27.39 | ||||
| 2025-05-13 | 13F | Equitable Holdings, Inc. | 0 | -100.00 | 0 | |||||
| 2025-08-08 | 13F | Cetera Investment Advisers | 19,930 | 3.14 | 580 | 5.08 | ||||
| 2025-09-04 | 13F/A | Advisor Group Holdings, Inc. | 25,648 | 26.50 | 746 | 29.07 | ||||
| 2025-08-14 | 13F | Citadel Advisors Llc | Call | 0 | -100.00 | 0 | ||||
| 2025-07-17 | 13F | KWB Wealth | 45,733 | 1,305 | ||||||
| 2025-05-12 | 13F | Jpmorgan Chase & Co | 0 | -100.00 | 0 | |||||
| 2025-08-28 | NP | NDOW - Anydrus Advantage ETF | 23,216 | 675 | ||||||
| 2025-05-15 | 13F | Citadel Advisors Llc | 0 | -100.00 | 0 | -100.00 | ||||
| 2025-07-15 | 13F | Retireful, LLC | 79,011 | 2,298 | ||||||
| 2025-08-08 | 13F | SBI Securities Co., Ltd. | 2,140 | -0.97 | 62 | 1.64 | ||||
| 2025-09-02 | 13F/A | FSC Wealth Advisors, LLC | 9,835 | -3.08 | 286 | -1.04 | ||||
| 2025-07-29 | 13F | Private Trust Co Na | 600 | 0.00 | 17 | 0.00 | ||||
| 2025-08-08 | 13F | New England Capital Financial Advisors LLC | 481,954 | -0.53 | 14,020 | 1.39 | ||||
| 2025-05-16 | 13F/A | Goldman Sachs Group Inc | 0 | -100.00 | 0 | -100.00 | ||||
| 2025-07-17 | 13F | XML Financial, LLC | 24,428 | 711 | ||||||
| 2025-07-17 | 13F | XY Planning Network, Inc. | 27,972 | 814 | ||||||
| 2025-07-31 | 13F | Cambridge Investment Research Advisors, Inc. | 20,622 | 34.01 | 1 | |||||
| 2025-08-20 | 13F/A | Coppell Advisory Solutions LLC | 10,467 | 304 | ||||||
| 2025-08-13 | 13F | Scotia Capital Inc. | 40,119 | -3.56 | 1,167 | -1.68 | ||||
| 2025-08-18 | NP | A3 Alternative Credit Fund | 0 | -100.00 | 0 | -100.00 | ||||
| 2025-08-12 | 13F | Global Retirement Partners, LLC | 5,029 | 527.06 | 146 | 595.24 | ||||
| 2025-07-22 | 13F | Miracle Mile Advisors, LLC | 16,858 | -0.28 | 490 | 1.66 | ||||
| 2025-08-11 | 13F | Advisor Resource Council | 0 | -100.00 | 0 | |||||
| 2025-08-14 | 13F | Federation des caisses Desjardins du Quebec | 4,000 | 0.00 | 116 | 1.75 | ||||
| 2025-08-15 | 13F | Morgan Stanley | 798,709 | 36.11 | 23,234 | 38.74 | ||||
| 2025-08-08 | 13F | Cornerstone Advisors Asset Management, Inc | 53,649 | 0.59 | 1,561 | 2.50 | ||||
| 2025-08-13 | 13F | Northwestern Mutual Wealth Management Co | 9 | -94.58 | 0 | -100.00 | ||||
| 2025-08-18 | 13F | Geneos Wealth Management Inc. | 102,091 | 53.68 | 2,970 | 56.68 | ||||
| 2025-07-08 | 13F | Parallel Advisors, LLC | 54 | 0.00 | 2 | 0.00 | ||||
| 2025-08-04 | 13F | IFG Advisory, LLC | 22,998 | 3.59 | 669 | 5.69 | ||||
| 2025-08-12 | 13F | MAI Capital Management | 1,518 | -10.44 | 44 | -8.33 | ||||
| 2025-08-14 | 13F | UBS Group AG | 77,850 | -43.04 | 2,265 | -41.95 | ||||
| 2025-08-13 | 13F | Independent Family Office, LLC | 39,611 | -6.35 | 1,152 | -4.56 | ||||
| 2025-07-30 | 13F | D.a. Davidson & Co. | 1,259,697 | 5.43 | 36,645 | 7.46 | ||||
| 2025-08-14 | 13F | Smartleaf Asset Management LLC | 0 | -100.00 | 0 | |||||
| 2025-08-06 | 13F | Savant Capital, LLC | 902,347 | 26,249 | ||||||
| 2025-07-11 | 13F | Farther Finance Advisors, LLC | 7,806 | 70,863.64 | 227 |