Mga Batayang Estadistika
| Pemilik Institusional | 174 total, 174 long only, 0 short only, 0 long/short - change of -2.25% MRQ |
| Alokasi Portofolio Rata-rata | 0.5234 % - change of 8.47% MRQ |
| Saham Institusional (Jangka Panjang) | 34,604,406 (ex 13D/G) - change of 0.78MM shares 2.30% MRQ |
| Nilai Institusional (Jangka Panjang) | $ 771,463 USD ($1000) |
Kepemilikan Institusional dan Pemegang Saham
SPDR Series Trust - SPDR Portfolio Long Term Corporate Bond ETF (US:SPLB) memiliki 174 pemilik institusional dan pemegang saham yang telah mengajukan formulir 13D/G atau 13F kepada Komisi Bursa Efek (Securities Exchange Commission/SEC). Lembaga-lembaga ini memegang total 34,604,406 saham. Pemegang saham terbesar meliputi State Street Corp, LPL Financial LLC, RMG Wealth Management LLC, FISR - SPDR SSGA Fixed Income Sector Rotation ETF, Rockland Trust Co, SSTIX - State Street Total Return V.I.S. Fund Class 1 Shares, Nyl Investors Llc, Envestnet Asset Management Inc, Morgan Stanley, and Envestnet Portfolio Solutions, Inc. .
Struktur kepemilikan institusional SPDR Series Trust - SPDR Portfolio Long Term Corporate Bond ETF (ARCA:SPLB) menunjukkan posisi terkini di perusahaan oleh institusi dan dana, serta perubahan terbaru dalam ukuran posisi. Pemegang saham utama dapat mencakup investor individu, reksa dana, dana lindung nilai, atau institusi. Jadwal 13D menunjukkan bahwa investor memegang (atau pernah memegang) lebih dari 5% saham perusahaan dan bermaksud (atau pernah bermaksud) untuk secara aktif mengejar perubahan strategi bisnis. Jadwal 13G menunjukkan investasi pasif lebih dari 5%.
The share price as of September 5, 2025 is 22.94 / share. Previously, on September 9, 2024, the share price was 24.08 / share. This represents a decline of 4.73% over that period.

Skor Sentimen Dana
Skor Sentimen Dana (sebelumnya dikenal sebagai Skor Akumulasi Kepemilikan) menemukan saham-saham yang paling banyak dibeli oleh dana. Ini adalah hasil dari model kuantitatif multi-faktor yang canggih yang mengidentifikasi perusahaan dengan tingkat akumulasi institusional tertinggi. Model penilaian menggunakan kombinasi dari total peningkatan pemilik yang diungkapkan, perubahan dalam alokasi portofolio pada pemilik tersebut, dan metrik lainnya. Angka berkisar dari 0 hingga 100, dengan angka yang lebih tinggi menunjukkan tingkat akumulasi yang lebih tinggi dibandingkan dengan perusahaan sejenisnya, dan 50 adalah rata-ratanya.
Frekuensi Pembaruan: Setiap Hari
Lihat Ownership Explorer, yang menyediakan daftar perusahaan dengan peringkat tertinggi.
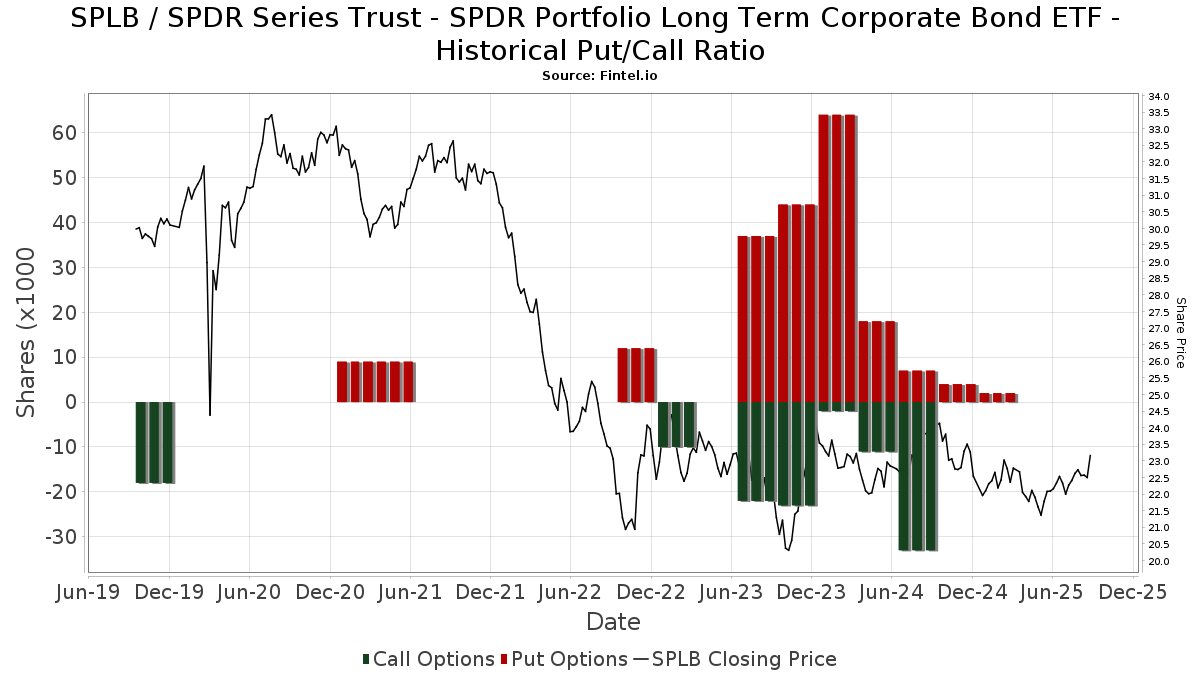
Rasio Put/Call Institusional
Selain melaporkan isu ekuitas dan utang standar, institusi dengan aset di bawah manajemen lebih dari 100 juta dolar AS juga harus mengungkapkan kepemilikan opsi put dan call mereka. Karena opsi put umumnya menunjukkan sentimen negatif, dan opsi call menunjukkan sentimen positif, kita dapat mengetahui sentimen institusional secara keseluruhan dengan memplot rasio put terhadap call. Grafik di sebelah kanan memplot rasio put/call historis untuk instrumen ini.
Menggunakan Rasio Put/Call sebagai indikator sentimen investor mengatasi salah satu kekurangan utama dari penggunaan total kepemilikan institusional, yaitu sejumlah besar aset yang dikelola diinvestasikan secara pasif untuk melacak indeks. Dana yang dikelola secara pasif biasanya tidak membeli opsi, sehingga indikator rasio put/call lebih akurat dalam melacak sentimen dana yang dikelola secara aktif.
Pengajuan 13F dan NPORT
Detail pada pengajuan 13F tersedia gratis. Detail pada pengajuan NP memerlukan keanggotaan premium. Baris berwarna hijau menunjukkan posisi baru. Baris berwarna merah menunjukkan posisi yang sudah ditutup. Klik tautan ini ikon untuk melihat riwayat transaksi selengkapnya.
Tingkatkan
untuk membuka data premium dan mengekspor ke Excel ![]() .
.
| Tanggal File | Sumber | Investor | Ketik | Presyo ng Avg (Silangan) |
Saham | Δ Saham (%) |
Dilaporkan Nilai ($1000) |
Nilai Δ (%) |
Alokasi Port (%) |
|
|---|---|---|---|---|---|---|---|---|---|---|
| 2025-08-08 | 13F | Advyzon Investment Management, LLC | 52,428 | 2.38 | 1,183 | 2.42 | ||||
| 2025-08-06 | 13F | Prospera Financial Services Inc | 58,191 | -7.80 | 1,314 | -7.79 | ||||
| 2025-08-14 | 13F | Qube Research & Technologies Ltd | 224 | 0.00 | 5 | 0.00 | ||||
| 2025-05-14 | 13F | Joseph P. Lucia & Associates, LLC | 0 | -100.00 | 0 | |||||
| 2025-08-14 | 13F | Hrt Financial Lp | 0 | -100.00 | 0 | |||||
| 2025-08-28 | NP | SSTIX - State Street Total Return V.I.S. Fund Class 1 Shares | 1,671,861 | 2.26 | 37,734 | 2.25 | ||||
| 2025-07-28 | 13F | RFG Advisory, LLC | 44,063 | 7.35 | 995 | 7.34 | ||||
| 2025-08-14 | 13F | Integrated Wealth Concepts LLC | 0 | -100.00 | 0 | |||||
| 2025-08-14 | 13F | Jane Street Group, Llc | 23,224 | -97.85 | 524 | -97.85 | ||||
| 2025-07-17 | 13F | Raleigh Capital Management Inc. | 95,032 | 12.03 | 2,145 | 12.02 | ||||
| 2025-08-13 | 13F | Nyl Investors Llc | 1,450,074 | 0.22 | 32,728 | 0.22 | ||||
| 2025-08-01 | 13F | Austin Private Wealth, LLC | 205,918 | 82.69 | 4,648 | 82.74 | ||||
| 2025-04-10 | 13F | Matrix Trust Co | 0 | -100.00 | 0 | |||||
| 2025-07-22 | 13F | Iron Horse Wealth Management, LLC | 565 | 1.07 | 13 | 0.00 | ||||
| 2025-08-05 | 13F | Strategic Financial Concepts, LLC | 13,383 | -5.66 | 302 | -5.62 | ||||
| 2025-05-13 | 13F | Franklin Resources Inc | 0 | -100.00 | 0 | -100.00 | ||||
| 2025-07-11 | 13F | International Private Wealth Advisors LLC | 24,098 | 26.36 | 544 | 26.28 | ||||
| 2025-07-22 | 13F | White & Co Financial Planning Inc | 321,114 | 1.17 | 7,180 | 0.67 | ||||
| 2025-08-14 | 13F | Stifel Financial Corp | 12,299 | 278 | ||||||
| 2025-07-25 | 13F | Envestnet Portfolio Solutions, Inc. | 928,868 | 11.21 | 20,965 | 11.21 | ||||
| 2025-07-18 | 13F | Truist Financial Corp | 25,575 | -80.64 | 577 | -80.64 | ||||
| 2025-08-12 | 13F | Absolute Capital Management, LLC | 12,499 | -2.41 | 282 | -2.42 | ||||
| 2025-08-26 | 13F/A | Thrivent Financial For Lutherans | 0 | -100.00 | 0 | -100.00 | ||||
| 2025-07-08 | 13F | Boltwood Capital Management | 45,800 | -6.44 | 1,034 | -6.43 | ||||
| 2025-07-24 | 13F | IFP Advisors, Inc | 247,071 | 1.19 | 5,576 | 1.20 | ||||
| 2025-07-30 | 13F | Brookstone Capital Management | 0 | -100.00 | 0 | |||||
| 2025-07-16 | 13F | Twelve Points Wealth Management LLC | 17,428 | -12.00 | 393 | -12.08 | ||||
| 2025-08-12 | 13F | Jpmorgan Chase & Co | 150,974 | 2.45 | 3,407 | 2.44 | ||||
| 2025-08-14 | 13F | New England Asset Management Inc | 3,000 | 0.00 | 68 | 0.00 | ||||
| 2025-08-14 | 13F | Comerica Bank | 1,478 | 1.86 | 33 | 3.13 | ||||
| 2025-08-14 | 13F | Goldman Sachs Group Inc | 169,829 | 623.11 | 3,833 | 623.21 | ||||
| 2025-08-06 | 13F | Aspetuck Financial Management LLC | 121,648 | 5.64 | 2,746 | 5.66 | ||||
| 2025-08-12 | 13F | Ameritas Investment Partners, Inc. | 34,905 | 1.57 | 788 | 1.55 | ||||
| 2025-07-25 | 13F | Atria Wealth Solutions, Inc. | 19,080 | -11.92 | 431 | -11.89 | ||||
| 2025-08-28 | NP | INKM - SPDR SSGA Income Allocation ETF This fund is a listed as child fund of State Street Corp and if that institution has disclosed ownership in this security, then these positions will not be double counted when calculating total shares and total value | 57,166 | -10.58 | 1,290 | -10.54 | ||||
| 2025-08-14 | 13F | Transamerica Financial Advisors, Inc. | 81 | 0.00 | 2 | |||||
| 2025-08-14 | 13F | Smartleaf Asset Management LLC | 2,372 | 91.60 | 53 | 96.30 | ||||
| 2025-08-01 | 13F | Banco Santander, S.A. | 17,822 | 0.00 | 402 | 0.00 | ||||
| 2025-07-21 | 13F | Ameritas Advisory Services, LLC | 1 | 0 | ||||||
| 2025-07-28 | 13F | Harbour Investments, Inc. | 64,527 | 22.65 | 1,456 | 22.66 | ||||
| 2025-08-14 | 13F | Tudor Investment Corp Et Al | 0 | -100.00 | 0 | |||||
| 2025-08-08 | 13F | Collaborative Wealth Managment Inc. | 191,128 | -11.58 | 4,314 | -11.58 | ||||
| 2025-08-15 | 13F | Equitable Holdings, Inc. | 0 | -100.00 | 0 | |||||
| 2025-08-13 | 13F | Flow Traders U.s. Llc | 75,587 | 2 | ||||||
| 2025-08-13 | 13F | Rsm Us Wealth Management Llc | 10,788 | 243 | ||||||
| 2025-08-05 | 13F | Landmark Wealth Management, Inc. | 148,474 | 14.51 | 3,351 | 14.52 | ||||
| 2025-07-23 | 13F | RMG Wealth Management LLC | 2,097,447 | 46,400 | ||||||
| 2025-08-04 | 13F | Flagship Harbor Advisors, Llc | 171,121 | 3,862 | ||||||
| 2025-07-02 | 13F | HBW Advisory Services LLC | 0 | -100.00 | 0 | |||||
| 2025-08-14 | 13F | Fmr Llc | 0 | -100.00 | 0 | |||||
| 2025-07-10 | 13F | Global Financial Private Client, LLC | 29,802 | 20.67 | 673 | 20.65 | ||||
| 2025-07-14 | 13F | Caitlin John, LLC | 75,728 | -62.68 | 1,709 | -62.69 | ||||
| 2025-08-14 | 13F | Harwood Advisory Group, LLC | 10 | -44.44 | 0 | |||||
| 2025-08-14 | 13F | Bnp Paribas Arbitrage, Sa | 0 | -100.00 | 0 | |||||
| 2025-07-23 | 13F | Capstone Wealth Management Group, Llc | 53,273 | -80.87 | 1,202 | -80.87 | ||||
| 2025-08-14 | 13F | EP Wealth Advisors, Inc. | 5,000 | 1.34 | 113 | 0.90 | ||||
| 2025-08-14 | 13F | Heritage Wealth Management, Inc. | 9,250 | 0.00 | 209 | 0.00 | ||||
| 2025-07-10 | 13F | Rockland Trust Co | 1,681,304 | 3.46 | 37,947 | 3.47 | ||||
| 2025-09-04 | 13F/A | Advisor Group Holdings, Inc. | 409,259 | 32.29 | 9,237 | 32.28 | ||||
| 2025-07-21 | 13F | Mirae Asset Global Investments Co., Ltd. | 305,000 | 15.53 | 6,884 | 16.03 | ||||
| 2025-08-14 | 13F | GWM Advisors LLC | 137,711 | 3.52 | 3,108 | 3.53 | ||||
| 2025-08-12 | 13F | RiverFront Investment Group, LLC | 19,696 | -88.27 | 445 | -88.28 | ||||
| 2025-08-12 | 13F | J.w. Cole Advisors, Inc. | 90,285 | 2,038 | ||||||
| 2025-08-28 | NP | GPMIX - GuidePath(R) Multi-Asset Income Allocation Fund Service Shares | 61,824 | 33.38 | 1,395 | 33.37 | ||||
| 2025-07-25 | 13F | Northwest Capital Management Inc | 121 | -91.43 | 3 | -93.55 | ||||
| 2025-07-25 | 13F | Van Strum & Towne Inc. | 169,403 | -11.07 | 3,823 | -11.07 | ||||
| 2025-08-13 | 13F | Townsquare Capital Llc | 0 | -100.00 | 0 | |||||
| 2025-08-14 | 13F/A | Barclays Plc | 1 | 0.00 | 0 | |||||
| 2025-08-14 | 13F | Ameriprise Financial Inc | 48,857 | -17.89 | 1,103 | -17.88 | ||||
| 2025-07-11 | 13F | Farther Finance Advisors, LLC | 7,621 | 10.58 | 172 | 10.97 | ||||
| 2025-07-03 | 13F | City Center Advisors, LLC | 15,541 | 10.62 | 351 | 10.41 | ||||
| 2025-08-18 | 13F | Geneos Wealth Management Inc. | 30,128 | 2.76 | 680 | 2.72 | ||||
| 2025-08-01 | 13F | Gwn Securities Inc. | 59,854 | 105.04 | 1,353 | 105.31 | ||||
| 2025-07-09 | 13F | VisionPoint Advisory Group, LLC | 17,639 | 398 | ||||||
| 2025-04-10 | 13F | Legacy Financial Group LLC | 0 | -100.00 | 0 | |||||
| 2025-08-13 | 13F | Level Four Advisory Services, Llc | 19,007 | -3.48 | 429 | -3.60 | ||||
| 2025-08-13 | 13F | Cary Street Partners Financial Llc | 88,481 | -7.10 | 1,997 | -7.07 | ||||
| 2025-08-06 | NP | LINCOLN VARIABLE INSURANCE PRODUCTS TRUST - LVIP SSGA Global Tactical Allocation Managed Volatility Fund Standard Class | 908,039 | 73.18 | 20,494 | 73.18 | ||||
| 2025-08-15 | 13F | Truefg, Llc | 52,076 | 5.72 | 1,175 | 5.76 | ||||
| 2025-08-12 | 13F | Richard W. Paul & Associates, LLC | 6,266 | 5.63 | 141 | 6.02 | ||||
| 2025-05-09 | 13F | Frazier Financial Advisors, LLC | 0 | -100.00 | 0 | |||||
| 2025-08-14 | 13F | Two Sigma Securities, Llc | 44,693 | 119.48 | 1,009 | 119.61 | ||||
| 2025-08-11 | 13F | Outlook Wealth Advisors, LLC | 21,572 | 6.91 | 487 | 6.81 | ||||
| 2025-08-14 | 13F | Capitolis Liquid Global Markets LLC | 0 | -100.00 | 0 | |||||
| 2025-08-06 | 13F | Csenge Advisory Group | 10,365 | 0.88 | 228 | 1.79 | ||||
| 2025-08-01 | 13F | Envestnet Asset Management Inc | 1,366,362 | 6.33 | 30,839 | 6.33 | ||||
| 2025-08-07 | 13F | Guidance Capital, Inc | 17,799 | -35.34 | 401 | -33.39 | ||||
| 2025-08-08 | 13F | Capital Investment Advisory Services, LLC | 10 | 11.11 | 0 | |||||
| 2025-08-11 | 13F | Pineridge Advisors LLC | 15 | 0.00 | 0 | |||||
| 2025-07-24 | 13F | Blair William & Co/il | 994 | 22 | ||||||
| 2025-08-13 | 13F | Global Endowment Management, LP | 13,903 | 6.30 | 314 | 6.10 | ||||
| 2025-08-13 | 13F | Jones Financial Companies Lllp | 19,160 | -16.01 | 428 | -16.41 | ||||
| 2025-08-14 | 13F | Citadel Advisors Llc | Put | 0 | -100.00 | 0 | ||||
| 2025-08-11 | 13F | Private Advisor Group, LLC | 230,197 | -5.82 | 5,196 | -5.82 | ||||
| 2025-07-17 | 13F | LifeGoal Wealth Advisors | 11,669 | -20.01 | 263 | -20.06 | ||||
| 2025-05-15 | 13F | Tower Research Capital LLC (TRC) | 0 | -100.00 | 0 | |||||
| 2025-08-15 | 13F | Morgan Stanley | 1,055,906 | -3.45 | 23,832 | -3.45 | ||||
| 2025-08-14 | 13F | Citadel Advisors Llc | 0 | -100.00 | 0 | |||||
| 2025-08-05 | 13F | Westside Investment Management, Inc. | 48,599 | 95.46 | 1,097 | 95.37 | ||||
| 2025-08-14 | 13F | Citadel Advisors Llc | Call | 0 | -100.00 | 0 | ||||
| 2025-04-23 | 13F | IMG Wealth Management, Inc. | 0 | -100.00 | 0 | |||||
| 2025-08-13 | 13F | VestGen Advisors, LLC | 10,238 | 231 | ||||||
| 2025-07-21 | 13F | Ascent Group, LLC | 22,717 | 16.66 | 513 | 16.63 | ||||
| 2025-08-14 | 13F | Wiley Bros.-aintree Capital, Llc | 29,658 | -10.08 | 669 | -9.72 | ||||
| 2025-07-30 | 13F | Insight Advisors, LLC/ PA | 31,496 | -7.11 | 711 | -7.19 | ||||
| 2025-07-22 | 13F | Merit Financial Group, LLC | 27,372 | 618 | ||||||
| 2025-08-08 | 13F | Emerald Investment Partners, Llc | 10,330 | -48.03 | 233 | -47.99 | ||||
| 2025-08-14 | 13F | Susquehanna International Group, Llp | 16,692 | -85.67 | 377 | -85.70 | ||||
| 2025-08-14 | 13F | Talon Private Wealth, LLC | 1,908 | 43 | ||||||
| 2025-07-24 | 13F | Conning Inc. | 124,080 | 0.00 | 2,800 | 0.00 | ||||
| 2025-08-28 | NP | FISR - SPDR SSGA Fixed Income Sector Rotation ETF This fund is a listed as child fund of State Street Corp and if that institution has disclosed ownership in this security, then these positions will not be double counted when calculating total shares and total value | 2,039,540 | -2.28 | 46,032 | -2.28 | ||||
| 2025-08-08 | 13F | SBI Securities Co., Ltd. | 6,343 | 8.54 | 143 | 9.16 | ||||
| 2025-08-14 | 13F | Novus Advisors, Llc | 35,561 | 4.99 | 803 | 4.97 | ||||
| 2025-07-29 | 13F | Balboa Wealth Partners | 21,264 | 5.49 | 480 | 5.51 | ||||
| 2025-07-23 | 13F | Valmark Advisers, Inc. | 11,565 | -3.77 | 261 | -3.69 | ||||
| 2025-08-06 | 13F | Commonwealth Equity Services, Llc | 22,080 | 6.41 | 0 | |||||
| 2025-08-13 | 13F | GeoWealth Management, LLC | 16,424 | 11.55 | 371 | 11.45 | ||||
| 2025-05-01 | 13F | Quest 10 Wealth Builders, Inc. | 6 | 0 | ||||||
| 2025-08-14 | 13F | Wells Fargo & Company/mn | 373,193 | -27.34 | 8,423 | -27.35 | ||||
| 2025-07-10 | 13F | Sterling Financial Group, Inc. | 837,120 | 1.46 | 18,894 | 1.46 | ||||
| 2025-07-16 | 13F | Novem Group | 50,538 | 9.22 | 1,141 | 9.20 | ||||
| 2025-08-19 | 13F | Newbridge Financial Services Group, Inc. | 3,171 | 1.34 | 72 | 1.43 | ||||
| 2025-07-17 | 13F | Sound Income Strategies, LLC | 1,705 | -2.07 | 38 | -2.56 | ||||
| 2025-08-01 | 13F | Advisory Alpha, LLC | 13,251 | 5.91 | 299 | 6.03 | ||||
| 2025-08-05 | 13F | NewSquare Capital LLC | 420 | 0.00 | 9 | 0.00 | ||||
| 2025-08-13 | 13F | Northwestern Mutual Wealth Management Co | 690,540 | -22.25 | 15,585 | -22.25 | ||||
| 2025-08-06 | 13F | Decker Retirement Planning Inc. | 9,009 | 3.30 | 203 | 3.57 | ||||
| 2025-04-11 | 13F/A | Private Advisory Group LLC | 0 | -100.00 | 0 | -100.00 | ||||
| 2025-08-14 | 13F | IHT Wealth Management, LLC | 18,110 | -15.29 | 409 | -15.35 | ||||
| 2025-07-25 | 13F | Richardson Financial Services Inc. | 21,695 | 8.11 | 489 | 8.19 | ||||
| 2025-05-30 | NP | BRMSX - Bramshill Income Performance Fund Institutional Class | 106,266 | 2,398 | ||||||
| 2025-08-14 | 13F | Synovus Financial Corp | 111,543 | 6.29 | 2,518 | 6.29 | ||||
| 2025-05-29 | NP | FFSAX - Touchstone Flexible Income Fund Class A | 97,909 | 2,210 | ||||||
| 2025-08-13 | 13F | Vermillion & White Wealth Management Group, LLC | 44 | 0.00 | 1 | |||||
| 2025-07-14 | 13F | Iams Wealth Management, Llc | 18,024 | 27.90 | 407 | 27.67 | ||||
| 2025-07-08 | 13F | Goldstone Financial Group, LLC | 508,205 | -4.56 | 11,409 | -5.06 | ||||
| 2025-07-10 | 13F | Sharkey, Howes & Javer | 135,123 | 3,050 | ||||||
| 2025-08-28 | NP | GAL - SPDR SSGA Global Allocation ETF This fund is a listed as child fund of State Street Corp and if that institution has disclosed ownership in this security, then these positions will not be double counted when calculating total shares and total value | 405,905 | 7.84 | 9,161 | 7.84 | ||||
| 2025-08-11 | 13F | HighTower Advisors, LLC | 76,368 | 10.47 | 1,724 | 10.45 | ||||
| 2025-08-11 | 13F | Principal Securities, Inc. | 141,937 | 42.53 | 3,204 | 44.74 | ||||
| 2025-08-05 | 13F | Bank of New York Mellon Corp | 310,914 | 10.65 | 7,017 | 10.64 | ||||
| 2025-08-12 | 13F | Wayfinding Financial, LLC | 0 | -100.00 | 0 | |||||
| 2025-07-24 | 13F | Eastern Bank | 0 | -100.00 | 0 | |||||
| 2025-08-11 | 13F | Covestor Ltd | 253 | 328.81 | 0 | |||||
| 2025-08-04 | 13F | Creative Financial Designs Inc /adv | 2,617 | 36.73 | 59 | 37.21 | ||||
| 2025-07-24 | 13F | Ronald Blue Trust, Inc. | 792 | -66.89 | 18 | -67.92 | ||||
| 2025-07-28 | 13F | Axxcess Wealth Management, Llc | 49,915 | 7.00 | 1,127 | 7.03 | ||||
| 2025-08-14 | 13F | UBS Group AG | 77,937 | -77.93 | 1,759 | -77.93 | ||||
| 2025-08-12 | 13F | Proequities, Inc. | 0 | 0 | ||||||
| 2025-08-08 | 13F | Hedeker Wealth, LLC | 296,068 | -0.60 | 6,682 | -0.60 | ||||
| 2025-05-06 | 13F | Boyd Watterson Asset Management Llc/oh | 0 | -100.00 | 0 | |||||
| 2025-07-31 | 13F | Arrien Investments, Inc. | 169,298 | 3,821 | ||||||
| 2025-08-12 | 13F | BlackRock, Inc. | 173,382 | 0.90 | 3,913 | 0.90 | ||||
| 2025-08-14 | 13F | Graney & King, LLC | 172,636 | 8.73 | 3,896 | 8.74 | ||||
| 2025-08-08 | 13F | Pnc Financial Services Group, Inc. | 7,144 | -10.05 | 161 | -10.06 | ||||
| 2025-04-21 | 13F | Nelson, Van Denburg & Campbell Wealth Management Group, LLC | 0 | -100.00 | 0 | |||||
| 2025-08-14 | 13F | CoreCap Advisors, LLC | 9,111 | -9.70 | 206 | -9.69 | ||||
| 2025-04-28 | 13F | Horizon Financial Services, Llc | 0 | 0 | ||||||
| 2025-08-18 | 13F/A | National Bank Of Canada /fi/ | 2,571 | 0.00 | 58 | 0.00 | ||||
| 2025-08-08 | 13F | Cetera Investment Advisers | 128,289 | 18.69 | 2,895 | 18.70 | ||||
| 2025-08-12 | 13F | LPL Financial LLC | 3,441,026 | 6.08 | 77,664 | 6.08 | ||||
| 2025-07-18 | 13F | Lockerman Financial Group, Inc. | 23,267 | 14.14 | 525 | 14.13 | ||||
| 2025-07-10 | 13F | HF Advisory Group, LLC | 10,534 | 2.57 | 238 | 2.60 | ||||
| 2025-08-06 | 13F | AE Wealth Management LLC | 42,512 | 31.73 | 959 | 31.73 | ||||
| 2025-07-10 | 13F | Signal Advisors Wealth, LLC | 95,176 | 2,148 | ||||||
| 2025-07-10 | 13F | Wealth Enhancement Advisory Services, Llc | 27,629 | -5.01 | 620 | -5.49 | ||||
| 2025-08-08 | 13F | Gts Securities Llc | 0 | -100.00 | 0 | |||||
| 2025-08-13 | 13F | Ally Invest Advisors Inc. | 33,496 | 6.22 | 756 | 6.19 | ||||
| 2025-08-14 | 13F | Mariner, LLC | 0 | -100.00 | 0 | |||||
| 2025-08-07 | 13F | PFG Advisors | 348,930 | 8.43 | 7,875 | 8.43 | ||||
| 2025-08-11 | 13F | Advisor Resource Council | 0 | -100.00 | 0 | |||||
| 2025-08-14 | 13F | Gotham Asset Management, LLC | 347,329 | -0.27 | 7,839 | -0.27 | ||||
| 2025-08-12 | 13F | Spectrum Wealth Advisory Group, LLC | 250,218 | 5,647 | ||||||
| 2025-08-04 | 13F | Atria Investments Llc | 14,556 | -5.76 | 329 | -5.75 | ||||
| 2025-07-31 | 13F | Buckingham Strategic Partners | 9,282 | 209 | ||||||
| 2025-08-04 | 13F | Assetmark, Inc | 803,797 | 19.86 | 18,142 | 19.85 | ||||
| 2025-07-08 | 13F | Strategic Advocates LLC | 845,820 | 1.97 | 19,090 | 1.97 | ||||
| 2025-08-14 | 13F/A | Rockefeller Capital Management L.P. | 45,304 | 13.03 | 1,023 | 13.05 | ||||
| 2025-07-31 | 13F | Glass Jacobson Investment Advisors llc | 0 | -100.00 | 0 | |||||
| 2025-08-18 | 13F | N.E.W. Advisory Services LLC | 87 | 1.16 | 2 | 0.00 | ||||
| 2025-08-15 | 13F | Kestra Advisory Services, LLC | 14,089 | 318 | ||||||
| 2025-07-28 | 13F | RMR Capital Management, LLC | 23,971 | 0.00 | 541 | 0.00 | ||||
| 2025-08-14 | 13F | Sunbelt Securities, Inc. | 1,059 | 0.00 | 24 | 0.00 | ||||
| 2025-05-16 | 13F | Coppell Advisory Solutions LLC | 0 | -100.00 | 0 | -100.00 | ||||
| 2025-08-12 | 13F | O'shaughnessy Asset Management, Llc | 38 | -54.76 | 1 | -100.00 | ||||
| 2025-08-14 | 13F | Bank Of America Corp /de/ | 368,767 | -19.17 | 8,323 | -19.17 | ||||
| 2025-07-14 | 13F | Park Avenue Securities Llc | 149,248 | 0.77 | 3 | 0.00 | ||||
| 2025-08-14 | 13F | State Street Corp | 7,315,006 | 6.20 | 165,100 | 6.20 | ||||
| 2025-08-13 | 13F | Quadrature Capital Ltd | 0 | -100.00 | 0 | |||||
| 2025-08-14 | 13F | Royal Bank Of Canada | 379,880 | 9.25 | 8,574 | 9.25 | ||||
| 2025-07-29 | 13F | Koshinski Asset Management, Inc. | 48,111 | -10.31 | 1,086 | -10.33 | ||||
| 2025-07-17 | 13F | Fifth Third Securities, Inc. | 103,699 | 8.22 | 2,340 | 8.23 | ||||
| 2025-08-14 | 13F | KKM Financial LLC | 37,273 | 2.35 | 842 | 6.05 | ||||
| 2025-04-22 | 13F | Nilsine Partners, LLC | 0 | -100.00 | 0 | |||||
| 2025-08-14 | 13F | Hilltop Holdings Inc. | 10,307 | 233 | ||||||
| 2025-08-14 | 13F | Raymond James Financial Inc | 328,441 | -6.64 | 7,413 | -6.65 | ||||
| 2025-08-14 | 13F | State Of Wisconsin Investment Board | 42,920 | 0.00 | 969 | 0.00 | ||||
| 2025-07-22 | 13F | Aspire Private Capital, LLC | 178,086 | 6.84 | 4,019 | 6.86 | ||||
| 2025-08-13 | 13F | Transce3nd, LLC | 1,214 | 68.61 | 27 | 68.75 | ||||
| 2025-08-12 | 13F | Change Path, LLC | 55,498 | 36.97 | 1,253 | 36.98 | ||||
| 2025-07-25 | 13F | Cwm, Llc | 10,373 | -7.70 | 0 | |||||
| 2025-05-02 | 13F | Transcendent Capital Group LLC | 0 | -100.00 | 0 | |||||
| 2025-08-14 | 13F | Harvest Investment Services, LLC | 10,085 | 8.98 | 228 | 9.13 | ||||
| 2025-05-02 | 13F | Capital A Wealth Management, LLC | 19 | 0 | ||||||
| 2025-08-12 | 13F | Archer Investment Corp | 2,843 | -24.63 | 64 | -24.71 | ||||
| 2025-04-09 | 13F | Milestone Asset Management, Llc | 0 | -100.00 | 0 | |||||
| 2025-07-29 | 13F | Private Trust Co Na | 8,092 | -60.91 | 183 | -61.03 | ||||
| 2025-08-14 | 13F | Mml Investors Services, Llc | 56,239 | -22.25 | 1 | 0.00 | ||||
| 2025-07-31 | 13F | Cambridge Investment Research Advisors, Inc. | 58,714 | 9.17 | 1 | 0.00 | ||||
| 2025-08-05 | 13F | Fourth Dimension Wealth, LLC | 56,170 | 13.27 | 1,268 | 13.23 | ||||
| 2025-08-12 | 13F | Global Retirement Partners, LLC | 1,933 | 28.52 | 44 | 30.30 |
Other Listings
| MX:SPLB |