Mga Batayang Estadistika
| Pemilik Institusional | 134 total, 134 long only, 0 short only, 0 long/short - change of 6.35% MRQ |
| Alokasi Portofolio Rata-rata | 0.5912 % - change of 32.69% MRQ |
| Saham Institusional (Jangka Panjang) | 19,276,564 (ex 13D/G) - change of 3.08MM shares 19.01% MRQ |
| Nilai Institusional (Jangka Panjang) | $ 709,461 USD ($1000) |
Kepemilikan Institusional dan Pemegang Saham
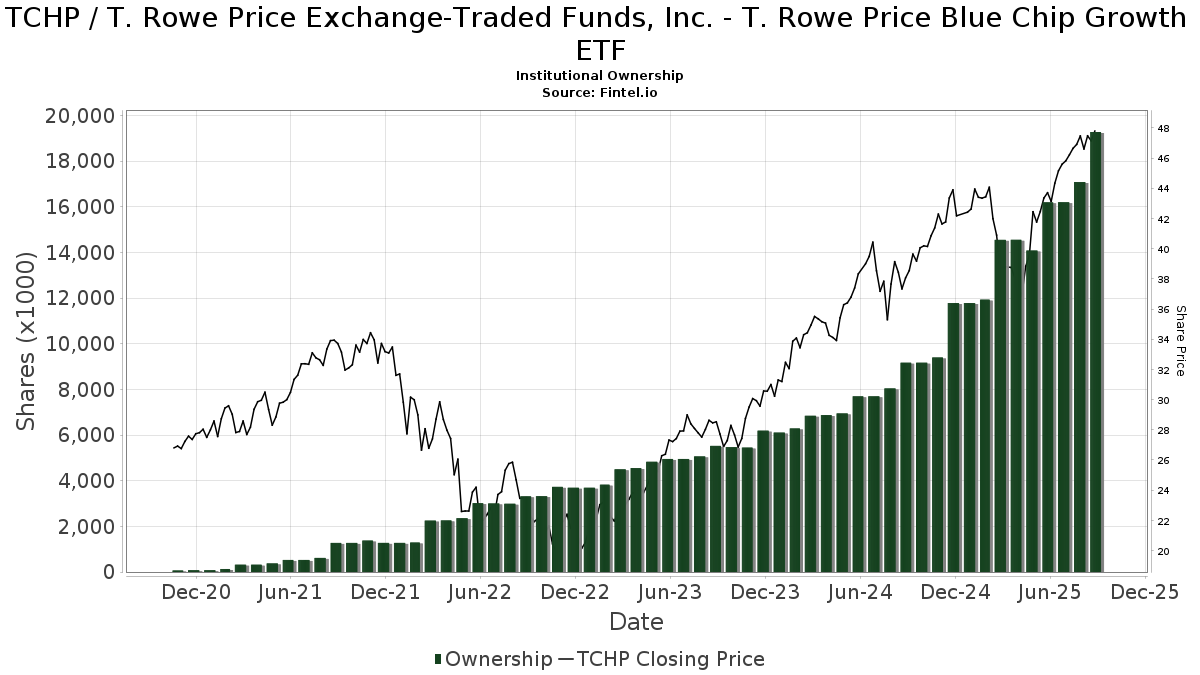
T. Rowe Price Exchange-Traded Funds, Inc. - T. Rowe Price Blue Chip Growth ETF (US:TCHP) memiliki 134 pemilik institusional dan pemegang saham yang telah mengajukan formulir 13D/G atau 13F kepada Komisi Bursa Efek (Securities Exchange Commission/SEC). Lembaga-lembaga ini memegang total 19,276,564 saham. Pemegang saham terbesar meliputi Cetera Investment Advisers, Northwestern Mutual Wealth Management Co, Glenview Trust Co, Bank Of America Corp /de/, PRSGX - Spectrum Growth Fund, Price T Rowe Associates Inc /md/, Trust Co of Kansas, Envestnet Asset Management Inc, Commonwealth Equity Services, Llc, and Jones Financial Companies Lllp .
Struktur kepemilikan institusional T. Rowe Price Exchange-Traded Funds, Inc. - T. Rowe Price Blue Chip Growth ETF (ARCA:TCHP) menunjukkan posisi terkini di perusahaan oleh institusi dan dana, serta perubahan terbaru dalam ukuran posisi. Pemegang saham utama dapat mencakup investor individu, reksa dana, dana lindung nilai, atau institusi. Jadwal 13D menunjukkan bahwa investor memegang (atau pernah memegang) lebih dari 5% saham perusahaan dan bermaksud (atau pernah bermaksud) untuk secara aktif mengejar perubahan strategi bisnis. Jadwal 13G menunjukkan investasi pasif lebih dari 5%.
The share price as of September 5, 2025 is 47.40 / share. Previously, on September 9, 2024, the share price was 37.00 / share. This represents an increase of 28.10% over that period.
Skor Sentimen Dana
Skor Sentimen Dana (sebelumnya dikenal sebagai Skor Akumulasi Kepemilikan) menemukan saham-saham yang paling banyak dibeli oleh dana. Ini adalah hasil dari model kuantitatif multi-faktor yang canggih yang mengidentifikasi perusahaan dengan tingkat akumulasi institusional tertinggi. Model penilaian menggunakan kombinasi dari total peningkatan pemilik yang diungkapkan, perubahan dalam alokasi portofolio pada pemilik tersebut, dan metrik lainnya. Angka berkisar dari 0 hingga 100, dengan angka yang lebih tinggi menunjukkan tingkat akumulasi yang lebih tinggi dibandingkan dengan perusahaan sejenisnya, dan 50 adalah rata-ratanya.
Frekuensi Pembaruan: Setiap Hari
Lihat Ownership Explorer, yang menyediakan daftar perusahaan dengan peringkat tertinggi.
Rasio Put/Call Institusional
Selain melaporkan isu ekuitas dan utang standar, institusi dengan aset di bawah manajemen lebih dari 100 juta dolar AS juga harus mengungkapkan kepemilikan opsi put dan call mereka. Karena opsi put umumnya menunjukkan sentimen negatif, dan opsi call menunjukkan sentimen positif, kita dapat mengetahui sentimen institusional secara keseluruhan dengan memplot rasio put terhadap call. Grafik di sebelah kanan memplot rasio put/call historis untuk instrumen ini.
Menggunakan Rasio Put/Call sebagai indikator sentimen investor mengatasi salah satu kekurangan utama dari penggunaan total kepemilikan institusional, yaitu sejumlah besar aset yang dikelola diinvestasikan secara pasif untuk melacak indeks. Dana yang dikelola secara pasif biasanya tidak membeli opsi, sehingga indikator rasio put/call lebih akurat dalam melacak sentimen dana yang dikelola secara aktif.
Pengajuan 13F dan NPORT
Detail pada pengajuan 13F tersedia gratis. Detail pada pengajuan NP memerlukan keanggotaan premium. Baris berwarna hijau menunjukkan posisi baru. Baris berwarna merah menunjukkan posisi yang sudah ditutup. Klik tautan ini ikon untuk melihat riwayat transaksi selengkapnya.
Tingkatkan
untuk membuka data premium dan mengekspor ke Excel ![]() .
.
| Tanggal File | Sumber | Investor | Ketik | Presyo ng Avg (Silangan) |
Saham | Δ Saham (%) |
Dilaporkan Nilai ($1000) |
Nilai Δ (%) |
Alokasi Port (%) |
|
|---|---|---|---|---|---|---|---|---|---|---|
| 2025-08-13 | 13F | Jones Financial Companies Lllp | 689,919 | 38.09 | 31,074 | 63.33 | ||||
| 2025-08-11 | 13F | Landaas & Co /wi /adv | 17,617 | 60.64 | 799 | 91.15 | ||||
| 2025-07-28 | 13F | Mitchell Mcleod Pugh & Williams Inc | 20,362 | 3.00 | 923 | 22.58 | ||||
| 2025-07-29 | 13F | Stratos Wealth Advisors, LLC | 17,994 | -27.28 | 816 | -13.38 | ||||
| 2025-08-14 | 13F | Destination Wealth Management | 0 | -100.00 | 0 | |||||
| 2025-08-14 | 13F | Wells Fargo & Company/mn | 1,849 | 84 | ||||||
| 2025-05-09 | 13F | GeoWealth Management, LLC | 0 | -100.00 | 0 | -100.00 | ||||
| 2025-08-08 | 13F | Cetera Investment Advisers | 3,282,913 | 108.91 | 148,880 | 148.73 | ||||
| 2025-08-14 | 13F | Fmr Llc | 1,100 | 50 | ||||||
| 2025-08-13 | 13F | Legacy Capital Wealth Partners, LLC | 25,661 | 9.60 | 1,164 | 30.53 | ||||
| 2025-08-14 | 13F | Glenview Trust Co | 1,759,213 | 4.68 | 79,780 | 24.64 | ||||
| 2025-08-14 | 13F | GWM Advisors LLC | 34,013 | -32.44 | 1,542 | -19.56 | ||||
| 2025-07-08 | 13F | Goldstone Financial Group, LLC | 13,736 | -0.95 | 627 | 18.56 | ||||
| 2025-07-29 | 13F | Elevation Capital Advisory, LLC | 288,685 | 254.21 | 13,092 | 321.75 | ||||
| 2025-07-17 | 13F | Janney Montgomery Scott LLC | 286,763 | 18.24 | 13 | 44.44 | ||||
| 2025-05-12 | 13F | Jpmorgan Chase & Co | 0 | -100.00 | 0 | |||||
| 2025-08-07 | 13F | Traynor Capital Management, Inc. | 0 | -100.00 | 0 | |||||
| 2025-08-14 | 13F | Raymond James Financial Inc | 353,837 | -1.54 | 16,047 | 17.23 | ||||
| 2025-08-11 | 13F | Private Advisor Group, LLC | 11,209 | -11.91 | 508 | 4.96 | ||||
| 2025-08-12 | 13F | MAI Capital Management | 13,986 | 41.20 | 634 | 68.17 | ||||
| 2025-05-15 | 13F | National Wealth Management Group, LLC | 226,539 | 5.77 | 8,629 | -4.34 | ||||
| 2025-04-25 | 13F | BankPlus Wealth Management LLC | 0 | -100.00 | 0 | |||||
| 2025-07-15 | 13F | Verum Partners LLC | 7,399 | 0.00 | 336 | 19.22 | ||||
| 2025-08-26 | NP | PRSGX - Spectrum Growth Fund This fund is a listed as child fund of Price T Rowe Associates Inc /md/ and if that institution has disclosed ownership in this security, then these positions will not be double counted when calculating total shares and total value | 1,250,001 | 0.00 | 56,688 | 19.06 | ||||
| 2025-07-23 | 13F | Citizens National Bank Trust Department | 12,536 | -5.46 | 569 | 12.48 | ||||
| 2025-08-06 | 13F | Souders Financial Advisors | 302,768 | 6.14 | 13,731 | 26.37 | ||||
| 2025-08-08 | 13F | Maple Capital Management, Inc. | 40,895 | 3.37 | 1,855 | 23.11 | ||||
| 2025-08-12 | 13F | Heritage Trust Co | 49,454 | 33.74 | 2,243 | 59.23 | ||||
| 2025-07-25 | 13F | Cwm, Llc | 93,359 | 25.12 | 4 | 100.00 | ||||
| 2025-08-11 | 13F | John & Kathleen Schreiber Foundation | 111,349 | 0.00 | 5,050 | 19.05 | ||||
| 2025-08-12 | 13F | Bedel Financial Consulting, Inc. | 31,295 | 3.43 | 1,419 | 18.74 | ||||
| 2025-07-02 | 13F | Central Pacific Bank - Trust Division | 168 | 0.00 | 8 | 16.67 | ||||
| 2025-07-10 | 13F | Wealth Enhancement Advisory Services, Llc | 61,952 | 1.47 | 2,826 | 21.55 | ||||
| 2025-07-21 | 13F | DHJJ Financial Advisors, Ltd. | 85 | 0.00 | 4 | 0.00 | ||||
| 2025-07-25 | 13F | Cascade Investment Advisors, Inc. | 6,193 | 7.33 | 281 | 27.85 | ||||
| 2025-08-04 | 13F | NBZ Investment Advisors LLC | 60,764 | 6.94 | 2,756 | 27.31 | ||||
| 2025-08-07 | 13F | Kestra Private Wealth Services, Llc | 7,476 | 1.41 | 339 | 21.07 | ||||
| 2025-07-23 | 13F | Armstrong, Fleming & Moore, Inc | 437,876 | 19,858 | ||||||
| 2025-08-08 | 13F | Capital Investment Advisory Services, LLC | 1,288 | 77.66 | 58 | 114.81 | ||||
| 2025-07-29 | 13F | Fundamentun, Llc | 0 | -100.00 | 0 | |||||
| 2025-08-07 | 13F/A | Ellerson Group Inc /adv | 22,632 | 2.49 | 1,026 | 22.00 | ||||
| 2025-07-31 | 13F | Glass Jacobson Investment Advisors llc | 1,222 | 0.00 | 55 | 7.84 | ||||
| 2025-08-01 | 13F | Equita Financial Network, Inc. | 6,093 | -10.67 | 276 | 6.56 | ||||
| 2025-07-30 | 13F | Atlantic Edge Private Wealth Management, LLC | 652 | 0.00 | 30 | 20.83 | ||||
| 2025-08-19 | 13F | Cape Investment Advisory, Inc. | 248 | 0.00 | 11 | 22.22 | ||||
| 2025-07-11 | 13F | Pinnacle Bancorp, Inc. | 56 | 0.00 | 3 | 0.00 | ||||
| 2025-08-05 | 13F | Sigma Planning Corp | 18,167 | -69.04 | 824 | -63.16 | ||||
| 2025-07-24 | 13F | Capital Advisors, Ltd. LLC | 73,072 | -0.25 | 3 | 50.00 | ||||
| 2025-08-13 | 13F | Marshall Wace, Llp | 19,701 | 893 | ||||||
| 2025-08-18 | 13F | Hershey Financial Advisers, LLC | 9,414 | -24.49 | 427 | -18.86 | ||||
| 2025-07-24 | 13F | Bey-Douglas LLC | 6,849 | 15.85 | 311 | 37.78 | ||||
| 2025-07-25 | 13F | Apollon Wealth Management, LLC | 4,828 | 219 | ||||||
| 2025-07-16 | 13F | Swisher Financial Concepts, Inc. | 18,133 | -6.95 | 822 | 10.78 | ||||
| 2025-08-14 | 13F | Great Valley Advisor Group, Inc. | 6,356 | -19.65 | 288 | -4.32 | ||||
| 2025-08-14 | 13F | Advisor OS, LLC | 181,924 | -19.57 | 8,250 | -4.24 | ||||
| 2025-07-14 | 13F | Lighthouse Wealth Management Inc. | 28,213 | 3.58 | 1,279 | 23.34 | ||||
| 2025-07-11 | 13F | SILVER OAK SECURITIES, Inc | 35,551 | 259.36 | 1,612 | 328.72 | ||||
| 2025-08-12 | 13F | LPL Financial LLC | 40,556 | 21.00 | 1,839 | 44.12 | ||||
| 2025-08-08 | 13F | Comprehensive Financial Planning, Inc./PA | 43,421 | 1.46 | 1,969 | 20.80 | ||||
| 2025-04-30 | 13F | POM Investment Strategies, LLC | 0 | -100.00 | 0 | |||||
| 2025-08-14 | 13F | Cascades Capital Asset Management, LLC | 5,573 | -18.58 | 253 | -3.08 | ||||
| 2025-05-15 | 13F | Gotham Asset Management, LLC | 0 | -100.00 | 0 | -100.00 | ||||
| 2025-08-13 | 13F | Ted Buchan & Co | 30,439 | -2.94 | 1,380 | 15.58 | ||||
| 2025-07-30 | 13F | Cornerstone Advisory, LLC | 5,264 | 239 | ||||||
| 2025-08-06 | 13F | Prospera Financial Services Inc | 7,152 | -89.55 | 324 | -87.56 | ||||
| 2025-09-04 | 13F/A | Advisor Group Holdings, Inc. | 23,418 | -51.70 | 1,062 | -42.52 | ||||
| 2025-07-14 | 13F | Harbor Group, Inc. | 442,912 | 10.17 | 20,086 | 31.17 | ||||
| 2025-08-13 | 13F | Capital Analysts, Inc. | 55,996 | 2.04 | 3 | 0.00 | ||||
| 2025-08-14 | 13F | Royal Bank Of Canada | 56,211 | -13.89 | 2,549 | 2.49 | ||||
| 2025-07-28 | 13F | Harbour Investments, Inc. | 35,177 | 1.36 | 1,595 | 20.74 | ||||
| 2025-08-14 | 13F | First Foundation Advisors | 86,476 | -0.19 | 3,922 | 18.82 | ||||
| 2025-08-18 | 13F/A | National Bank Of Canada /fi/ | 2,155 | 13.12 | 97 | 35.21 | ||||
| 2025-04-25 | 13F | MidAtlantic Capital Management, Inc. | 0 | -100.00 | 0 | |||||
| 2025-08-18 | 13F | Geneos Wealth Management Inc. | 898 | 29.39 | 41 | 53.85 | ||||
| 2025-08-04 | 13F | REDW Wealth LLC | 10,084 | 7.31 | 457 | 28.01 | ||||
| 2025-05-06 | 13F | PFG Advisors | 0 | -100.00 | 0 | -100.00 | ||||
| 2025-08-06 | 13F | Mark Sheptoff Financial Planning, Llc | 200 | 0.00 | 9 | 28.57 | ||||
| 2025-08-14 | 13F | Comerica Bank | 1,000 | 0.00 | 45 | 18.42 | ||||
| 2025-07-09 | 13F | Sapient Capital Llc | 5,723 | 0.00 | 260 | 19.35 | ||||
| 2025-07-21 | 13F | Keystone Financial Group, Inc. | 0 | -100.00 | 0 | |||||
| 2025-08-13 | 13F | Per Stirling Capital Management, LLC. | 8,133 | 0.00 | 369 | 19.09 | ||||
| 2025-08-14 | 13F | Goldman Sachs Group Inc | 7,929 | 360 | ||||||
| 2025-07-24 | 13F | IFP Advisors, Inc | 25,120 | 0.00 | 1,139 | 19.14 | ||||
| 2025-07-25 | 13F | Concord Wealth Partners | 65 | 3 | ||||||
| 2025-07-24 | 13F | Forefront Analytics, LLC | 76,981 | 3,490 | ||||||
| 2025-08-13 | 13F | Dana Investment Advisors, Inc. | 9,916 | 0.00 | 450 | 19.10 | ||||
| 2025-08-11 | 13F | TD Waterhouse Canada Inc. | 4,561 | 192.18 | 202 | 242.37 | ||||
| 2025-08-12 | 13F | Calton & Associates, Inc. | 5,198 | 236 | ||||||
| 2025-08-15 | 13F | Morgan Stanley | 602 | -46.35 | 27 | -35.71 | ||||
| 2025-08-08 | 13F | Sittner & Nelson, Llc | 23,049 | 21.84 | 1,045 | 45.14 | ||||
| 2025-08-11 | 13F | Principal Securities, Inc. | 9,598 | -64.21 | 435 | -61.47 | ||||
| 2025-08-13 | 13F | Northwestern Mutual Wealth Management Co | 1,959,197 | 28.54 | 88,850 | 53.04 | ||||
| 2025-07-23 | 13F | Roundview Capital LLC | 28,740 | 78.11 | 1,303 | 112.21 | ||||
| 2025-08-13 | 13F | M Holdings Securities, Inc. | 10,249 | 0 | ||||||
| 2025-08-08 | 13F | Avantax Advisory Services, Inc. | 4,775 | 217 | ||||||
| 2025-08-12 | 13F | CIBC Private Wealth Group, LLC | 200 | 0.00 | 9 | 50.00 | ||||
| 2025-08-14 | 13F | Empire Life Investments Inc. | 68,100 | 3,092 | ||||||
| 2025-08-14 | 13F | Two Sigma Investments, Lp | 233,900 | 73.00 | 10,607 | 106.00 | ||||
| 2025-08-14 | 13F | Diversify Wealth Management, Llc | 8,985 | 0.00 | 427 | 22.70 | ||||
| 2025-07-24 | 13F | Robertson Stephens Wealth Management, LLC | 13,232 | -86.26 | 600 | -83.64 | ||||
| 2025-08-04 | 13F | Saxony Capital Management, LLC | 5,100 | -12.07 | 231 | 5.00 | ||||
| 2025-07-21 | 13F | Ameritas Advisory Services, LLC | 23,733 | 301.91 | 1,076 | 337.40 | ||||
| 2025-08-14 | 13F | Bank Of America Corp /de/ | 1,585,204 | -5.72 | 71,889 | 12.25 | ||||
| 2025-08-01 | 13F | Envestnet Asset Management Inc | 793,857 | -1.13 | 36,001 | 17.72 | ||||
| 2025-08-13 | 13F/A | Matrix Asset Advisors Inc/ny | 64,641 | 4.05 | 2,931 | 23.88 | ||||
| 2025-07-16 | 13F | Signaturefd, Llc | 1,775 | 0.00 | 80 | 19.40 | ||||
| 2025-08-14 | 13F | Mml Investors Services, Llc | 52,264 | 46.41 | 2 | 100.00 | ||||
| 2025-08-12 | 13F | DiMeo Schneider & Associates, L.L.C. | 19,200 | 871 | ||||||
| 2025-08-13 | 13F | Maia Wealth LLC | 42,251 | 40.40 | 1,916 | 70.31 | ||||
| 2025-08-11 | 13F | Tidemark, LLC | 173 | 0.00 | 8 | 16.67 | ||||
| 2025-08-14 | 13F | Stifel Financial Corp | 95,569 | 2.79 | 4,334 | 22.39 | ||||
| 2025-07-22 | 13F | DAVENPORT & Co LLC | 15,997 | 6.90 | 725 | 27.19 | ||||
| 2025-08-06 | 13F | Commonwealth Equity Services, Llc | 737,938 | 12.00 | 33 | 32.00 | ||||
| 2025-08-14 | 13F | Susquehanna International Group, Llp | 35,518 | -42.45 | 1,611 | -31.49 | ||||
| 2025-08-29 | 13F | Centaurus Financial, Inc. | 0 | -100.00 | 0 | |||||
| 2025-07-16 | 13F | Essex Financial Services, Inc. | 36,809 | 38.93 | 1,669 | 65.41 | ||||
| 2025-07-17 | 13F | Mokosak Advisory Group, LLC | 5,384 | 0.00 | 244 | 19.02 | ||||
| 2025-07-07 | 13F | Trust Co | 1,465 | 0.00 | 66 | 20.00 | ||||
| 2025-08-14 | 13F | Wiley Bros.-aintree Capital, Llc | 18,761 | 851 | ||||||
| 2025-08-08 | 13F | Creative Planning | 73,347 | -53.27 | 3,326 | -44.36 | ||||
| 2025-07-11 | 13F | CMH Wealth Management LLC | 157,427 | -5.81 | 7,139 | 12.14 | ||||
| 2025-07-14 | 13F | Toth Financial Advisory Corp | 14 | 0.00 | 1 | |||||
| 2025-08-05 | 13F | Carolinas Wealth Consulting Llc | 0 | -100.00 | 0 | |||||
| 2025-08-07 | 13F | Allworth Financial LP | 393 | 0.00 | 18 | 13.33 | ||||
| 2025-08-12 | 13F | SRS Capital Advisors, Inc. | 605 | 65.30 | 27 | 107.69 | ||||
| 2025-07-22 | 13F | Wealthcare Advisory Partners LLC | 6,205 | 2.14 | 281 | 21.65 | ||||
| 2025-08-04 | 13F | WNY Asset Management, LLC | 14,683 | -47.86 | 666 | -37.97 | ||||
| 2025-08-08 | 13F | Croban | 76,981 | -3.88 | 3,490 | 14.43 | ||||
| 2025-07-16 | 13F | Stephenson National Bank & Trust | 4,062 | 4.07 | 184 | 24.32 | ||||
| 2025-08-14 | 13F | Benjamin Edwards Inc | 119,614 | 18.72 | 5,424 | 41.36 | ||||
| 2025-08-04 | 13F | Linscomb & Williams, Inc. | 249,386 | 0.32 | 11,310 | 19.44 | ||||
| 2025-08-13 | 13F | Certior Financial Group, Llc | 5,879 | 10.22 | 267 | 31.03 | ||||
| 2025-08-11 | 13F | Aptus Capital Advisors, LLC | 347 | 0.00 | 16 | 15.38 | ||||
| 2025-07-30 | 13F | D.a. Davidson & Co. | 212,216 | -0.74 | 9,624 | 18.18 | ||||
| 2025-08-12 | 13F | Proequities, Inc. | 0 | 0 | ||||||
| 2025-08-12 | 13F | J.w. Cole Advisors, Inc. | 6,333 | 0.00 | 287 | 19.09 | ||||
| 2025-08-12 | 13F | Global Retirement Partners, LLC | 345 | 0.00 | 16 | 7.14 | ||||
| 2025-05-15 | 13F | Citadel Advisors Llc | 0 | -100.00 | 0 | |||||
| 2025-08-11 | 13F | HighTower Advisors, LLC | 10,637 | -0.34 | 482 | 18.72 | ||||
| 2025-08-14 | 13F | Price T Rowe Associates Inc /md/ | 1,250,001 | 0.00 | 57 | 19.15 | ||||
| 2025-08-13 | 13F | Russell Investments Group, Ltd. | 272 | -84.47 | 12 | -81.82 | ||||
| 2025-07-16 | 13F | Spirepoint Private Client, Llc | 0 | -100.00 | 0 | |||||
| 2025-07-18 | 13F | Truist Financial Corp | 80,580 | -0.55 | 3,654 | 18.41 | ||||
| 2025-08-15 | 13F | Kestra Advisory Services, LLC | 42,760 | 23.12 | 1,939 | 46.67 | ||||
| 2025-08-08 | 13F | Mjp Associates Inc /adv | 184,102 | -18.61 | 8,349 | -3.09 | ||||
| 2025-08-07 | 13F | Summit Asset Management, LLC | 56,047 | -3.61 | 2,542 | 14.77 | ||||
| 2025-07-09 | 13F | Massmutual Trust Co Fsb/adv | 65 | 0.00 | 3 | 0.00 | ||||
| 2025-08-11 | 13F | Hopwood Financial Services, Inc. | 99,249 | 4.50 | 4,501 | 24.41 | ||||
| 2025-07-31 | 13F | Cambridge Investment Research Advisors, Inc. | 99,201 | 2.97 | 4 | 33.33 | ||||
| 2025-07-21 | 13F | Trust Co of Kansas | 935,625 | 12.25 | 42 | 35.48 |