Mga Batayang Estadistika
| Pemilik Institusional | 98 total, 97 long only, 0 short only, 1 long/short - change of -2.00% MRQ |
| Alokasi Portofolio Rata-rata | 0.1309 % - change of -15.43% MRQ |
| Saham Institusional (Jangka Panjang) | 4,338,248 (ex 13D/G) - change of -0.88MM shares -16.92% MRQ |
| Nilai Institusional (Jangka Panjang) | $ 153,918 USD ($1000) |
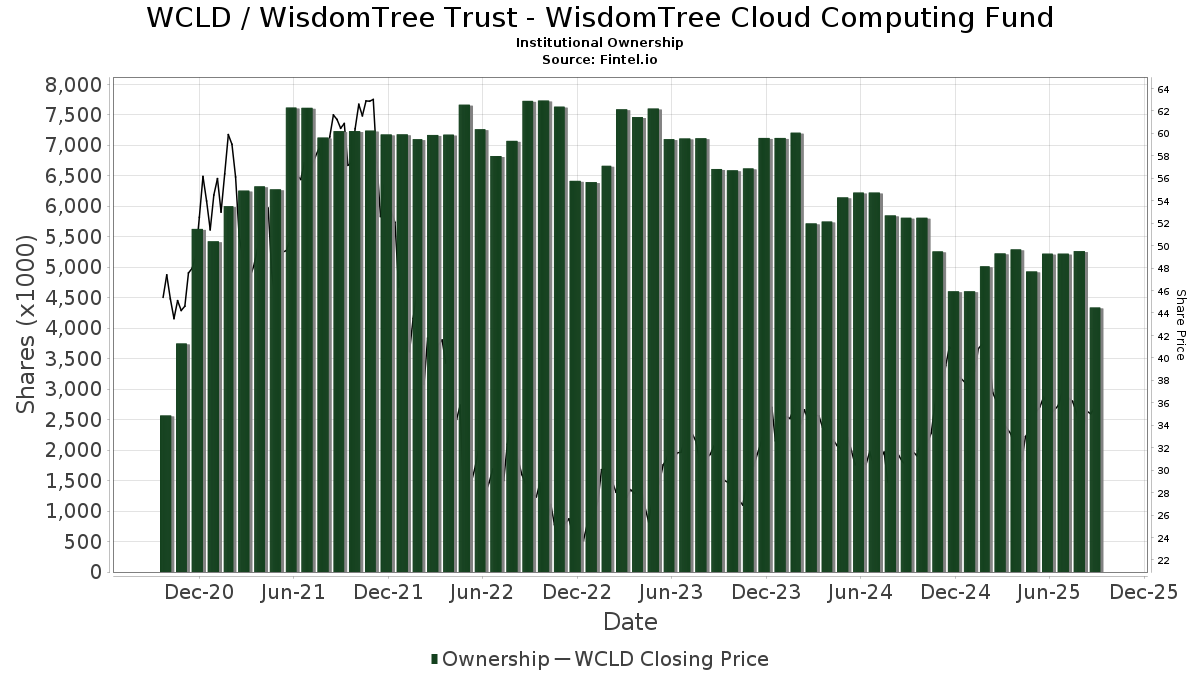
Kepemilikan Institusional dan Pemegang Saham
WisdomTree Trust - WisdomTree Cloud Computing Fund (US:WCLD) memiliki 98 pemilik institusional dan pemegang saham yang telah mengajukan formulir 13D/G atau 13F kepada Komisi Bursa Efek (Securities Exchange Commission/SEC). Lembaga-lembaga ini memegang total 4,338,248 saham. Pemegang saham terbesar meliputi RMB Capital Management, LLC, Endurance Services Ltd, Selective Wealth Management, Inc., Morgan Stanley, Jpmorgan Chase & Co, Clearwater Capital Advisors, LLC, Ieq Capital, Llc, Summit Trail Advisors, Llc, Raymond James Financial Inc, and Yarbrough Capital, LLC .
Struktur kepemilikan institusional WisdomTree Trust - WisdomTree Cloud Computing Fund (NasdaqGM:WCLD) menunjukkan posisi terkini di perusahaan oleh institusi dan dana, serta perubahan terbaru dalam ukuran posisi. Pemegang saham utama dapat mencakup investor individu, reksa dana, dana lindung nilai, atau institusi. Jadwal 13D menunjukkan bahwa investor memegang (atau pernah memegang) lebih dari 5% saham perusahaan dan bermaksud (atau pernah bermaksud) untuk secara aktif mengejar perubahan strategi bisnis. Jadwal 13G menunjukkan investasi pasif lebih dari 5%.
The share price as of September 5, 2025 is 35.77 / share. Previously, on September 6, 2024, the share price was 30.09 / share. This represents an increase of 18.88% over that period.
Skor Sentimen Dana
Skor Sentimen Dana (sebelumnya dikenal sebagai Skor Akumulasi Kepemilikan) menemukan saham-saham yang paling banyak dibeli oleh dana. Ini adalah hasil dari model kuantitatif multi-faktor yang canggih yang mengidentifikasi perusahaan dengan tingkat akumulasi institusional tertinggi. Model penilaian menggunakan kombinasi dari total peningkatan pemilik yang diungkapkan, perubahan dalam alokasi portofolio pada pemilik tersebut, dan metrik lainnya. Angka berkisar dari 0 hingga 100, dengan angka yang lebih tinggi menunjukkan tingkat akumulasi yang lebih tinggi dibandingkan dengan perusahaan sejenisnya, dan 50 adalah rata-ratanya.
Frekuensi Pembaruan: Setiap Hari
Lihat Ownership Explorer, yang menyediakan daftar perusahaan dengan peringkat tertinggi.
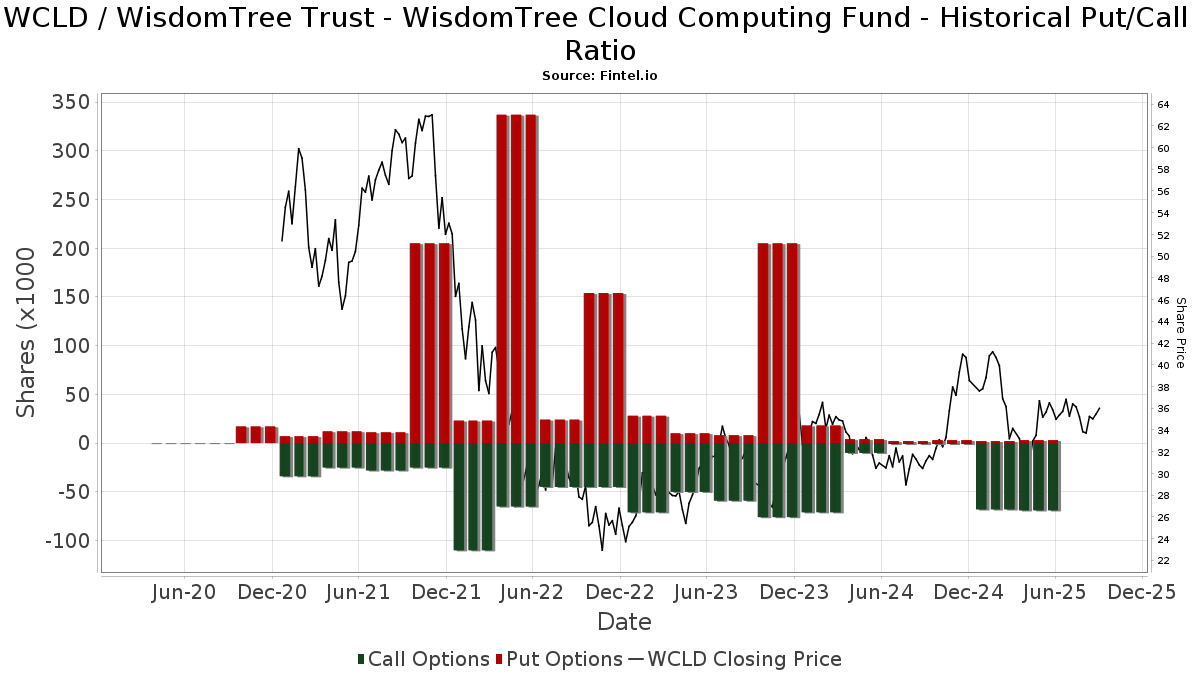
Rasio Put/Call Institusional
Selain melaporkan isu ekuitas dan utang standar, institusi dengan aset di bawah manajemen lebih dari 100 juta dolar AS juga harus mengungkapkan kepemilikan opsi put dan call mereka. Karena opsi put umumnya menunjukkan sentimen negatif, dan opsi call menunjukkan sentimen positif, kita dapat mengetahui sentimen institusional secara keseluruhan dengan memplot rasio put terhadap call. Grafik di sebelah kanan memplot rasio put/call historis untuk instrumen ini.
Menggunakan Rasio Put/Call sebagai indikator sentimen investor mengatasi salah satu kekurangan utama dari penggunaan total kepemilikan institusional, yaitu sejumlah besar aset yang dikelola diinvestasikan secara pasif untuk melacak indeks. Dana yang dikelola secara pasif biasanya tidak membeli opsi, sehingga indikator rasio put/call lebih akurat dalam melacak sentimen dana yang dikelola secara aktif.
Pengajuan 13F dan NPORT
Detail pada pengajuan 13F tersedia gratis. Detail pada pengajuan NP memerlukan keanggotaan premium. Baris berwarna hijau menunjukkan posisi baru. Baris berwarna merah menunjukkan posisi yang sudah ditutup. Klik tautan ini ikon untuk melihat riwayat transaksi selengkapnya.
Tingkatkan
untuk membuka data premium dan mengekspor ke Excel ![]() .
.
| Tanggal File | Sumber | Investor | Ketik | Presyo ng Avg (Silangan) |
Saham | Δ Saham (%) |
Dilaporkan Nilai ($1000) |
Nilai Δ (%) |
Alokasi Port (%) |
|
|---|---|---|---|---|---|---|---|---|---|---|
| 2025-08-14 | 13F | Susquehanna International Group, Llp | Call | 69,800 | 4.80 | 2,523 | 16.71 | |||
| 2025-07-10 | 13F | Cypress Point Wealth Management, LLC | 9,795 | 0.00 | 354 | 11.36 | ||||
| 2025-08-14 | 13F | Susquehanna International Group, Llp | 10,130 | -38.55 | 366 | -31.46 | ||||
| 2025-07-24 | 13F | Costello Asset Management, INC | 213 | 0.00 | 8 | 16.67 | ||||
| 2025-04-09 | 13F | Milestone Asset Management, Llc | 0 | -100.00 | 0 | |||||
| 2025-08-15 | 13F | Tower Research Capital LLC (TRC) | 8,306 | 300 | ||||||
| 2025-07-25 | 13F | Lodestar Private Asset Management Llc | 8,843 | -47.83 | 320 | -41.89 | ||||
| 2025-08-14 | 13F | Banque Transatlantique SA | 0 | -100.00 | 0 | |||||
| 2025-07-11 | 13F | First PREMIER Bank | 664 | -52.02 | 0 | |||||
| 2025-08-12 | 13F | Marshall & Sterling Wealth Advisors Inc. | 44 | 0.00 | 2 | 0.00 | ||||
| 2025-07-22 | 13F | Team Financial Group, LLC | 105 | 4 | ||||||
| 2025-07-28 | 13F | Frazier Financial Advisors, LLC | 168 | 0.00 | 6 | 20.00 | ||||
| 2025-07-28 | 13F | Fairman Group, LLC | 1,560 | 0.00 | 56 | -57.25 | ||||
| 2025-08-14 | 13F | Royal Bank Of Canada | 36,071 | 25.06 | 1,303 | 39.21 | ||||
| 2025-08-14 | 13F | Smartleaf Asset Management LLC | 4,428 | 17.30 | 158 | 26.61 | ||||
| 2025-08-14 | 13F | Ieq Capital, Llc | 199,456 | -3.10 | 7,208 | 7.92 | ||||
| 2025-07-22 | 13F | Grimes & Company, Inc. | 6,824 | 0.00 | 247 | 11.31 | ||||
| 2025-08-04 | 13F | Creative Financial Designs Inc /adv | 5,600 | 85.43 | 202 | 108.25 | ||||
| 2025-08-13 | 13F | Flow Traders U.s. Llc | 24,619 | 1 | ||||||
| 2025-08-05 | 13F | Ceera Investments, Llc | 7,091 | 0.00 | 256 | 11.30 | ||||
| 2025-05-28 | 13F | Intrua Financial, LLC | 0 | -100.00 | 0 | -100.00 | ||||
| 2025-08-06 | 13F | AE Wealth Management LLC | 59 | 0.00 | 2 | 100.00 | ||||
| 2025-08-12 | 13F | O'shaughnessy Asset Management, Llc | 0 | -100.00 | 0 | |||||
| 2025-08-14 | 13F | Two Sigma Securities, Llc | 6,038 | 218 | ||||||
| 2025-07-15 | 13F | Armis Advisers, LLC | 14,492 | -2.16 | 524 | 8.96 | ||||
| 2025-08-29 | 13F | Evolution Wealth Management Inc. | 162 | 6 | ||||||
| 2025-08-05 | 13F | Bank Of Montreal /can/ | 186 | -67.76 | 7 | -66.67 | ||||
| 2025-08-11 | 13F | Y.D. More Investments Ltd | 5,251 | 32.90 | 190 | 47.66 | ||||
| 2025-08-12 | 13F | Stelac Advisory Services LLC | 0 | -100.00 | 0 | |||||
| 2025-08-14 | 13F | Raymond James Financial Inc | Put | 3,500 | 123 | |||||
| 2025-05-09 | 13F | Washington Growth Strategies Llc | 0 | -100.00 | 0 | |||||
| 2025-07-29 | 13F | Ballast, Inc. | 33,955 | 1,227 | ||||||
| 2025-08-14 | 13F | Raymond James Financial Inc | 165,762 | 4.20 | 5,991 | 16.04 | ||||
| 2025-08-05 | 13F | GPS Wealth Strategies Group, LLC | 567 | 0.00 | 20 | 11.11 | ||||
| 2025-08-14 | 13F | Citadel Advisors Llc | Call | 0 | -100.00 | 0 | ||||
| 2025-07-11 | 13F | Farther Finance Advisors, LLC | 280 | 0.00 | 10 | 11.11 | ||||
| 2025-08-12 | 13F | PSI Advisors, LLC | 0 | -100.00 | 0 | |||||
| 2025-08-12 | 13F | SRS Capital Advisors, Inc. | 14,725 | 9.68 | 532 | 22.30 | ||||
| 2025-05-15 | 13F | Hrt Financial Lp | 0 | -100.00 | 0 | |||||
| 2025-07-17 | 13F | Halbert Hargrove Global Advisors, Llc | 5,372 | 0.00 | 194 | 11.49 | ||||
| 2025-08-19 | 13F | Asset Dedication, LLC | 399 | 0.00 | 14 | 16.67 | ||||
| 2025-08-14 | 13F | Federation des caisses Desjardins du Quebec | 5 | 0.00 | 0 | |||||
| 2025-08-12 | 13F | Clearwater Capital Advisors, LLC | 205,870 | 10.73 | 7,440 | 23.34 | ||||
| 2025-08-14 | 13F | Citadel Advisors Llc | 27,920 | 917.49 | 1,009 | 1,033.71 | ||||
| 2025-08-12 | 13F | Franklin Resources Inc | 14,253 | -1.08 | 515 | 10.28 | ||||
| 2025-08-14 | 13F | Stifel Financial Corp | 30,969 | 9.68 | 1,119 | 22.16 | ||||
| 2025-05-15 | 13F | Gts Securities Llc | 0 | -100.00 | 0 | |||||
| 2025-07-07 | 13F | First Community Trust Na | 13,310 | 0.00 | 481 | 11.60 | ||||
| 2025-08-06 | 13F | Commonwealth Equity Services, Llc | 9,773 | -17.12 | 0 | |||||
| 2025-04-16 | 13F | Wealth Enhancement Advisory Services, Llc | 0 | -100.00 | 0 | |||||
| 2025-08-15 | 13F | Morgan Stanley | 249,934 | -58.90 | 9,033 | -54.22 | ||||
| 2025-08-14 | 13F | UBS Group AG | 151,497 | -75.98 | 5,475 | -73.25 | ||||
| 2025-07-02 | 13F | HBW Advisory Services LLC | 0 | -100.00 | 0 | |||||
| 2025-07-15 | 13F | Graypoint LLC | 8,078 | 0.00 | 292 | 11.07 | ||||
| 2025-05-12 | 13F | Meitav Dash Investments Ltd | 0 | -100.00 | 0 | -100.00 | ||||
| 2025-04-17 | 13F | Robertson Stephens Wealth Management, LLC | 0 | -100.00 | 0 | |||||
| 2025-08-08 | 13F | Thrive Capital Management, LLC | 0 | -100.00 | 0 | |||||
| 2025-08-11 | 13F | Private Advisor Group, LLC | 7,458 | -3.24 | 270 | 7.60 | ||||
| 2025-08-12 | 13F | Steward Partners Investment Advisory, Llc | 100 | 0.00 | 4 | 0.00 | ||||
| 2025-08-14 | 13F | Glen Eagle Advisors, LLC | 33 | -85.84 | 1 | -85.71 | ||||
| 2025-08-08 | 13F | Hartland & Co., LLC | 25 | 0.00 | 1 | |||||
| 2025-07-24 | 13F | Blair William & Co/il | 7,195 | -0.69 | 260 | 10.64 | ||||
| 2025-07-14 | 13F | Opal Wealth Advisors, LLC | 5,634 | 44.02 | 204 | 61.11 | ||||
| 2025-08-12 | 13F | Horizon Financial Services, Llc | 283 | 10 | ||||||
| 2025-08-13 | 13F | Continuum Advisory, LLC | 0 | -100.00 | 0 | -100.00 | ||||
| 2025-04-11 | 13F | Insight Advisors, LLC/ PA | 0 | -100.00 | 0 | |||||
| 2025-07-15 | 13F | Financial Management Professionals, Inc. | 1 | 0 | ||||||
| 2025-07-25 | 13F | Cwm, Llc | 15,176 | 3.10 | 1 | |||||
| 2025-08-14 | 13F | Fmr Llc | 3,126 | -24.36 | 113 | -16.42 | ||||
| 2025-07-16 | 13F | Perigon Wealth Management, LLC | 12,160 | -42.02 | 439 | -35.44 | ||||
| 2025-08-12 | 13F | Jpmorgan Chase & Co | 227,808 | -0.16 | 8,233 | 11.20 | ||||
| 2025-08-13 | 13F | Twin Peaks Wealth Advisors, LLC | 8,044 | 2.88 | 265 | 9.54 | ||||
| 2025-08-13 | 13F | Oxler Private Wealth LLC | 9,701 | 0.00 | 351 | 11.46 | ||||
| 2025-08-12 | 13F | Global Retirement Partners, LLC | 350 | 250.00 | 13 | 300.00 | ||||
| 2025-08-11 | 13F | Banque Cantonale Vaudoise | 3,354 | -49.99 | 0 | |||||
| 2025-07-15 | 13F | North Star Investment Management Corp. | 1,625 | 59 | ||||||
| 2025-04-22 | 13F/A | NorthRock Partners, LLC | 0 | -100.00 | 0 | |||||
| 2025-08-14 | 13F | Boston Private Wealth Llc | 0 | -100.00 | 0 | |||||
| 2025-05-15 | 13F | Schonfeld Strategic Advisors LLC | 0 | -100.00 | 0 | |||||
| 2025-08-14 | 13F | RMB Capital Management, LLC | 598,972 | 13.53 | 21,647 | 26.44 | ||||
| 2025-04-28 | 13F | Vontobel Holding Ltd. | 0 | -100.00 | 0 | |||||
| 2025-08-14 | 13F | Bank Of America Corp /de/ | 36,397 | -80.91 | 1,315 | -78.74 | ||||
| 2025-08-14 | 13F | Citadel Advisors Llc | Put | 0 | -100.00 | 0 | ||||
| 2025-08-13 | 13F | PineBridge Investments, L.P. | 26,364 | -14.16 | 953 | -4.42 | ||||
| 2025-08-14 | 13F | Cubist Systematic Strategies, LLC | 14,412 | 521 | ||||||
| 2025-07-31 | 13F | Cambridge Investment Research Advisors, Inc. | 14,717 | -9.20 | 1 | |||||
| 2025-07-31 | 13F | Wealthfront Advisers Llc | 61,892 | 0.75 | 2,237 | 12.19 | ||||
| 2025-08-11 | 13F | HighTower Advisors, LLC | 23,050 | -17.83 | 833 | -8.46 | ||||
| 2025-09-04 | 13F/A | Advisor Group Holdings, Inc. | 9,092 | 17.30 | 329 | 30.68 | ||||
| 2025-04-09 | 13F | Merit Financial Group, LLC | 0 | -100.00 | 0 | -100.00 | ||||
| 2025-08-14 | 13F | Byrne Financial Freedom, Llc | 94,900 | 1.38 | 3,430 | 12.91 | ||||
| 2025-08-14 | 13F | Integrated Wealth Concepts LLC | 0 | -100.00 | 0 | |||||
| 2025-05-16 | 13F | Bell Investment Advisors, Inc | 0 | -100.00 | 0 | |||||
| 2025-08-12 | 13F | MAI Capital Management | 416 | 0.00 | 15 | 15.38 | ||||
| 2025-08-14 | 13F | Qube Research & Technologies Ltd | 17,361 | -62.84 | 627 | -58.64 | ||||
| 2025-08-08 | 13F | Larson Financial Group LLC | 5,915 | -4.83 | 214 | 5.97 | ||||
| 2025-07-22 | 13F | Old National Bancorp /in/ | 129,055 | 4,664 | ||||||
| 2025-07-15 | 13F | Yarbrough Capital, LLC | 165,470 | 0.00 | 5,980 | 11.38 | ||||
| 2025-07-15 | 13F | StoneCrest Wealth Management, Inc. | 0 | -100.00 | 0 | |||||
| 2025-07-28 | 13F | Harbour Investments, Inc. | 2,805 | 0.00 | 101 | 10.99 | ||||
| 2025-04-10 | 13F | Bremer Bank National Association | 129,055 | 0.00 | 4,188 | -13.53 | ||||
| 2025-08-13 | 13F | Northwestern Mutual Wealth Management Co | 2,779 | 0.00 | 100 | 11.11 | ||||
| 2025-07-10 | 13F | Selective Wealth Management, Inc. | 295,066 | -2.87 | 10,861 | 17.07 | ||||
| 2025-08-14 | 13F | Comerica Bank | 30 | 0.00 | 1 | |||||
| 2025-08-08 | 13F | Cetera Investment Advisers | 30,380 | -10.37 | 1,098 | -0.18 | ||||
| 2025-08-14 | 13F | Ameriprise Financial Inc | 0 | -100.00 | 0 | |||||
| 2025-08-13 | 13F | Cerity Partners LLC | 16,194 | -3.76 | 585 | 7.14 | ||||
| 2025-07-07 | 13F | Versant Capital Management, Inc | 400 | 0.00 | 14 | 16.67 | ||||
| 2025-08-14 | 13F | Two Sigma Investments, Lp | 155,486 | 5,619 | ||||||
| 2025-04-23 | 13F | Mascagni Wealth Management, Inc. | 0 | -100.00 | 0 | -100.00 | ||||
| 2025-08-04 | 13F | Joseph P. Lucia & Associates, LLC | 33,955 | -5.31 | 1,227 | 5.50 | ||||
| 2025-07-03 | 13F | Garde Capital, Inc. | 0 | -100.00 | 0 | |||||
| 2025-08-12 | 13F | Founders Financial Alliance, LLC | 0 | -100.00 | 0 | |||||
| 2025-05-16 | 13F | Coppell Advisory Solutions LLC | 0 | -100.00 | 0 | |||||
| 2025-04-21 | 13F | Ronald Blue Trust, Inc. | 0 | -100.00 | 0 | |||||
| 2025-08-14 | 13F | Wells Fargo & Company/mn | 30,922 | 2.93 | 1,118 | 14.68 | ||||
| 2025-07-22 | 13F | Carolina Wealth Advisors, LLC | 442 | 18.82 | 16 | 25.00 | ||||
| 2025-08-12 | 13F | Proequities, Inc. | Put | 0 | 0 | |||||
| 2025-07-24 | 13F | IFP Advisors, Inc | 225 | 0.00 | 8 | 14.29 | ||||
| 2025-07-08 | 13F | Parallel Advisors, LLC | 1,286 | -15.84 | 46 | -6.12 | ||||
| 2025-04-25 | 13F | Stonebridge Financial Group, LLC | 0 | -100.00 | 0 | |||||
| 2025-08-13 | 13F/A | StoneX Group Inc. | 9,279 | 323 | ||||||
| 2025-08-11 | 13F | Citigroup Inc | 0 | -100.00 | 0 | |||||
| 2025-04-18 | 13F | Wolf Group Capital Advisors | 7,411 | -37.59 | 240 | -36.17 | ||||
| 2025-08-13 | 13F | Congress Wealth Management LLC / DE / | 13,366 | 483 | ||||||
| 2025-07-25 | 13F | Endowment Wealth Management, Inc. | 8,309 | 26.93 | 300 | 41.51 | ||||
| 2025-05-09 | 13F | Pnc Financial Services Group, Inc. | 0 | -100.00 | 0 | |||||
| 2025-08-14 | 13F | Summit Trail Advisors, Llc | 178,271 | -37.43 | 6,443 | -30.32 | ||||
| 2025-08-14 | 13F | Endurance Services Ltd | 354,500 | 0.00 | 12,812 | 11.37 | ||||
| 2025-08-11 | 13F | SFI Advisors, LLC | 14,509 | -1.70 | 524 | 9.62 | ||||
| 2025-08-13 | 13F | Marshall Wace, Llp | 26,605 | 152.80 | 962 | 181.82 | ||||
| 2025-08-12 | 13F | LPL Financial LLC | 83,492 | -10.27 | 3,017 | -0.07 | ||||
| 2025-04-25 | 13F | Albion Financial Group /ut | 0 | -100.00 | 0 | |||||
| 2025-07-18 | 13F | O'ROURKE & COMPANY, Inc | 6,744 | -18.38 | 244 | -9.33 | ||||
| 2025-05-14 | 13F | Legend Financial Advisors, Inc. | 0 | -100.00 | 0 | |||||
| 2025-08-14 | 13F | Goldman Sachs Group Inc | 86,173 | 31.23 | 3,114 | 46.20 | ||||
| 2025-08-19 | 13F | Advisory Services Network, LLC | 9,198 | 5.28 | 322 | 13.43 | ||||
| 2025-08-13 | 13F | Sumitomo Mitsui Financial Group, Inc. | 58,506 | -19.28 | 2,114 | -10.12 |
Other Listings
| MX:WCLD |