Mga Batayang Estadistika
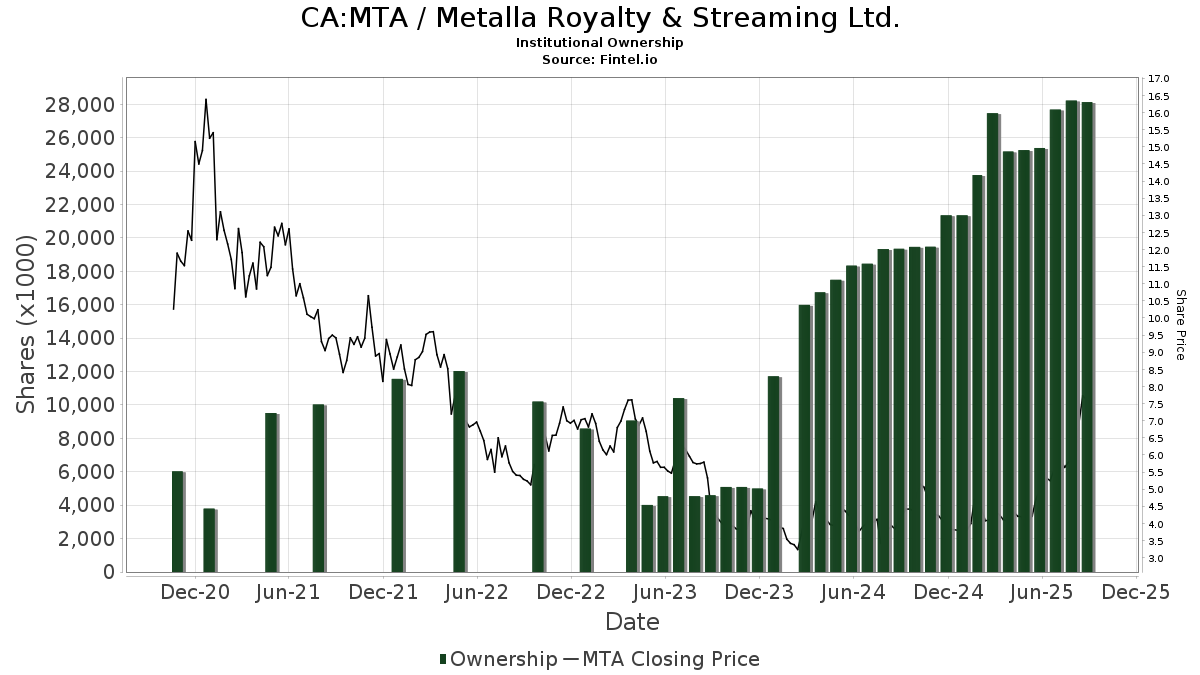
| Saham Institusional (Jangka Panjang) | 28,150,905 - 30.42% (ex 13D/G) - change of 2.77MM shares 10.91% MRQ |
| Nilai Institusional (Jangka Panjang) | $ 70,434 USD ($1000) |
Kepemilikan Institusional dan Pemegang Saham
Metalla Royalty & Streaming Ltd. (CA:MTA) memiliki 78 pemilik institusional dan pemegang saham yang telah mengajukan formulir 13D/G atau 13F kepada Komisi Bursa Efek (Securities Exchange Commission/SEC). Lembaga-lembaga ini memegang total 28,150,905 saham. Pemegang saham terbesar meliputi Euro Pacific Asset Management, LLC, EPGFX - EuroPac Gold Fund Class A, ASA Gold & Precious Metals Ltd, Merk Investments LLC, Van Eck Associates Corp, GDXJ - VanEck Vectors Junior Gold Miners ETF, Fmr Llc, Citadel Advisors Llc, Sprott Inc., and FSDPX - Materials Portfolio .
Struktur kepemilikan institusional Metalla Royalty & Streaming Ltd. (TSXV:MTA) menunjukkan posisi terkini di perusahaan oleh institusi dan dana, serta perubahan terbaru dalam ukuran posisi. Pemegang saham utama dapat mencakup investor individu, reksa dana, dana lindung nilai, atau institusi. Jadwal 13D menunjukkan bahwa investor memegang (atau pernah memegang) lebih dari 5% saham perusahaan dan bermaksud (atau pernah bermaksud) untuk secara aktif mengejar perubahan strategi bisnis. Jadwal 13G menunjukkan investasi pasif lebih dari 5%.
The share price as of September 5, 2025 is 7.78 / share. Previously, on September 6, 2024, the share price was 3.94 / share. This represents an increase of 97.46% over that period.
Skor Sentimen Dana
Skor Sentimen Dana (sebelumnya dikenal sebagai Skor Akumulasi Kepemilikan) menemukan saham-saham yang paling banyak dibeli oleh dana. Ini adalah hasil dari model kuantitatif multi-faktor yang canggih yang mengidentifikasi perusahaan dengan tingkat akumulasi institusional tertinggi. Model penilaian menggunakan kombinasi dari total peningkatan pemilik yang diungkapkan, perubahan dalam alokasi portofolio pada pemilik tersebut, dan metrik lainnya. Angka berkisar dari 0 hingga 100, dengan angka yang lebih tinggi menunjukkan tingkat akumulasi yang lebih tinggi dibandingkan dengan perusahaan sejenisnya, dan 50 adalah rata-ratanya.
Frekuensi Pembaruan: Setiap Hari
Lihat Ownership Explorer, yang menyediakan daftar perusahaan dengan peringkat tertinggi.
Pengajuan 13F dan NPORT
Detail pada pengajuan 13F tersedia gratis. Detail pada pengajuan NP memerlukan keanggotaan premium. Baris berwarna hijau menunjukkan posisi baru. Baris berwarna merah menunjukkan posisi yang sudah ditutup. Klik tautan ini ikon untuk melihat riwayat transaksi selengkapnya.
Tingkatkan
untuk membuka data premium dan mengekspor ke Excel ![]() .
.
| Tanggal File | Sumber | Investor | Ketik | Presyo ng Avg (Silangan) |
Saham | Δ Saham (%) |
Dilaporkan Nilai ($1000) |
Nilai Δ (%) |
Alokasi Port (%) |
|
|---|---|---|---|---|---|---|---|---|---|---|
| 2025-08-14 | 13F | 683 Capital Management, LLC | 0 | -100.00 | 0 | |||||
| 2025-08-14 | 13F | Cubist Systematic Strategies, LLC | 36,483 | 66.08 | 140 | 125.81 | ||||
| 2025-08-12 | 13F | Tradition Wealth Management, LLC | 10,329 | 0.00 | 40 | 34.48 | ||||
| 2025-08-14 | 13F | Qube Research & Technologies Ltd | 54,343 | 209 | ||||||
| 2025-08-21 | NP | GDXJ - VanEck Vectors Junior Gold Miners ETF | 2,410,869 | -28.97 | 9,258 | -4.64 | ||||
| 2025-08-13 | 13F | Renaissance Technologies Llc | 281,800 | 37.13 | 1,082 | 84.33 | ||||
| 2025-08-14 | 13F | Sunbelt Securities, Inc. | 16,700 | 0.00 | 42 | -12.77 | ||||
| 2025-08-07 | 13F | Rathbone Brothers plc | 0 | -100.00 | 0 | |||||
| 2025-08-18 | 13F | Wolverine Trading, Llc | 10,091 | -25.70 | 38 | -5.00 | ||||
| 2025-08-12 | 13F | Insigneo Advisory Services, Llc | 357,029 | 1,371 | ||||||
| 2025-08-13 | 13F | Northern Trust Corp | 47,082 | 181 | ||||||
| 2025-08-14 | 13F | Van Eck Associates Corp | 2,756,190 | -25.79 | 11 | 0.00 | ||||
| 2025-07-29 | 13F | LB Partners LLC | 36,000 | 0.00 | 138 | 33.98 | ||||
| 2025-08-11 | 13F | TD Waterhouse Canada Inc. | 0 | -100.00 | 0 | |||||
| 2025-08-14 | 13F | Millennium Management Llc | 278,201 | 497.72 | 1,068 | 703.01 | ||||
| 2025-07-24 | NP | FSDPX - Materials Portfolio This fund is a listed as child fund of Fmr Llc and if that institution has disclosed ownership in this security, then these positions will not be double counted when calculating total shares and total value | 648,100 | 10.96 | 2,092 | 30.26 | ||||
| 2025-08-12 | 13F | NWF Advisory Services Inc. | 20,100 | -4.07 | 58 | 9.62 | ||||
| 2025-08-14 | 13F | Point72 (DIFC) Ltd | 3,096 | 12 | ||||||
| 2025-08-14 | 13F | CoreCap Advisors, LLC | 1 | 0 | ||||||
| 2025-07-09 | 13F | Massmutual Trust Co Fsb/adv | 4,680 | 0.00 | 18 | 30.77 | ||||
| 2025-08-14 | 13F | Df Dent & Co Inc | 0 | -100.00 | 0 | |||||
| 2025-08-12 | 13F | Virtu Financial LLC | 0 | -100.00 | 0 | |||||
| 2025-08-14 | 13F | Papamarkou Wellner Asset Management inc. | 30,272 | 9.50 | 116 | 46.84 | ||||
| 2025-08-14 | 13F | Fmr Llc | 1,224,000 | 10.86 | 4,692 | 47.01 | ||||
| 2025-07-29 | 13F | Sentry Investment Management Llc | 14,977 | 0.00 | 0 | |||||
| 2025-08-13 | 13F | Walleye Capital LLC | 146,364 | 562 | ||||||
| 2025-08-12 | 13F | Hillsdale Investment Management Inc. | 66,600 | 255 | ||||||
| 2025-08-26 | NP | AFMCX - Acuitas US Microcap Fund Institutional Shares | 36,531 | 140 | ||||||
| 2025-08-12 | 13F | Jpmorgan Chase & Co | 14,071 | 42.13 | 54 | 92.86 | ||||
| 2025-07-28 | NP | ASA Gold & Precious Metals Ltd | 3,000,000 | 0.00 | 9,660 | 17.09 | ||||
| 2025-08-14 | 13F | Merk Investments LLC | 3,000,000 | 0.00 | 11,520 | 34.27 | ||||
| 2025-08-14 | 13F | Man Group plc | 63,404 | 99.35 | 243 | 170.00 | ||||
| 2025-08-14 | 13F | Jane Street Group, Llc | Call | 16,400 | 63 | |||||
| 2025-08-14 | 13F | Jane Street Group, Llc | 91,575 | 254.31 | 352 | 380.82 | ||||
| 2025-08-14 | 13F | SWAN Capital LLC | 200 | 1 | ||||||
| 2025-08-14 | 13F | UBS Group AG | 21,859 | 2,077.19 | 84 | 4,050.00 | ||||
| 2025-05-21 | 13F/A | Geneos Wealth Management Inc. | 0 | -100.00 | 0 | -100.00 | ||||
| 2025-05-07 | 13F | LPL Financial LLC | 0 | -100.00 | 0 | |||||
| 2025-08-14 | 13F | Citadel Advisors Llc | Call | 0 | -100.00 | 0 | ||||
| 2025-08-14 | 13F | D. E. Shaw & Co., Inc. | 277,833 | 300.91 | 1,067 | 438.38 | ||||
| 2025-08-14 | 13F | Two Sigma Investments, Lp | 408,227 | 66.99 | 1,568 | 124.18 | ||||
| 2025-05-15 | 13F | Tower Research Capital LLC (TRC) | 0 | -100.00 | 0 | |||||
| 2025-08-12 | 13F | MAI Capital Management | 2,419 | 0.00 | 9 | 50.00 | ||||
| 2025-08-12 | 13F | Steward Partners Investment Advisory, Llc | 0 | -100.00 | 0 | |||||
| 2025-08-14 | 13F | Wells Fargo & Company/mn | 12,681 | 0.00 | 49 | 33.33 | ||||
| 2025-08-12 | 13F | Boreal Capital Management LLC | 41,630 | 160 | ||||||
| 2025-08-12 | 13F | XTX Topco Ltd | 88,710 | 203.42 | 341 | 309.64 | ||||
| 2025-08-11 | 13F | Sprott Inc. | 721,059 | -0.45 | 2,771 | 33.80 | ||||
| 2025-08-12 | 13F | Horizon Kinetics Asset Management Llc | 405,430 | 0.97 | 1,557 | 35.54 | ||||
| 2025-08-14 | 13F | Hrt Financial Lp | 60,622 | 40.03 | 0 | |||||
| 2025-04-21 | 13F | Nelson, Van Denburg & Campbell Wealth Management Group, LLC | 0 | -100.00 | 0 | |||||
| 2025-07-24 | 13F | Ronald Blue Trust, Inc. | 1,500 | 0.00 | 6 | 25.00 | ||||
| 2025-08-12 | 13F | Proequities, Inc. | 0 | 0 | ||||||
| 2025-04-24 | 13F | U S Global Investors Inc | 0 | -100.00 | 0 | |||||
| 2025-08-05 | 13F | Simplex Trading, Llc | 32,824 | 144.54 | 0 | |||||
| 2025-08-14 | 13F | Two Sigma Advisers, Lp | 153,800 | 200.98 | 591 | 304.11 | ||||
| 2025-07-15 | 13F | Northside Capital Management, LLC | 111,578 | 0.00 | 428 | 34.17 | ||||
| 2025-07-25 | 13F | Stonehage Fleming Financial Services Holdings Ltd | 20,490 | 95.20 | 79 | 160.00 | ||||
| 2025-07-23 | 13F/A | Euro Pacific Asset Management, LLC | 5,657,905 | 11.78 | 22 | 50.00 | ||||
| 2025-07-16 | 13F | Eagle Global Advisors Llc | 79,800 | 0.00 | 306 | 34.21 | ||||
| 2025-08-13 | 13F | Marshall Wace, Llp | 419,373 | 32.02 | 1,610 | 77.31 | ||||
| 2025-08-14 | 13F/A | Barclays Plc | 47,000 | 0 | ||||||
| 2025-08-22 | NP | FFNKX - Materials Portfolio Initial Class | 55,000 | 11.11 | 211 | 46.85 | ||||
| 2025-05-15 | 13F | Two Sigma Securities, Llc | 0 | -100.00 | 0 | -100.00 | ||||
| 2025-08-11 | 13F | HighTower Advisors, LLC | 132,199 | -0.77 | 508 | 33.07 | ||||
| 2025-08-14 | 13F | Oxford Asset Management Llp | 32,934 | 126 | ||||||
| 2025-07-24 | NP | FNARX - Natural Resources Portfolio This fund is a listed as child fund of Fmr Llc and if that institution has disclosed ownership in this security, then these positions will not be double counted when calculating total shares and total value | 520,900 | 10.71 | 1,681 | 29.91 | ||||
| 2025-08-14 | 13F | Citadel Advisors Llc | 790,501 | 57.75 | 3,036 | 111.79 | ||||
| 2025-08-14 | 13F | Susquehanna International Group, Llp | 88,121 | -20.45 | 338 | 6.96 | ||||
| 2025-08-12 | 13F | SRS Capital Advisors, Inc. | 2,200 | 0.00 | 8 | 33.33 | ||||
| 2025-08-14 | 13F | Citadel Advisors Llc | Put | 50,800 | 116.17 | 195 | 191.04 | |||
| 2025-08-14 | 13F | Susquehanna International Group, Llp | Put | 43,400 | 197.26 | 167 | 304.88 | |||
| 2025-07-21 | 13F | Hilltop National Bank | 869 | 525.18 | 3 | |||||
| 2025-08-18 | 13F/A | National Bank Of Canada /fi/ | 6,566 | 10.20 | 24 | 41.18 | ||||
| 2025-08-05 | 13F | Bank Of Montreal /can/ | 21,023 | -8.04 | 81 | 21.21 | ||||
| 2025-08-14 | 13F | Balyasny Asset Management Llc | 10,409 | 40 | ||||||
| 2025-08-14 | 13F | Federation des caisses Desjardins du Quebec | 5,236 | -54.69 | 19 | -42.42 | ||||
| 2025-08-28 | NP | INFL - Horizon Kinetics Inflation Beneficiaries ETF | 390,000 | 0.00 | 1,498 | 34.26 | ||||
| 2025-08-13 | 13F | Continuum Advisory, LLC | 0 | -100.00 | 0 | |||||
| 2025-08-14 | 13F | Raymond James Financial Inc | 280,508 | 2,230.38 | 1,077 | 3,067.65 | ||||
| 2025-08-13 | 13F | Quadrature Capital Ltd | 30,578 | 57.85 | 117 | 112.73 | ||||
| 2025-08-15 | 13F | Morgan Stanley | 278,750 | 6,697.12 | 1,070 | 9,627.27 | ||||
| 2025-08-08 | 13F | Pnc Financial Services Group, Inc. | 1,000 | 0.00 | 4 | 50.00 | ||||
| 2025-06-25 | NP | EPGFX - EuroPac Gold Fund Class A | 3,155,115 | 268.25 | 9,635 | 294.72 | ||||
| 2025-07-28 | 13F | Kiker Wealth Management, LLC | 6,003 | 595.60 | 23 | 1,050.00 | ||||
| 2025-08-14 | 13F | Bank Of America Corp /de/ | 72,162 | 3,836.82 | 277 | 5,440.00 | ||||
| 2025-08-14 | 13F | Royal Bank Of Canada | 5,126 | -68.60 | 20 | -57.45 | ||||
| 2025-08-14 | 13F | Graham Capital Management, L.P. | 13,202 | 51 | ||||||
| 2025-07-31 | 13F | Cambridge Investment Research Advisors, Inc. | 94,813 | -43.57 | 0 | |||||
| 2025-08-04 | 13F | Creekmur Asset Management LLC | 1 | 0.00 | 0 | |||||
| 2025-08-06 | 13F | Legacy Wealth Managment, LLC/ID | 400 | 0.00 | 2 | 0.00 | ||||
| 2025-09-04 | 13F/A | Advisor Group Holdings, Inc. | 14,084 | 7.64 | 54 | 45.95 | ||||
| 2025-08-14 | 13F/A | Perritt Capital Management Inc | 2,850 | 0.00 | 11 | 25.00 | ||||
| 2025-08-14 | 13F | Goldman Sachs Group Inc | 72,131 | 277 | ||||||
| 2025-08-06 | 13F | Legacy Investment Solutions, LLC | 400 | 2 | ||||||
| 2025-08-14 | 13F | Group One Trading, L.p. | 12,996 | 50 |