Mga Batayang Estadistika
| Pemilik Institusional | 125 total, 122 long only, 0 short only, 3 long/short - change of -1.57% MRQ |
| Alokasi Portofolio Rata-rata | 0.2899 % - change of 73.01% MRQ |
| Saham Institusional (Jangka Panjang) | 3,025,016 (ex 13D/G) - change of -0.16MM shares -4.89% MRQ |
| Nilai Institusional (Jangka Panjang) | $ 223,809 USD ($1000) |
Kepemilikan Institusional dan Pemegang Saham
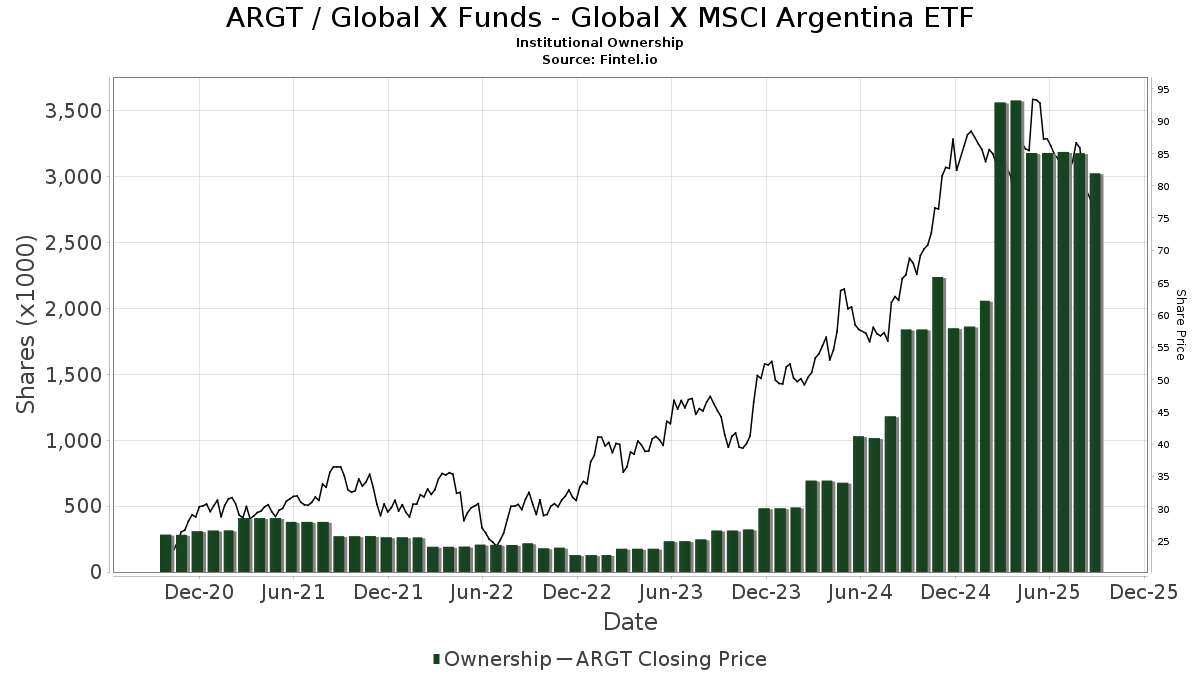
Global X Funds - Global X MSCI Argentina ETF (US:ARGT) memiliki 125 pemilik institusional dan pemegang saham yang telah mengajukan formulir 13D/G atau 13F kepada Komisi Bursa Efek (Securities Exchange Commission/SEC). Lembaga-lembaga ini memegang total 3,025,016 saham. Pemegang saham terbesar meliputi Bank Julius Baer & Co. Ltd, Zurich, Duquesne Family Office LLC, Marshall Wace, Llp, Breakout Capital Partners, LP, LPL Financial LLC, Morgan Stanley, Bank Of America Corp /de/, Susquehanna International Group, Llp, Activest Wealth Management, and Moran Wealth Management, LLC .
Struktur kepemilikan institusional Global X Funds - Global X MSCI Argentina ETF (ARCA:ARGT) menunjukkan posisi terkini di perusahaan oleh institusi dan dana, serta perubahan terbaru dalam ukuran posisi. Pemegang saham utama dapat mencakup investor individu, reksa dana, dana lindung nilai, atau institusi. Jadwal 13D menunjukkan bahwa investor memegang (atau pernah memegang) lebih dari 5% saham perusahaan dan bermaksud (atau pernah bermaksud) untuk secara aktif mengejar perubahan strategi bisnis. Jadwal 13G menunjukkan investasi pasif lebih dari 5%.
The share price as of September 5, 2025 is 79.81 / share. Previously, on September 6, 2024, the share price was 64.72 / share. This represents an increase of 23.32% over that period.
Skor Sentimen Dana
Skor Sentimen Dana (sebelumnya dikenal sebagai Skor Akumulasi Kepemilikan) menemukan saham-saham yang paling banyak dibeli oleh dana. Ini adalah hasil dari model kuantitatif multi-faktor yang canggih yang mengidentifikasi perusahaan dengan tingkat akumulasi institusional tertinggi. Model penilaian menggunakan kombinasi dari total peningkatan pemilik yang diungkapkan, perubahan dalam alokasi portofolio pada pemilik tersebut, dan metrik lainnya. Angka berkisar dari 0 hingga 100, dengan angka yang lebih tinggi menunjukkan tingkat akumulasi yang lebih tinggi dibandingkan dengan perusahaan sejenisnya, dan 50 adalah rata-ratanya.
Frekuensi Pembaruan: Setiap Hari
Lihat Ownership Explorer, yang menyediakan daftar perusahaan dengan peringkat tertinggi.
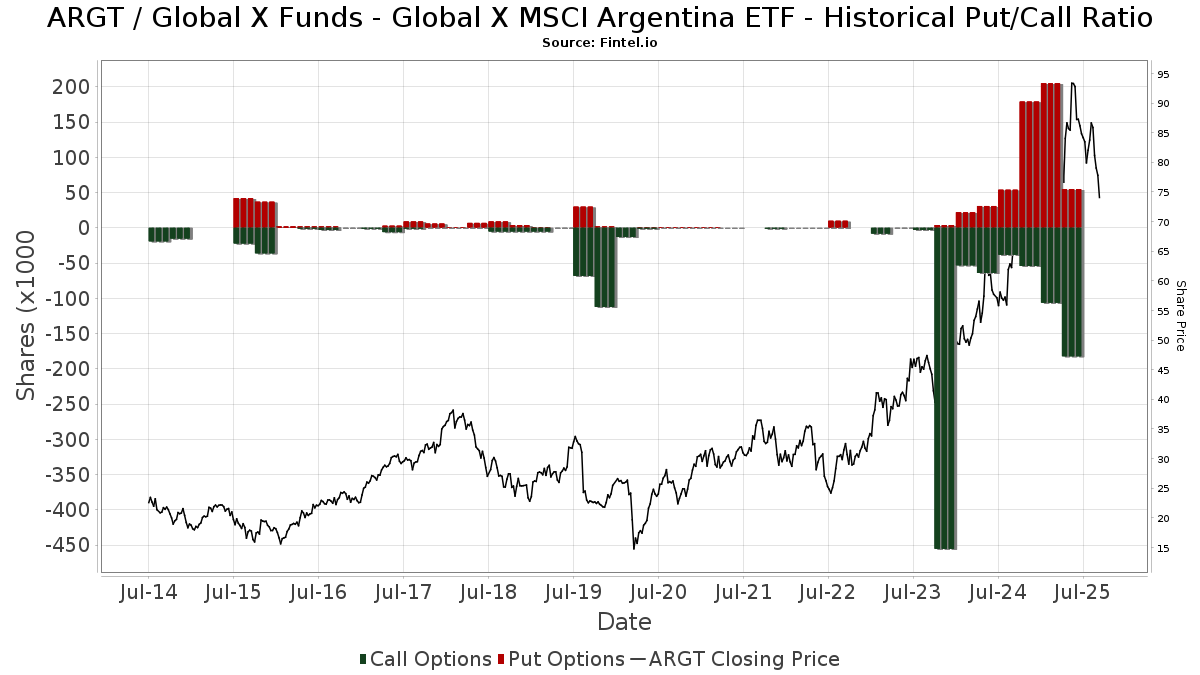
Rasio Put/Call Institusional
Selain melaporkan isu ekuitas dan utang standar, institusi dengan aset di bawah manajemen lebih dari 100 juta dolar AS juga harus mengungkapkan kepemilikan opsi put dan call mereka. Karena opsi put umumnya menunjukkan sentimen negatif, dan opsi call menunjukkan sentimen positif, kita dapat mengetahui sentimen institusional secara keseluruhan dengan memplot rasio put terhadap call. Grafik di sebelah kanan memplot rasio put/call historis untuk instrumen ini.
Menggunakan Rasio Put/Call sebagai indikator sentimen investor mengatasi salah satu kekurangan utama dari penggunaan total kepemilikan institusional, yaitu sejumlah besar aset yang dikelola diinvestasikan secara pasif untuk melacak indeks. Dana yang dikelola secara pasif biasanya tidak membeli opsi, sehingga indikator rasio put/call lebih akurat dalam melacak sentimen dana yang dikelola secara aktif.
Pengajuan 13F dan NPORT
Detail pada pengajuan 13F tersedia gratis. Detail pada pengajuan NP memerlukan keanggotaan premium. Baris berwarna hijau menunjukkan posisi baru. Baris berwarna merah menunjukkan posisi yang sudah ditutup. Klik tautan ini ikon untuk melihat riwayat transaksi selengkapnya.
Tingkatkan
untuk membuka data premium dan mengekspor ke Excel ![]() .
.
| Tanggal File | Sumber | Investor | Ketik | Presyo ng Avg (Silangan) |
Saham | Δ Saham (%) |
Dilaporkan Nilai ($1000) |
Nilai Δ (%) |
Alokasi Port (%) |
|
|---|---|---|---|---|---|---|---|---|---|---|
| 2025-07-31 | 13F | Leavell Investment Management, Inc. | 4,361 | 370 | ||||||
| 2025-08-08 | 13F | Pnc Financial Services Group, Inc. | 200 | -74.03 | 17 | -5.88 | ||||
| 2025-08-14 | 13F | Qube Research & Technologies Ltd | 63,461 | 95.14 | 5,377 | 104.76 | ||||
| 2025-08-14 | 13F | Millennium Management Llc | 3,732 | -78.50 | 316 | -77.46 | ||||
| 2025-08-19 | 13F | Advisory Services Network, LLC | 3,450 | 33.46 | 285 | 37.02 | ||||
| 2025-07-29 | 13F | Activest Wealth Management | 96,240 | 1.13 | 8,154 | 6.09 | ||||
| 2025-08-15 | 13F | Duquesne Family Office LLC | 267,700 | -39.68 | 23 | -37.14 | ||||
| 2025-07-29 | 13F | Stratos Wealth Partners, LTD. | 2,491 | 0.00 | 211 | 4.98 | ||||
| 2025-05-12 | 13F | Citigroup Inc | 0 | -100.00 | 0 | |||||
| 2025-08-14 | 13F | LMR Partners LLP | 0 | -100.00 | 0 | |||||
| 2025-07-28 | 13F | Moran Wealth Management, LLC | 82,007 | 2.06 | 6,948 | 7.07 | ||||
| 2025-08-11 | 13F | Private Advisor Group, LLC | 29,330 | 18.92 | 2,485 | 24.75 | ||||
| 2025-08-12 | 13F | Jpmorgan Chase & Co | 55,419 | 39.99 | 4,696 | 46.86 | ||||
| 2025-05-12 | 13F | Founders Financial Securities Llc | 0 | -100.00 | 0 | |||||
| 2025-08-18 | 13F | Wolverine Trading, Llc | Call | 0 | -100.00 | 0 | ||||
| 2025-07-30 | 13F | Loring Wolcott & Coolidge Fiduciary Advisors Llp/ma | 4,645 | 394 | ||||||
| 2025-08-14 | 13F | Kite Lake Capital Management (uk) Llp | 40,000 | 0.00 | 3,389 | 4.92 | ||||
| 2025-08-14 | 13F | Barometer Capital Management Inc. | 5,300 | 253.33 | 449 | 271.07 | ||||
| 2025-08-04 | 13F | Bay Colony Advisory Group, Inc d/b/a Bay Colony Advisors | 0 | -100.00 | 0 | -100.00 | ||||
| 2025-04-30 | 13F | BCJ Capital Management, LLC | 0 | -100.00 | 0 | |||||
| 2025-07-30 | 13F | Cavalier Investments, LLC | 22,781 | -1.98 | 1,930 | 2.82 | ||||
| 2025-07-31 | 13F | Cambridge Investment Research Advisors, Inc. | 18,799 | 34.17 | 2 | 0.00 | ||||
| 2025-07-10 | 13F | Contravisory Investment Management, Inc. | 5,697 | 483 | ||||||
| 2025-08-14 | 13F | Intrepid Family Office Llc | 15,000 | 50.00 | 1,271 | 57.37 | ||||
| 2025-08-14 | 13F | Ameriprise Financial Inc | 40,723 | 1.72 | 3,450 | 6.71 | ||||
| 2025-05-14 | 13F | Absolute Gestao de Investimentos Ltda. | 0 | -100.00 | 0 | |||||
| 2025-08-15 | 13F | Harvest Fund Management Co., Ltd | 0 | -100.00 | 0 | |||||
| 2025-07-15 | 13F | SJS Investment Consulting Inc. | 21 | -12.50 | 2 | 0.00 | ||||
| 2025-08-15 | 13F | Tower Research Capital LLC (TRC) | 621 | 918.03 | 53 | 2,500.00 | ||||
| 2025-08-14 | 13F | Royal Bank Of Canada | 19,753 | 29.78 | 1,673 | 36.13 | ||||
| 2025-05-13 | 13F | Waratah Capital Advisors Ltd. | 0 | -100.00 | 0 | |||||
| 2025-05-14 | 13F | CI Private Wealth, LLC | 0 | -100.00 | 0 | |||||
| 2025-08-19 | 13F | National Asset Management, Inc. | 3,085 | 261 | ||||||
| 2025-08-05 | 13F | Carolinas Wealth Consulting Llc | 0 | -100.00 | 0 | -100.00 | ||||
| 2025-07-11 | 13F | Grove Bank & Trust | 25 | 2 | ||||||
| 2025-07-29 | 13F | Primoris Wealth Advisors, Llc | 0 | -100.00 | 0 | |||||
| 2025-08-05 | 13F | Simplex Trading, Llc | 0 | -100.00 | 0 | |||||
| 2025-08-06 | 13F | Commonwealth Equity Services, Llc | 13,078 | 18.28 | 1 | |||||
| 2025-08-13 | 13F | Berbice Capital Management LLC | 300 | 0.00 | 25 | 4.17 | ||||
| 2025-08-05 | 13F | Bank Of Montreal /can/ | 383 | -64.00 | 33 | -62.35 | ||||
| 2025-07-10 | 13F | Wealth Enhancement Advisory Services, Llc | 3,652 | -20.87 | 310 | -16.67 | ||||
| 2025-08-06 | 13F | Csenge Advisory Group | 20,802 | 0.35 | 1,877 | 5.57 | ||||
| 2025-08-11 | 13F | HighTower Advisors, LLC | 7,560 | -29.12 | 641 | -25.67 | ||||
| 2025-07-22 | 13F | DAVENPORT & Co LLC | 3,667 | 6.63 | 311 | 11.91 | ||||
| 2025-07-22 | 13F | Kercheville Advisors, LLC | 4,000 | -42.86 | 339 | -40.18 | ||||
| 2025-08-01 | 13F | Belvedere Trading LLC | 21,033 | 2.46 | 1,782 | 7.48 | ||||
| 2025-08-01 | 13F | Belvedere Trading LLC | Call | 15,800 | 295.00 | 1,339 | 314.24 | |||
| 2025-05-07 | 13F | Chandler Asset Management, Inc. | 0 | -100.00 | 0 | |||||
| 2025-08-01 | 13F | Belvedere Trading LLC | Put | 13,000 | 2,066.67 | 1,101 | 2,193.75 | |||
| 2025-08-14 | 13F | Two Sigma Securities, Llc | 7,131 | 604 | ||||||
| 2025-07-31 | 13F | Glass Jacobson Investment Advisors llc | 0 | -100.00 | 0 | |||||
| 2025-08-11 | 13F | TD Waterhouse Canada Inc. | 303 | -96.12 | 25 | -96.07 | ||||
| 2025-08-05 | 13F | Verity Asset Management, Inc. | 0 | -100.00 | 0 | |||||
| 2025-08-14 | 13F | Bank Of America Corp /de/ | 151,933 | 0.60 | 12,873 | 5.53 | ||||
| 2025-08-14 | 13F/A | Bank Julius Baer & Co. Ltd, Zurich | 284,421 | 13.57 | 24,099 | 5.41 | ||||
| 2025-07-29 | 13F | Fundamentun, Llc | 39,434 | 38.59 | 3,341 | 45.39 | ||||
| 2025-08-14 | 13F | DZ BANK AG Deutsche Zentral Genossenschafts Bank, Frankfurt am Main | 5,900 | 0.00 | 500 | 4.83 | ||||
| 2025-05-15 | 13F | Integrated Wealth Concepts LLC | 0 | -100.00 | 0 | |||||
| 2025-08-13 | 13F | Basso Capital Management, L.p. | 25 | -99.43 | 2 | -99.43 | ||||
| 2025-07-28 | 13F | Harbour Investments, Inc. | 50 | 0.00 | 4 | 0.00 | ||||
| 2025-08-14 | 13F | Schonfeld Strategic Advisors LLC | 0 | -100.00 | 0 | |||||
| 2025-08-13 | 13F | Coco Enterprises, LLC | 20,102 | 11.57 | 1,703 | 34.52 | ||||
| 2025-08-14 | 13F | Hrt Financial Lp | 7,501 | 35.06 | 1 | |||||
| 2025-07-28 | NP | AGOX - Adaptive Growth Opportunities ETF | 22,741 | -3.07 | 2,052 | 5.61 | ||||
| 2025-08-08 | 13F | Smithfield Trust Co | 237 | 0.00 | 0 | |||||
| 2025-03-25 | NP | FEDERATED CORE TRUST - Emerging Markets Core Fund This fund is a listed as child fund of Federated Hermes, Inc. and if that institution has disclosed ownership in this security, then these positions will not be double counted when calculating total shares and total value | 12,524 | 1,083 | ||||||
| 2025-08-12 | 13F | Proequities, Inc. | 0 | 0 | ||||||
| 2025-08-08 | 13F | Cetera Investment Advisers | 7,366 | -29.44 | 624 | -25.98 | ||||
| 2025-07-24 | 13F | Capital Advisors, Ltd. LLC | 581 | 0.00 | 0 | |||||
| 2025-08-14 | 13F | Banco BTG Pactual S.A. | 0 | -100.00 | 0 | |||||
| 2025-07-07 | 13F | Roxbury Financial LLC | 35 | 0.00 | 3 | 0.00 | ||||
| 2025-07-28 | 13F | Copia Wealth Management | 0 | -100.00 | 0 | |||||
| 2025-08-14 | 13F | FIL Ltd | 612 | 4.79 | 53 | 10.64 | ||||
| 2025-08-06 | 13F | AE Wealth Management LLC | 171 | 14 | ||||||
| 2025-08-14 | 13F | Stifel Financial Corp | 15,059 | -0.49 | 1,276 | 4.34 | ||||
| 2025-08-14 | 13F | Militia Capital Partners, LP | 0 | -100.00 | 0 | |||||
| 2025-08-01 | 13F | Envestnet Asset Management Inc | 0 | -100.00 | 0 | |||||
| 2025-08-14 | 13F | Gordian Capital Singapore Pte Ltd | 1,900 | -57.78 | 161 | -57.22 | ||||
| 2025-08-12 | 13F | Trexquant Investment LP | 2,838 | -7.32 | 240 | -2.83 | ||||
| 2025-07-24 | 13F | Blair William & Co/il | 25 | 0.00 | 2 | 0.00 | ||||
| 2025-08-12 | 13F | Global Retirement Partners, LLC | 71 | 0.00 | 6 | 20.00 | ||||
| 2025-08-13 | 13F | Global Endowment Management, LP | 12,000 | 0.00 | 1,017 | 4.85 | ||||
| 2025-08-18 | 13F | Geneos Wealth Management Inc. | 485 | -95.65 | 41 | -95.45 | ||||
| 2025-05-15 | 13F | Hilltop Holdings Inc. | 0 | -100.00 | 0 | |||||
| 2025-05-15 | 13F | Southpoint Capital Advisors LP | 0 | -100.00 | 0 | |||||
| 2025-07-07 | 13F | Park Edge Advisors, LLC | 6,844 | 21.09 | 580 | 26.97 | ||||
| 2025-07-16 | 13F | ORG Partners LLC | 20 | 0.00 | 2 | 0.00 | ||||
| 2025-08-14 | 13F | D. E. Shaw & Co., Inc. | 55,854 | 42.49 | 4,733 | 49.46 | ||||
| 2025-08-13 | 13F | Renaissance Technologies Llc | 17,239 | 1,461 | ||||||
| 2025-08-18 | 13F/A | National Bank Of Canada /fi/ | 210 | 2,000.00 | 18 | |||||
| 2025-04-17 | 13F | Good Life Advisors, LLC | 0 | -100.00 | 0 | |||||
| 2025-08-08 | 13F | Itau Unibanco Holding S.A. | 16,282 | 1,380 | ||||||
| 2025-08-14 | 13F | Private Wealth Advisors, LLC | 26,581 | 2,252 | ||||||
| 2025-08-14 | 13F | UBS Group AG | 7,094 | -64.71 | 601 | -62.97 | ||||
| 2025-07-24 | 13F | Us Bancorp \de\ | 5,590 | 0.00 | 474 | 4.88 | ||||
| 2025-08-06 | 13F | Prospera Financial Services Inc | 0 | -100.00 | 0 | -100.00 | ||||
| 2025-08-08 | 13F | Gts Securities Llc | 2,955 | 250 | ||||||
| 2025-08-12 | 13F | LPL Financial LLC | 171,520 | 1.11 | 14,533 | 6.07 | ||||
| 2025-07-14 | 13F | Sowell Financial Services LLC | 12,373 | -0.98 | 1,048 | 3.87 | ||||
| 2025-07-29 | 13F | Stratos Wealth Advisors, LLC | 2,745 | -82.05 | 233 | -81.20 | ||||
| 2025-08-14 | 13F | Atomi Financial Group, Inc. | 0 | -100.00 | 0 | |||||
| 2025-08-11 | 13F | Strategic Wealth Partners, Ltd. | 531 | 45 | ||||||
| 2025-08-14 | 13F | Nwi Management Lp | 8,900 | 0.00 | 1 | |||||
| 2025-08-13 | 13F | Marshall Wace, Llp | 230,361 | 1,074.11 | 19,518 | 1,132.20 | ||||
| 2025-08-14 | 13F | Old Mission Capital Llc | 59,212 | -23.18 | 5,017 | -19.41 | ||||
| 2025-08-07 | 13F | Allworth Financial LP | 300 | 25 | ||||||
| 2025-07-14 | 13F | Legacy Capital Group California, Inc. | 5,642 | 478 | ||||||
| 2025-08-13 | 13F | VestGen Advisors, LLC | 0 | -100.00 | 0 | |||||
| 2025-08-14 | 13F | Breakout Capital Partners, LP | 192,800 | 16,336 | ||||||
| 2025-08-13 | 13F | Twin Peaks Wealth Advisors, LLC | 30 | 3 | ||||||
| 2025-05-13 | 13F | M Holdings Securities, Inc. | 0 | -100.00 | 0 | |||||
| 2025-05-15 | 13F | Fundsmith Investment Services Ltd. | 0 | -100.00 | 0 | -100.00 | ||||
| 2025-08-13 | 13F | Walleye Capital LLC | 0 | -100.00 | 0 | |||||
| 2025-05-06 | 13F | Financial & Tax Architects, LLC | 0 | -100.00 | 0 | |||||
| 2025-08-04 | 13F | Creative Financial Designs Inc /adv | 3,149 | -1.04 | 267 | 3.91 | ||||
| 2025-08-12 | 13F | SRS Capital Advisors, Inc. | 2 | -60.00 | 0 | |||||
| 2025-08-14 | 13F | CoreCap Advisors, LLC | 35,908 | 10.10 | 3,042 | 15.49 | ||||
| 2025-08-14 | 13F | Toroso Investments, LLC | 25,808 | 5.26 | 2,187 | 10.40 | ||||
| 2025-08-19 | 13F | Slocum, Gordon & Co LLP | 0 | -100.00 | 0 | |||||
| 2025-08-08 | 13F | City Of London Investment Management Co Ltd | 34,400 | 14.67 | 2,915 | 20.26 | ||||
| 2025-09-04 | 13F/A | Advisor Group Holdings, Inc. | 5,236 | -30.90 | 444 | -27.50 | ||||
| 2025-07-30 | 13F | Crewe Advisors LLC | 63 | 0.00 | 5 | 0.00 | ||||
| 2025-07-23 | 13F | MADDEN SECURITIES Corp | 3,000 | 0.00 | 254 | 4.96 | ||||
| 2025-08-14 | 13F | Citadel Advisors Llc | Call | 44,500 | 28.61 | 3,770 | 34.93 | |||
| 2025-08-14 | 13F | Fmr Llc | 1,591 | 0.00 | 137 | 6.25 | ||||
| 2025-05-16 | 13F | Cape Investment Advisory, Inc. | 0 | -100.00 | 0 | -100.00 | ||||
| 2025-07-09 | 13F | Client First Investment Management LLC | 0 | -100.00 | 0 | -100.00 | ||||
| 2025-08-14 | 13F | Raymond James Financial Inc | 10,283 | -97.43 | 871 | -97.30 | ||||
| 2025-07-10 | 13F | Family Legacy Financial Solutions, LLC | 60 | 5 | ||||||
| 2025-08-14 | 13F | Comerica Bank | 268 | 0.00 | 23 | 4.76 | ||||
| 2025-08-15 | 13F | Morgan Stanley | 163,931 | 27.92 | 13,890 | 34.18 | ||||
| 2025-05-15 | 13F | Polymer Capital Management (HK) LTD | 0 | -100.00 | 0 | |||||
| 2025-07-22 | 13F | Miracle Mile Advisors, LLC | 0 | -100.00 | 0 | |||||
| 2025-07-30 | NP | ENDW - Cambria Endowment Style ETF | 318 | 29 | ||||||
| 2025-04-22 | 13F | Channing Global Advisors, Llc | 0 | -100.00 | 0 | |||||
| 2025-08-07 | 13F | Laffer Investments | 2,571 | 218 | ||||||
| 2025-08-14 | 13F | Schonfeld Strategic Advisors LLC | Put | 0 | -100.00 | 0 | ||||
| 2025-07-11 | 13F | Farther Finance Advisors, LLC | 33 | 0.00 | 3 | 0.00 | ||||
| 2025-08-11 | 13F | Rothschild Investment Llc | 200 | 0.00 | 17 | 0.00 | ||||
| 2025-08-12 | 13F | Steward Partners Investment Advisory, Llc | 1,091 | 60.68 | 92 | 70.37 | ||||
| 2025-08-14 | 13F | Citadel Advisors Llc | 45,224 | -57.36 | 3,832 | -55.27 | ||||
| 2025-08-14 | 13F | Jane Street Group, Llc | 76,170 | 48.94 | 6,454 | 56.25 | ||||
| 2025-08-14 | 13F | CIBC World Markets Inc. | 3,568 | 16.60 | 302 | 22.27 | ||||
| 2025-08-14 | 13F | Citadel Advisors Llc | Put | 31,000 | -29.22 | 2,627 | -25.76 | |||
| 2025-08-08 | 13F | Glaxis Capital Management, LLC | 30,000 | 2,542 | ||||||
| 2025-07-15 | 13F | Optima Capital Llc | 7,327 | 11.27 | 621 | 16.95 | ||||
| 2025-08-11 | 13F | Principal Securities, Inc. | 249 | -21.94 | 21 | -19.23 | ||||
| 2025-08-14 | 13F | Susquehanna International Group, Llp | Put | 11,400 | -89.71 | 966 | -89.22 | |||
| 2025-07-14 | 13F | Ridgewood Investments LLC | 600 | 0.00 | 51 | 4.17 | ||||
| 2025-08-14 | 13F | Susquehanna International Group, Llp | 66,625 | -22.31 | 5,645 | -18.50 | ||||
| 2025-04-14 | 13F | Wedmont Private Capital | 0 | -100.00 | 0 | |||||
| 2025-08-14 | 13F | Riggs Asset Managment Co. Inc. | 1,309 | 1,977.78 | 111 | 2,100.00 | ||||
| 2025-08-13 | 13F | Colonial Trust Co / SC | 0 | -100.00 | 0 | |||||
| 2025-08-13 | 13F | Federated Hermes, Inc. | 0 | -100.00 | 0 | |||||
| 2025-08-11 | 13F | Parametrica Management Ltd | 5,400 | 0.00 | 458 | 4.82 | ||||
| 2025-04-29 | 13F | Pensionmark Financial Group, Llc | 0 | -100.00 | 0 | |||||
| 2025-07-30 | 13F | Whittier Trust Co | 2,477 | 0.00 | 210 | 4.50 | ||||
| 2025-04-24 | 13F | Wright Fund Managment, LLC | 0 | -100.00 | 0 | |||||
| 2025-08-14 | 13F | Susquehanna International Group, Llp | Call | 121,900 | 104.19 | 10,329 | 114.23 | |||
| 2025-08-14 | 13F | Group One Trading, L.p. | 1,681 | 740.50 | 142 | 787.50 | ||||
| 2025-08-14 | 13F | Aprio Wealth Management, LLC | 6,000 | 3.00 | 508 | 8.09 | ||||
| 2025-08-14 | 13F | Bnp Paribas Arbitrage, Sa | 3,206 | -19.99 | 272 | -16.10 | ||||
| 2025-04-22 | 13F | Jfs Wealth Advisors, Llc | 0 | -100.00 | 0 | |||||
| 2025-08-07 | 13F | Encompass More Asset Management | 19,892 | 1,685 | ||||||
| 2025-07-10 | 13F | Rfg Holdings, Inc. | 27,755 | 2.16 | 2,352 | 7.16 | ||||
| 2025-08-13 | 13F | Northwestern Mutual Wealth Management Co | 0 | -100.00 | 0 | |||||
| 2025-08-13 | 13F | Flow Traders U.s. Llc | 69,866 | 6 | ||||||
| 2025-08-14 | 13F | Wells Fargo & Company/mn | 296 | -99.64 | 25 | -99.62 | ||||
| 2025-07-23 | 13F | Clear Creek Financial Management, LLC | 19,453 | 15.46 | 1,648 | 21.18 | ||||
| 2025-08-13 | 13F | Capital Analysts, Inc. | 0 | -100.00 | 0 | |||||
| 2025-08-14 | 13F | Blue Capital, Inc. | 0 | -100.00 | 0 | |||||
| 2025-08-13 | 13F | StoneX Group Inc. | 0 | -100.00 | 0 | -100.00 | ||||
| 2025-07-30 | 13F | Brookstone Capital Management | 6,223 | 1.63 | 527 | 6.68 | ||||
| 2025-07-24 | 13F | Verde Servicos Internacionais S.A. | 0 | -100.00 | 0 | |||||
| 2025-08-14 | 13F | Federation des caisses Desjardins du Quebec | 280 | 24 | ||||||
| 2025-07-09 | 13F | Fiduciary Alliance LLC | 23,420 | 28.53 | 1,984 | 34.87 | ||||
| 2025-08-13 | 13F | EverSource Wealth Advisors, LLC | 2 | 0 | ||||||
| 2025-07-29 | 13F | Private Trust Co Na | 399 | 0.00 | 34 | 3.13 | ||||
| 2025-08-04 | 13F | Spire Wealth Management | 4,593 | 83.57 | 418 | 106.93 | ||||
| 2025-07-01 | 13F | Harbor Investment Advisory, Llc | 250 | -83.33 | 21 | -82.64 | ||||
| 2025-08-14 | 13F | Banque Transatlantique SA | 0 | -100.00 | 0 | |||||
| 2025-06-27 | NP | GIAX - Nicholas Global Equity and Income ETF | 24,519 | -4.80 | 2,101 | -5.66 | ||||
| 2025-08-15 | 13F | Kestra Advisory Services, LLC | 0 | -100.00 | 0 | |||||
| 2025-08-14 | 13F | Sona Asset Management (us) Llc | 27,000 | -28.00 | 2,288 | -24.47 | ||||
| 2025-05-12 | 13F | Independent Advisor Alliance | 0 | -100.00 | 0 |