Mga Batayang Estadistika
| Pemilik Institusional | 220 total, 217 long only, 0 short only, 3 long/short - change of -4.76% MRQ |
| Alokasi Portofolio Rata-rata | 0.1461 % - change of 3.66% MRQ |
| Saham Institusional (Jangka Panjang) | 49,811,538 (ex 13D/G) - change of 0.91MM shares 1.87% MRQ |
| Nilai Institusional (Jangka Panjang) | $ 425,001 USD ($1000) |
Kepemilikan Institusional dan Pemegang Saham
Barings BDC, Inc. (US:BBDC) memiliki 220 pemilik institusional dan pemegang saham yang telah mengajukan formulir 13D/G atau 13F kepada Komisi Bursa Efek (Securities Exchange Commission/SEC). Lembaga-lembaga ini memegang total 49,811,538 saham. Pemegang saham terbesar meliputi Barings Llc, Ares Management Llc, Private Management Group Inc, Van Eck Associates Corp, BIZD - VanEck Vectors BDC Income ETF, Cresset Asset Management, LLC, UBS Group AG, Invesco Ltd., Two Sigma Advisers, Lp, and Kovitz Investment Group Partners, LLC .
Struktur kepemilikan institusional Barings BDC, Inc. (NYSE:BBDC) menunjukkan posisi terkini di perusahaan oleh institusi dan dana, serta perubahan terbaru dalam ukuran posisi. Pemegang saham utama dapat mencakup investor individu, reksa dana, dana lindung nilai, atau institusi. Jadwal 13D menunjukkan bahwa investor memegang (atau pernah memegang) lebih dari 5% saham perusahaan dan bermaksud (atau pernah bermaksud) untuk secara aktif mengejar perubahan strategi bisnis. Jadwal 13G menunjukkan investasi pasif lebih dari 5%.
The share price as of September 5, 2025 is 9.39 / share. Previously, on September 9, 2024, the share price was 9.72 / share. This represents a decline of 3.40% over that period.

Skor Sentimen Dana
Skor Sentimen Dana (sebelumnya dikenal sebagai Skor Akumulasi Kepemilikan) menemukan saham-saham yang paling banyak dibeli oleh dana. Ini adalah hasil dari model kuantitatif multi-faktor yang canggih yang mengidentifikasi perusahaan dengan tingkat akumulasi institusional tertinggi. Model penilaian menggunakan kombinasi dari total peningkatan pemilik yang diungkapkan, perubahan dalam alokasi portofolio pada pemilik tersebut, dan metrik lainnya. Angka berkisar dari 0 hingga 100, dengan angka yang lebih tinggi menunjukkan tingkat akumulasi yang lebih tinggi dibandingkan dengan perusahaan sejenisnya, dan 50 adalah rata-ratanya.
Frekuensi Pembaruan: Setiap Hari
Lihat Ownership Explorer, yang menyediakan daftar perusahaan dengan peringkat tertinggi.
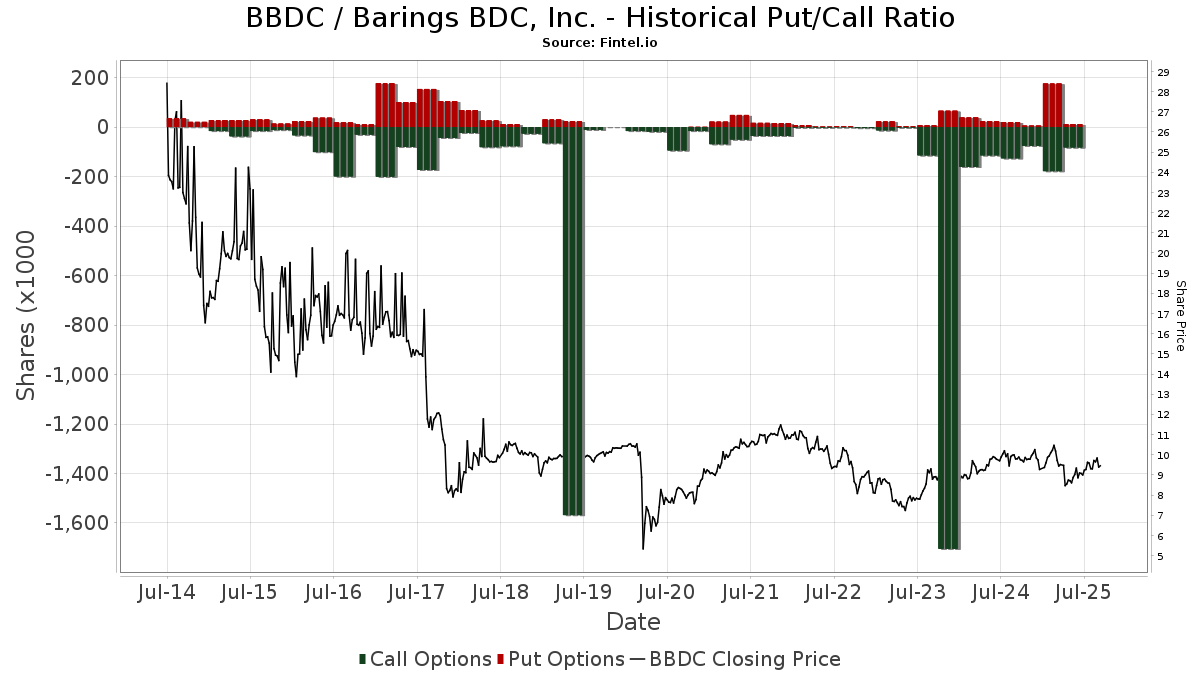
Rasio Put/Call Institusional
Selain melaporkan isu ekuitas dan utang standar, institusi dengan aset di bawah manajemen lebih dari 100 juta dolar AS juga harus mengungkapkan kepemilikan opsi put dan call mereka. Karena opsi put umumnya menunjukkan sentimen negatif, dan opsi call menunjukkan sentimen positif, kita dapat mengetahui sentimen institusional secara keseluruhan dengan memplot rasio put terhadap call. Grafik di sebelah kanan memplot rasio put/call historis untuk instrumen ini.
Menggunakan Rasio Put/Call sebagai indikator sentimen investor mengatasi salah satu kekurangan utama dari penggunaan total kepemilikan institusional, yaitu sejumlah besar aset yang dikelola diinvestasikan secara pasif untuk melacak indeks. Dana yang dikelola secara pasif biasanya tidak membeli opsi, sehingga indikator rasio put/call lebih akurat dalam melacak sentimen dana yang dikelola secara aktif.
Pengajuan 13F dan NPORT
Detail pada pengajuan 13F tersedia gratis. Detail pada pengajuan NP memerlukan keanggotaan premium. Baris berwarna hijau menunjukkan posisi baru. Baris berwarna merah menunjukkan posisi yang sudah ditutup. Klik tautan ini ikon untuk melihat riwayat transaksi selengkapnya.
Tingkatkan
untuk membuka data premium dan mengekspor ke Excel ![]() .
.
| Tanggal File | Sumber | Investor | Ketik | Presyo ng Avg (Silangan) |
Saham | Δ Saham (%) |
Dilaporkan Nilai ($1000) |
Nilai Δ (%) |
Alokasi Port (%) |
|
|---|---|---|---|---|---|---|---|---|---|---|
| 2025-07-10 | 13F | Wealth Enhancement Advisory Services, Llc | 156,268 | 2.58 | 1,450 | -0.21 | ||||
| 2025-07-18 | 13F | Founders Capital Management | 979 | 0.00 | 9 | -11.11 | ||||
| 2025-08-12 | 13F | Proequities, Inc. | Put | 0 | 0 | |||||
| 2025-07-24 | 13F | Us Bancorp \de\ | 151 | -34.91 | 1 | -50.00 | ||||
| 2025-08-12 | 13F | Proequities, Inc. | Call | 0 | 0 | |||||
| 2025-08-12 | 13F | Proequities, Inc. | 0 | 0 | ||||||
| 2025-07-31 | 13F | Brinker Capital Investments, LLC | 0 | -100.00 | 0 | |||||
| 2025-08-11 | 13F | Nomura Asset Management Co Ltd | 2,260 | -49.26 | 21 | -52.38 | ||||
| 2025-07-21 | 13F | Ameritas Advisory Services, LLC | 1,930 | 18 | ||||||
| 2025-08-05 | 13F | Huntington National Bank | 1 | 0.00 | 0 | |||||
| 2025-08-05 | 13F | GHP Investment Advisors, Inc. | 2,285 | 2.84 | 21 | -4.76 | ||||
| 2025-08-08 | 13F | Creative Planning | 27,943 | 0.94 | 255 | -3.41 | ||||
| 2025-07-30 | 13F | Green Square Capital Advisors Llc | 359,280 | 487.46 | 3,284 | 463.12 | ||||
| 2025-08-11 | 13F | Western Wealth Management, LLC | 16,905 | 0.00 | 155 | -4.35 | ||||
| 2025-08-14 | 13F | Cooperman Leon G | 0 | -100.00 | 0 | |||||
| 2025-08-14 | 13F | Susquehanna International Group, Llp | Call | 17,000 | -81.32 | 155 | -82.14 | |||
| 2025-08-14 | 13F | Van Eck Associates Corp | 2,343,401 | 7.81 | 21 | 5.00 | ||||
| 2025-08-08 | 13F | Financial Gravity Companies, Inc. | 306,055 | 1.01 | 2,797 | -3.52 | ||||
| 2025-07-10 | 13F | Focus Financial Network, Inc. | 14,672 | -0.78 | 134 | -4.96 | ||||
| 2025-07-31 | 13F | Cambridge Investment Research Advisors, Inc. | 217,821 | 5.15 | 2 | 0.00 | ||||
| 2025-07-07 | 13F | Bangor Savings Bank | 1,000 | 9 | ||||||
| 2025-08-12 | 13F | Barings Llc | 13,639,681 | 0.00 | 124,667 | -4.19 | ||||
| 2025-08-04 | 13F | AlphaStar Capital Management, LLC | 12,208 | 0.07 | 112 | -4.31 | ||||
| 2025-04-14 | 13F | Harbor Capital Advisors, Inc. | 0 | -100.00 | 0 | -100.00 | ||||
| 2025-08-14 | 13F | Two Sigma Investments, Lp | 562,562 | -23.18 | 5,142 | -26.41 | ||||
| 2025-08-05 | 13F | Westside Investment Management, Inc. | 680 | 6 | ||||||
| 2025-08-14 | 13F | Bulldog Investors, LLP | 210,501 | 1,924 | ||||||
| 2025-07-17 | 13F | Raleigh Capital Management Inc. | 32,785 | 0.32 | 300 | -3.86 | ||||
| 2025-08-12 | 13F | Legal & General Group Plc | 716,611 | 3.37 | 6,553 | -0.76 | ||||
| 2025-07-11 | 13F | Caldwell Securities, Inc | 1,958 | 0.00 | 18 | -5.56 | ||||
| 2025-08-14 | 13F | Oxford Asset Management Llp | 0 | -100.00 | 0 | -100.00 | ||||
| 2025-08-12 | 13F | Franklin Resources Inc | 826,659 | 18.10 | 7,556 | 13.15 | ||||
| 2025-07-10 | 13F | Capital Advisory Group Advisory Services, LLC | 16,800 | 3.70 | 154 | -0.65 | ||||
| 2025-09-04 | 13F/A | Advisor Group Holdings, Inc. | 336,307 | -3.69 | 3,076 | -7.69 | ||||
| 2025-05-15 | 13F | Talon Private Wealth, LLC | 0 | -100.00 | 0 | -100.00 | ||||
| 2025-07-16 | 13F | Eagle Global Advisors Llc | 34,295 | 22.61 | 313 | 17.67 | ||||
| 2025-08-13 | 13F | Cary Street Partners Financial Llc | 24,171 | 40.21 | 221 | 34.15 | ||||
| 2025-04-24 | 13F | Decker Retirement Planning Inc. | 0 | -100.00 | 0 | |||||
| 2025-08-14 | 13F | Susquehanna International Group, Llp | 0 | -100.00 | 0 | |||||
| 2025-08-14 | 13F | Fmr Llc | 86 | 0.00 | 1 | |||||
| 2025-08-14 | 13F | Group One Trading, L.p. | Call | 7,000 | -30.00 | 64 | -33.68 | |||
| 2025-08-14 | 13F | Susquehanna International Group, Llp | Put | 0 | -100.00 | 0 | ||||
| 2025-08-14 | 13F | Smartleaf Asset Management LLC | 0 | -100.00 | 0 | |||||
| 2025-06-18 | NP | Putnam ETF Trust - Putnam BDC ETF - | 759,809 | 54.46 | 6,618 | 32.92 | ||||
| 2025-08-04 | 13F | Muzinich & Co., Inc. | 291,373 | 10.83 | 2,663 | 6.18 | ||||
| 2025-07-28 | 13F | WealthPlan Investment Management, LLC | 0 | -100.00 | 0 | |||||
| 2025-08-13 | 13F | Virtus Investment Advisers, Inc. | 92,258 | 3.74 | 843 | -0.59 | ||||
| 2025-08-08 | 13F | Advyzon Investment Management, LLC | 13,759 | 126 | ||||||
| 2025-08-27 | NP | Special Opportunities Fund, Inc. | 11,631 | -94.34 | 106 | -94.45 | ||||
| 2025-05-08 | 13F | Gsa Capital Partners Llp | 0 | -100.00 | 0 | |||||
| 2025-03-28 | NP | ESCQX - Embark Small Cap Equity Fund Retirement Class | 611,714 | -19.12 | 6,191 | -15.36 | ||||
| 2025-08-11 | 13F | Mindset Wealth Management, Llc | 0 | -100.00 | 0 | |||||
| 2025-07-21 | 13F | Patriot Financial Group Insurance Agency, LLC | 21,895 | -53.02 | 200 | -54.95 | ||||
| 2025-07-15 | 13F | Mather Group, Llc. | 0 | -100.00 | 0 | |||||
| 2025-08-13 | 13F | Icon Advisers Inc/co | 0 | -100.00 | 0 | |||||
| 2025-08-13 | 13F | Lansforsakringar Fondforvaltning AB (publ) | 0 | -100.00 | 0 | |||||
| 2025-07-15 | 13F | North Star Investment Management Corp. | 640 | 0.00 | 6 | -16.67 | ||||
| 2025-08-12 | 13F | Running Point Capital Advisors, LLC | 10,000 | 91 | ||||||
| 2025-08-13 | 13F | Northern Trust Corp | 63,262 | 144.06 | 578 | 134.01 | ||||
| 2025-08-13 | 13F | Quadrature Capital Ltd | 0 | -100.00 | 0 | |||||
| 2025-08-14 | 13F | SWAN Capital LLC | 603 | 0.00 | 6 | 0.00 | ||||
| 2025-08-14 | 13F | Mariner, LLC | 29,363 | 7.58 | 268 | 3.08 | ||||
| 2025-08-12 | 13F | CIBC Private Wealth Group, LLC | 2,300 | 0.00 | 21 | 16.67 | ||||
| 2025-08-08 | 13F | Compass Wealth Management LLC | 0 | -100.00 | 0 | |||||
| 2025-07-25 | 13F | Apollon Wealth Management, LLC | 62,722 | 21.24 | 573 | 16.23 | ||||
| 2025-08-14 | 13F | TT Capital Management LLC | 234,692 | 2,078 | ||||||
| 2025-08-14 | 13F | UBS Group AG | 1,181,060 | 38.81 | 10,795 | 33.00 | ||||
| 2025-07-15 | 13F | Bfsg, Llc | 20,070 | 0.96 | 183 | -3.17 | ||||
| 2025-07-31 | 13F | Sumitomo Mitsui Trust Holdings, Inc. | 291,373 | 10.83 | 2,663 | 6.18 | ||||
| 2025-08-06 | 13F | Ethos Financial Group, LLC | 72,924 | 13.09 | 667 | 8.29 | ||||
| 2025-07-17 | 13F | Sound Income Strategies, LLC | 12,757 | 0.21 | 117 | -4.13 | ||||
| 2025-08-12 | 13F | Trexquant Investment LP | 289,844 | 97.01 | 2,649 | 88.81 | ||||
| 2025-08-12 | 13F | MAI Capital Management | 1,749 | 9.72 | 16 | 0.00 | ||||
| 2025-08-04 | 13F | Arkadios Wealth Advisors | 26,746 | 1.42 | 244 | -2.79 | ||||
| 2025-08-11 | 13F | Pineridge Advisors LLC | 0 | -100.00 | 0 | |||||
| 2025-08-07 | 13F | HighPoint Advisor Group LLC | 58,303 | 0.60 | 533 | 4.31 | ||||
| 2025-08-12 | 13F | Advisors Asset Management, Inc. | 413,259 | 3.50 | 3,777 | -0.84 | ||||
| 2025-08-04 | 13F | Integrity Alliance, Llc. | 13,754 | -1.87 | 126 | -6.02 | ||||
| 2025-07-17 | 13F | Farmers & Merchants Trust Co of Long Beach | 18,087 | 1.37 | 165 | -2.94 | ||||
| 2025-08-14 | 13F | Rivernorth Capital Management, Llc | 411,254 | 3,759 | ||||||
| 2025-08-13 | 13F | Consultiva Wealth Management, Corp. | 3,000 | 0.00 | 27 | -3.57 | ||||
| 2025-07-22 | 13F | Global Assets Advisory, LLC | 0 | -100.00 | 0 | |||||
| 2025-08-04 | 13F | Spire Wealth Management | 11,324 | -2.83 | 104 | -7.21 | ||||
| 2025-08-15 | 13F | Morgan Stanley | 861,363 | -10.47 | 7,873 | -14.23 | ||||
| 2025-08-06 | 13F | Commonwealth Equity Services, Llc | 55,848 | -9.54 | 1 | |||||
| 2025-08-14 | 13F | Citadel Advisors Llc | Call | 40,800 | -27.79 | 373 | -30.98 | |||
| 2025-08-14 | 13F | Citadel Advisors Llc | Put | 10,300 | -89.65 | 94 | -90.09 | |||
| 2025-08-14 | 13F | Warren Averett Asset Management, LLC | 44,283 | -4.04 | 405 | -8.18 | ||||
| 2025-08-14 | 13F | Cubist Systematic Strategies, LLC | 0 | -100.00 | 0 | |||||
| 2025-06-25 | NP | VPC - Virtus Private Credit Strategy ETF | 81,237 | -9.99 | 708 | -22.56 | ||||
| 2025-08-13 | 13F | Mackenzie Financial Corp | 0 | -100.00 | 0 | |||||
| 2025-03-12 | 13F | Centaurus Financial, Inc. | 0 | -100.00 | 0 | |||||
| 2025-07-16 | 13F | Essex Financial Services, Inc. | 26,320 | 0.11 | 241 | -4.00 | ||||
| 2025-08-14 | 13F | BI Asset Management Fondsmaeglerselskab A/S | 439,346 | 17.91 | 4 | 33.33 | ||||
| 2025-07-24 | 13F | Costello Asset Management, INC | 100 | 0.00 | 1 | |||||
| 2025-07-29 | 13F | Stephens Inc /ar/ | 23,035 | 0.78 | 211 | -3.67 | ||||
| 2025-08-13 | 13F | Cliffwater LLC | 126,753 | 0.00 | 1,159 | -4.22 | ||||
| 2025-07-29 | 13F | Harbor Asset Planning, Inc. | 1,000 | 9 | ||||||
| 2025-08-13 | 13F | Northwestern Mutual Wealth Management Co | 2,918 | 3.40 | 27 | 0.00 | ||||
| 2025-05-12 | 13F | Connor, Clark & Lunn Investment Management Ltd. | 0 | -100.00 | 0 | |||||
| 2025-08-06 | 13F | Founders Financial Securities Llc | 19,243 | -9.47 | 176 | -6.91 | ||||
| 2025-08-12 | 13F | Change Path, LLC | 34,696 | 3.36 | 317 | -0.94 | ||||
| 2025-08-12 | 13F | Jpmorgan Chase & Co | 116,149 | -23.28 | 1,062 | -26.52 | ||||
| 2025-08-15 | 13F | WFA of San Diego, LLC | 1,400 | 13 | ||||||
| 2025-08-12 | 13F | Armor Investment Advisors, LLC | 18,800 | 15.34 | 172 | 10.32 | ||||
| 2025-04-30 | 13F | Sofos Investments, Inc. | 301,719 | 4,289.92 | 2,878 | 4,260.61 | ||||
| 2025-07-28 | 13F | Rosenberg Matthew Hamilton | 0 | -100.00 | 0 | |||||
| 2025-07-28 | 13F | Harbour Investments, Inc. | 335 | 0.00 | 3 | 0.00 | ||||
| 2025-08-13 | 13F | Marshall Wace, Llp | 42,529 | -57.23 | 389 | -59.07 | ||||
| 2025-08-14 | 13F | Wells Fargo & Company/mn | 838,365 | 2.85 | 7,663 | -1.47 | ||||
| 2025-08-11 | 13F | HighTower Advisors, LLC | 140,788 | 0.00 | 1,287 | -4.24 | ||||
| 2025-08-15 | 13F | Kestra Advisory Services, LLC | 73,670 | 23.76 | 673 | 18.69 | ||||
| 2025-08-01 | 13F | Envestnet Asset Management Inc | 29,696 | -13.03 | 271 | -16.62 | ||||
| 2025-08-13 | 13F | Invesco Ltd. | 1,120,093 | 1.30 | 10,238 | -2.95 | ||||
| 2025-05-30 | NP | IOBAX - ICON FLEXIBLE BOND FUND Investor Class | 102,951 | -61.77 | 982 | -61.89 | ||||
| 2025-07-23 | 13F | Prime Capital Investment Advisors, LLC | 62,165 | -12.61 | 568 | -16.22 | ||||
| 2025-07-18 | 13F | Northeast Financial Group, Inc. | 14,686 | 134 | ||||||
| 2025-08-15 | 13F | Caxton Associates Llp | 22,596 | 0.00 | 207 | -4.19 | ||||
| 2025-08-14 | 13F | Group One Trading, L.p. | Put | 400 | -94.20 | 4 | -95.38 | |||
| 2025-08-01 | 13F | Y-Intercept (Hong Kong) Ltd | 142,749 | 1,305 | ||||||
| 2025-05-16 | 13F | Dynamic Technology Lab Private Ltd | 0 | -100.00 | 0 | |||||
| 2025-07-08 | 13F | Parallel Advisors, LLC | 1,456 | -5.45 | 13 | -7.14 | ||||
| 2025-07-11 | 13F | Seacrest Wealth Management, Llc | 15,438 | -20.48 | 141 | -23.78 | ||||
| 2025-08-14 | 13F | Royal Bank Of Canada | 60,673 | 63.47 | 555 | 56.78 | ||||
| 2025-08-14 | 13F | RMB Capital Management, LLC | 31,772 | 8.17 | 290 | 3.57 | ||||
| 2025-05-28 | NP | LUSIX - Lazard US Systematic Small Cap Equity Portfolio Institutional Shares | 9,732 | -11.97 | 93 | -12.38 | ||||
| 2025-04-01 | NP | PSP - Invesco Global Listed Private Equity ETF This fund is a listed as child fund of Invesco Ltd. and if that institution has disclosed ownership in this security, then these positions will not be double counted when calculating total shares and total value | 76,637 | 25.82 | 776 | 31.80 | ||||
| 2025-04-29 | 13F | Lee Danner & Bass Inc | 0 | -100.00 | 0 | |||||
| 2025-05-07 | 13F | Foundations Investment Advisors, LLC | 0 | -100.00 | 0 | |||||
| 2025-08-25 | 13F/A | Neuberger Berman Group LLC | 240,317 | 10.94 | 2,196 | 6.29 | ||||
| 2025-08-11 | 13F | Empowered Funds, LLC | 12,615 | -8.33 | 115 | -12.21 | ||||
| 2025-07-28 | NP | PEX - ProShares Global Listed Private Equity ETF | 19,962 | 1.18 | 186 | -9.76 | ||||
| 2025-05-05 | 13F | Lindbrook Capital, Llc | 1,119 | 28.33 | 11 | 25.00 | ||||
| 2025-07-11 | 13F | Farther Finance Advisors, LLC | 0 | -100.00 | 0 | |||||
| 2025-04-21 | 13F | Ronald Blue Trust, Inc. | 0 | -100.00 | 0 | |||||
| 2025-05-15 | 13F | Punch & Associates Investment Management, Inc. | 0 | -100.00 | 0 | |||||
| 2025-07-25 | NP | First Trust Specialty Finance & Financial Opportunities Fund This fund is a listed as child fund of First Trust Advisors Lp and if that institution has disclosed ownership in this security, then these positions will not be double counted when calculating total shares and total value | 290,000 | -25.64 | 2,700 | -33.57 | ||||
| 2025-07-07 | 13F | Salem Investment Counselors Inc | 0 | -100.00 | 0 | |||||
| 2025-08-14 | 13F | Qube Research & Technologies Ltd | 0 | -100.00 | 0 | |||||
| 2025-08-14 | 13F | Ameriprise Financial Inc | 29,669 | 7.62 | 271 | 3.04 | ||||
| 2025-08-07 | 13F | Allworth Financial LP | 16,372 | 1.44 | 150 | 4.93 | ||||
| 2025-08-18 | 13F | Geneos Wealth Management Inc. | 19,142 | -12.86 | 175 | -16.75 | ||||
| 2025-08-13 | 13F | Lido Advisors, LLC | 55,447 | -16.40 | 507 | -19.94 | ||||
| 2025-08-14 | 13F | Millennium Management Llc | 0 | -100.00 | 0 | |||||
| 2025-08-15 | 13F | Great West Life Assurance Co /can/ | 89,210 | -2.09 | 1 | |||||
| 2025-08-12 | 13F | Virtu Financial LLC | 23,488 | -47.61 | 0 | |||||
| 2025-08-13 | 13F | Skandinaviska Enskilda Banken AB (publ) | 239,440 | 0.00 | 2,188 | -4.20 | ||||
| 2025-08-14 | 13F | Two Sigma Advisers, Lp | 1,089,200 | -16.72 | 9,955 | -20.21 | ||||
| 2025-07-28 | NP | KBWD - Invesco KBW High Dividend Yield Financial ETF This fund is a listed as child fund of Invesco Ltd. and if that institution has disclosed ownership in this security, then these positions will not be double counted when calculating total shares and total value | 1,034,412 | 3.46 | 9,630 | -7.55 | ||||
| 2025-08-13 | 13F | De Lisle Partners LLP | 15,305 | 0.00 | 140 | -4.79 | ||||
| 2025-08-14 | 13F | Raymond James Financial Inc | 337,247 | 4.26 | 3,082 | -0.10 | ||||
| 2025-08-13 | 13F | Guggenheim Capital Llc | 16,444 | -0.50 | 150 | -4.46 | ||||
| 2025-07-22 | 13F/A | Kingstone Capital Partners Texas, LLC | 16,933 | 13.87 | 155 | 9.15 | ||||
| 2025-07-18 | 13F | Consolidated Portfolio Review Corp | 20,556 | -3.77 | 188 | -7.88 | ||||
| 2025-08-05 | 13F | Hutchens & Kramer Investment Management Group, LLC | 0 | -100.00 | 0 | |||||
| 2025-07-25 | 13F | Cwm, Llc | 11,261 | -10.02 | 0 | |||||
| 2025-08-11 | 13F | Lsv Asset Management | 36,100 | 0.00 | 0 | |||||
| 2025-08-14 | 13F | Verition Fund Management LLC | 38,600 | -23.13 | 353 | -26.51 | ||||
| 2025-08-08 | 13F | ERTS Wealth Advisors, LLC | 0 | -100.00 | 0 | |||||
| 2025-08-14 | 13F | Redwood Financial Network Corp | 16,362 | 0.00 | 150 | -4.49 | ||||
| 2025-07-16 | 13F | Signaturefd, Llc | 7,122 | -28.64 | 65 | -31.58 | ||||
| 2025-08-08 | 13F | Pnc Financial Services Group, Inc. | 759 | 7 | ||||||
| 2025-08-14 | 13F | Mml Investors Services, Llc | 74,970 | 35.49 | 1 | |||||
| 2025-08-14 | 13F | Dimension Capital Management Llc | 584,931 | 8.29 | 5,346 | 3.75 | ||||
| 2025-04-21 | 13F | Nelson, Van Denburg & Campbell Wealth Management Group, LLC | 0 | -100.00 | 0 | |||||
| 2025-08-07 | 13F | Campbell & CO Investment Adviser LLC | 58,776 | 206.09 | 537 | 193.44 | ||||
| 2025-05-15 | 13F | Aquatic Capital Management LLC | 0 | -100.00 | 0 | |||||
| 2025-08-14 | 13F | Ausdal Financial Partners, Inc. | 29,403 | 5.03 | 269 | 0.37 | ||||
| 2025-07-29 | NP | Putnam High Income Securities Fund | 125,637 | -38.27 | 1,170 | -41.37 | ||||
| 2025-08-07 | 13F | PFG Advisors | 12,528 | 115 | ||||||
| 2025-08-14 | 13F | Gotham Asset Management, LLC | 25,000 | 0.00 | 228 | -4.20 | ||||
| 2025-08-14 | 13F | Arete Wealth Advisors, LLC | 36,725 | 0.65 | 0 | |||||
| 2025-08-14 | 13F | Ares Management Llc | 3,797,112 | 5.27 | 34,706 | 0.85 | ||||
| 2025-07-23 | 13F | Citizens National Bank Trust Department | 879 | 0.00 | 8 | 0.00 | ||||
| 2025-07-30 | 13F | Crewe Advisors LLC | 630 | 0.00 | 6 | -16.67 | ||||
| 2025-08-14 | 13F | Mercer Global Advisors Inc /adv | 41,642 | 291.11 | 381 | 276.24 | ||||
| 2025-08-14 | 13F | Sunbelt Securities, Inc. | 52,883 | 8.29 | 506 | 8.82 | ||||
| 2025-05-14 | 13F | Virtus ETF Advisers LLC | 0 | -100.00 | 0 | |||||
| 2025-08-14 | 13F | Kovitz Investment Group Partners, LLC | 1,040,546 | -3.04 | 9,509 | -7.12 | ||||
| 2025-08-12 | 13F | Global Retirement Partners, LLC | 12,964 | 0.00 | 118 | -4.84 | ||||
| 2025-07-21 | 13F | Ameriflex Group, Inc. | 4,091 | -50.18 | 38 | -52.56 | ||||
| 2025-07-18 | 13F | PFG Investments, LLC | 17,044 | 1.27 | 156 | -3.12 | ||||
| 2025-07-31 | 13F | Nilsine Partners, LLC | 90,011 | 823 | ||||||
| 2025-08-14 | 13F | Jane Street Group, Llc | 0 | -100.00 | 0 | |||||
| 2025-07-31 | 13F | MQS Management LLC | 0 | -100.00 | 0 | |||||
| 2025-08-05 | 13F | Simplex Trading, Llc | 0 | -100.00 | 0 | |||||
| 2025-08-14 | 13F | Price T Rowe Associates Inc /md/ | 0 | -100.00 | 0 | |||||
| 2025-08-13 | 13F | OMERS ADMINISTRATION Corp | 0 | -100.00 | 0 | |||||
| 2025-08-07 | 13F | Resources Investment Advisors, LLC. | 32,569 | 188.86 | 298 | 177.57 | ||||
| 2025-08-14 | 13F | Comerica Bank | 238 | 0.00 | 2 | 0.00 | ||||
| 2025-08-29 | 13F | Total Investment Management Inc | 870 | 8 | ||||||
| 2025-08-13 | 13F | Brown Advisory Inc | 13,200 | 0.00 | 121 | -4.00 | ||||
| 2025-08-13 | 13F | Callodine Capital Management, LP | 284,024 | -5.33 | 2,596 | -9.33 | ||||
| 2025-08-11 | 13F | Citigroup Inc | 38,908 | 231.02 | 356 | 216.96 | ||||
| 2025-08-07 | 13F | ProShare Advisors LLC | 18,771 | -5.70 | 172 | -9.52 | ||||
| 2025-07-01 | 13F | Confluence Investment Management Llc | 422,892 | -18.64 | 3,865 | -22.05 | ||||
| 2025-08-14 | 13F | Stifel Financial Corp | 43,423 | -17.40 | 397 | -20.96 | ||||
| 2025-07-31 | 13F | Caitong International Asset Management Co., Ltd | 154 | 1 | ||||||
| 2025-08-08 | 13F | Avantax Advisory Services, Inc. | 17,116 | 3.05 | 156 | -1.27 | ||||
| 2025-07-29 | 13F | Private Trust Co Na | 1,163 | 0.00 | 11 | -9.09 | ||||
| 2025-08-12 | 13F/A | Cozad Asset Management Inc | 15,874 | 0.00 | 145 | -3.97 | ||||
| 2025-08-13 | 13F | Quantbot Technologies LP | 25,792 | 236 | ||||||
| 2025-08-14 | 13F | Tudor Investment Corp Et Al | 405,104 | -14.33 | 3,703 | -17.93 | ||||
| 2025-08-04 | 13F | Kovack Advisors, Inc. | 15,519 | 0.73 | 142 | -3.42 | ||||
| 2025-08-15 | 13F | Tower Research Capital LLC (TRC) | 1,082 | -12.25 | 10 | -18.18 | ||||
| 2025-08-14 | 13F | GWM Advisors LLC | 2,193 | 0.00 | 20 | 0.00 | ||||
| 2025-07-14 | 13F | Sowell Financial Services LLC | 11,498 | -3.37 | 105 | -7.08 | ||||
| 2025-08-12 | 13F | Steward Partners Investment Advisory, Llc | 49,884 | -11.79 | 456 | -15.58 | ||||
| 2025-06-27 | NP | LBO - WHITEWOLF Publicly Listed Private Equity ETF | 13,761 | 14.28 | 120 | -1.65 | ||||
| 2025-08-08 | 13F | SBI Securities Co., Ltd. | 67 | 0.00 | 1 | |||||
| 2025-08-14 | 13F | Hrt Financial Lp | 0 | -100.00 | 0 | |||||
| 2025-08-21 | NP | BIZD - VanEck Vectors BDC Income ETF | 2,074,677 | 2.71 | 18,963 | -1.60 | ||||
| 2025-08-08 | 13F/A | Sterling Capital Management LLC | 2,394 | 22 | ||||||
| 2025-08-13 | 13F | Cresset Asset Management, LLC | 1,571,340 | -19.83 | 14,362 | -23.19 | ||||
| 2025-08-06 | 13F | Wedbush Securities Inc | 24,866 | -18.33 | 0 | |||||
| 2025-07-16 | 13F | Register Financial Advisors LLC | 12,231 | 0.44 | 112 | -4.31 | ||||
| 2025-07-03 | 13F | Garde Capital, Inc. | 190 | 0.00 | 2 | 0.00 | ||||
| 2025-08-28 | NP | Rivernorth Opportunities Fund, Inc. | 149,331 | 1,365 | ||||||
| 2025-08-01 | 13F | Cobblestone Capital Advisors Llc /ny/ | 14,315 | -12.07 | 131 | -16.13 | ||||
| 2025-08-08 | 13F | Cetera Investment Advisers | 82,171 | 8.85 | 751 | 4.31 | ||||
| 2025-07-31 | 13F | Jackson Hole Capital Partners, LLC | 12,055 | 0.00 | 110 | -4.35 | ||||
| 2025-08-12 | 13F | LPL Financial LLC | 280,711 | -4.64 | 2,566 | -8.65 | ||||
| 2025-08-14 | 13F | Lazard Asset Management Llc | 0 | -100.00 | 0 | |||||
| 2025-08-07 | 13F | Hennion & Walsh Asset Management, Inc. | 242,327 | -35.36 | 2,215 | -38.09 | ||||
| 2025-08-14 | 13F | Brevan Howard Capital Management LP | 24,263 | 53.60 | 222 | 47.33 | ||||
| 2025-08-04 | 13F | Creative Financial Designs Inc /adv | 12,790 | -14.18 | 117 | -18.31 | ||||
| 2025-08-13 | 13F/A | StoneX Group Inc. | 11,833 | 102 | ||||||
| 2025-08-05 | 13F | Bard Associates Inc | 67,319 | -0.81 | 615 | -4.95 | ||||
| 2025-08-14 | 13F | D. E. Shaw & Co., Inc. | 0 | -100.00 | 0 | |||||
| 2025-08-05 | 13F | Sigma Planning Corp | 29,155 | 5.80 | 266 | 1.53 | ||||
| 2025-08-06 | 13F | Nicholas Hoffman & Company, LLC. | 14,354 | 0.00 | 131 | -3.68 | ||||
| 2025-08-21 | NP | MOFTX - Mercer Opportunistic Fixed Income Fund Class I | 132,455 | 1,211 | ||||||
| 2025-08-12 | 13F | Entropy Technologies, LP | 10,583 | 97 | ||||||
| 2025-05-16 | 13F | Coppell Advisory Solutions LLC | 0 | -100.00 | 0 | |||||
| 2025-07-02 | 13F | Central Pacific Bank - Trust Division | 14,200 | 0.00 | 130 | -4.44 | ||||
| 2025-07-16 | 13F | Beaumont Financial Advisors, LLC | 16,588 | 3.39 | 152 | -1.31 | ||||
| 2025-07-30 | 13F | Brookstone Capital Management | 12,107 | 0.01 | 111 | -4.35 | ||||
| 2025-08-15 | 13F | CI Private Wealth, LLC | 0 | -100.00 | 0 | |||||
| 2025-07-16 | 13F | BOS Asset Management, LLC | 10,045 | 0.00 | 92 | -4.21 | ||||
| 2025-07-18 | 13F | Bartlett & Co. Wealth Management Llc | 3,000 | 0.00 | 27 | -3.57 | ||||
| 2025-08-14 | 13F | Bank Of America Corp /de/ | 476,325 | 1.80 | 4,354 | -2.46 | ||||
| 2025-08-14 | 13F | Mpwm Advisory Solutions, Llc | 4,240 | 39 | ||||||
| 2025-05-05 | 13F | Hollencrest Capital Management | 0 | -100.00 | 0 | -100.00 | ||||
| 2025-07-07 | 13F | Nova Wealth Management, Inc. | 4,550 | 0.00 | 42 | -4.65 | ||||
| 2025-08-28 | NP | RNCOX - RiverNorth Core Opportunity Fund Class R | 20,561 | -90.59 | 188 | -92.23 | ||||
| 2025-07-16 | 13F | Castleview Partners, Llc | 12,125 | -30.41 | 111 | -33.73 | ||||
| 2025-07-25 | 13F | Sequoia Financial Advisors, LLC | 30,826 | -5.57 | 282 | -9.65 | ||||
| 2025-08-12 | 13F | Financial Advocates Investment Management | 18,854 | 0.00 | 172 | -3.91 | ||||
| 2025-07-29 | 13F | Chicago Partners Investment Group LLC | 20,674 | -13.51 | 198 | -3.41 | ||||
| 2025-08-08 | 13F | Larson Financial Group LLC | 5,314 | -18.50 | 49 | -22.58 | ||||
| 2025-08-14 | 13F | Wealth Preservation Advisors, LLC | 0 | -100.00 | 0 | |||||
| 2025-07-23 | 13F | Kingswood Wealth Advisors, Llc | 0 | -100.00 | 0 | -100.00 | ||||
| 2025-07-30 | 13F | Bogart Wealth, LLC | 412 | 33.77 | 4 | 50.00 | ||||
| 2025-06-27 | NP | MYLD - Cambria Micro and SmallCap Shareholder Yield ETF | 11,269 | -60.56 | 98 | -66.09 | ||||
| 2025-07-30 | 13F | Caliber Wealth Management, LLC / KS | 210,592 | -12.66 | 1,925 | -16.35 | ||||
| 2025-08-12 | 13F | Private Management Group Inc | 3,156,257 | 1.93 | 28,848 | -2.34 | ||||
| 2025-08-14 | 13F | Wiley Bros.-aintree Capital, Llc | 100,086 | 2.07 | 915 | -2.97 | ||||
| 2025-07-29 | 13F | Koshinski Asset Management, Inc. | 43,977 | 0.84 | 402 | -3.61 | ||||
| 2025-08-07 | 13F | Panoramic Investment Advisors, Llc | 10,931 | -42.55 | 100 | -45.30 | ||||
| 2025-08-19 | 13F | Advisory Services Network, LLC | 11,966 | -14.32 | 111 | -17.29 | ||||
| 2025-07-22 | 13F | Merit Financial Group, LLC | 11,091 | 101 | ||||||
| 2025-08-06 | 13F | Golden State Wealth Management, LLC | 7,077 | 269.56 | 65 | 255.56 | ||||
| 2025-07-30 | 13F | Denali Advisors Llc | 134,504 | -2.64 | 1,229 | -6.68 | ||||
| 2025-08-08 | 13F | Bouchey Financial Group Ltd | 10,276 | 0.00 | 94 | -5.10 | ||||
| 2025-08-13 | 13F | Centiva Capital, LP | 0 | -100.00 | 0 | |||||
| 2025-08-13 | 13F | Cambria Investment Management, L.P. | 13,156 | 16.75 | 120 | 12.15 | ||||
| 2025-07-29 | 13F | Empirical Asset Management, LLC | 10,439 | 3.40 | 95 | -1.04 | ||||
| 2025-08-13 | 13F | Quadrant Capital Group Llc | 0 | -100.00 | 0 | |||||
| 2025-08-14 | 13F | Goldman Sachs Group Inc | 0 | -100.00 | 0 | |||||
| 2025-04-29 | 13F | Truist Financial Corp | 0 | -100.00 | 0 | |||||
| 2025-08-19 | 13F | Cape Investment Advisory, Inc. | 3,526 | -54.47 | 32 | -56.16 | ||||
| 2025-07-09 | 13F | Triumph Capital Management | 24,366 | 0.00 | 223 | -4.31 | ||||
| 2025-08-19 | 13F | Newbridge Financial Services Group, Inc. | 9,529 | -3.25 | 87 | -6.45 | ||||
| 2025-08-14 | 13F | Citadel Advisors Llc | 0 | -100.00 | 0 | |||||
| 2025-08-01 | 13F | First National Trust Co | 0 | -100.00 | 0 | |||||
| 2025-08-12 | 13F | Insigneo Advisory Services, Llc | 12,625 | 3.64 | 115 | -0.86 | ||||
| 2025-05-30 | NP | PRISX - T. Rowe Price Financial Services Fund, Inc. This fund is a listed as child fund of Price T Rowe Associates Inc /md/ and if that institution has disclosed ownership in this security, then these positions will not be double counted when calculating total shares and total value | 176,242 | -43.43 | 1,681 | -43.61 | ||||
| 2025-08-01 | 13F | Advisory Alpha, LLC | 11,069 | 2.31 | 101 | -1.94 | ||||
| 2025-08-05 | 13F | Simplex Trading, Llc | Put | 2,000 | -90.15 | 0 | ||||
| 2025-08-05 | 13F | Simplex Trading, Llc | Call | 17,200 | -18.48 | 0 | ||||
| 2025-08-28 | NP | Cliffwater Enhanced Lending Fund | 126,753 | 0.00 | 1,159 | -4.22 | ||||
| 2025-08-06 | 13F | Soltis Investment Advisors LLC | 13,592 | 3.39 | 124 | -0.80 | ||||
| 2025-08-12 | 13F | BlackRock, Inc. | 635,048 | 20.38 | 5,804 | 15.34 |