Mga Batayang Estadistika
| Pemilik Institusional | 239 total, 239 long only, 0 short only, 0 long/short - change of 5.73% MRQ |
| Alokasi Portofolio Rata-rata | 0.3810 % - change of -0.46% MRQ |
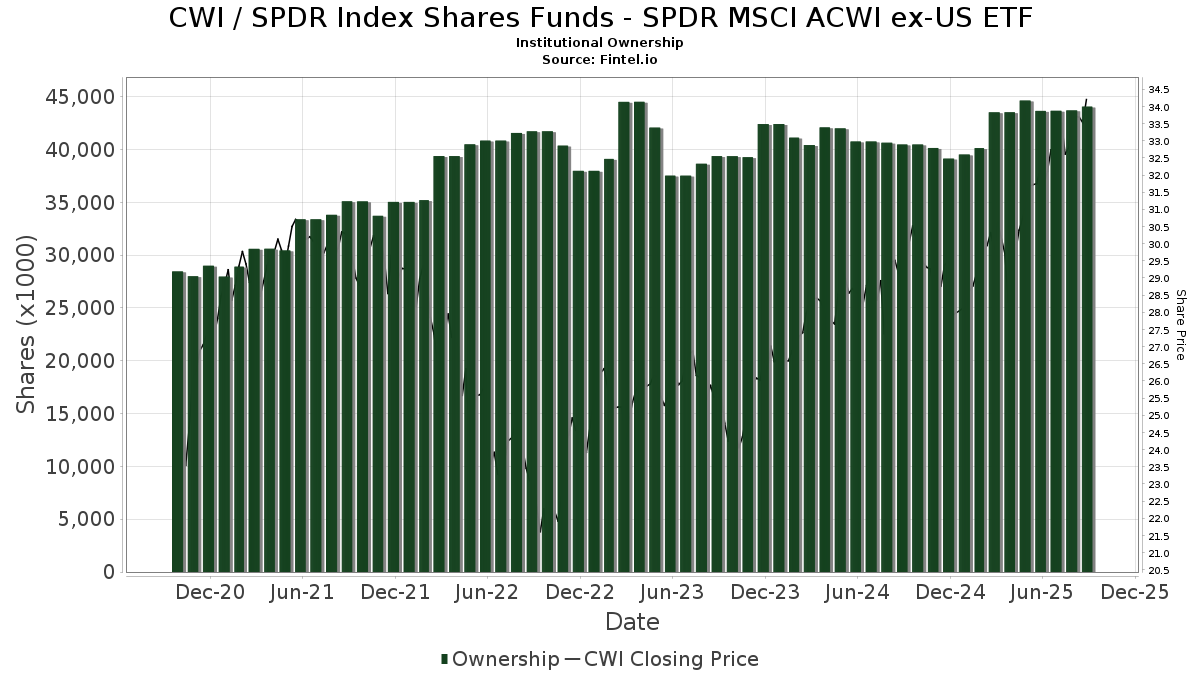
| Saham Institusional (Jangka Panjang) | 44,063,320 (ex 13D/G) - change of 0.40MM shares 0.93% MRQ |
| Nilai Institusional (Jangka Panjang) | $ 1,387,641 USD ($1000) |
Kepemilikan Institusional dan Pemegang Saham
SPDR Index Shares Funds - SPDR MSCI ACWI ex-US ETF (US:CWI) memiliki 239 pemilik institusional dan pemegang saham yang telah mengajukan formulir 13D/G atau 13F kepada Komisi Bursa Efek (Securities Exchange Commission/SEC). Lembaga-lembaga ini memegang total 44,063,320 saham. Pemegang saham terbesar meliputi Bank Of America Corp /de/, Pnc Financial Services Group, Inc., Avantax Planning Partners, Inc., HighTower Advisors, LLC, LPL Financial LLC, GLOBALT Investments LLC / GA, Cliftonlarsonallen Wealth Advisors, Llc, Hengehold Capital Management Llc, Lodestar Private Asset Management Llc, and Clal Insurance Enterprises Holdings Ltd .
Struktur kepemilikan institusional SPDR Index Shares Funds - SPDR MSCI ACWI ex-US ETF (ARCA:CWI) menunjukkan posisi terkini di perusahaan oleh institusi dan dana, serta perubahan terbaru dalam ukuran posisi. Pemegang saham utama dapat mencakup investor individu, reksa dana, dana lindung nilai, atau institusi. Jadwal 13D menunjukkan bahwa investor memegang (atau pernah memegang) lebih dari 5% saham perusahaan dan bermaksud (atau pernah bermaksud) untuk secara aktif mengejar perubahan strategi bisnis. Jadwal 13G menunjukkan investasi pasif lebih dari 5%.
The share price as of September 5, 2025 is 33.84 / share. Previously, on September 9, 2024, the share price was 28.89 / share. This represents an increase of 17.13% over that period.
Skor Sentimen Dana
Skor Sentimen Dana (sebelumnya dikenal sebagai Skor Akumulasi Kepemilikan) menemukan saham-saham yang paling banyak dibeli oleh dana. Ini adalah hasil dari model kuantitatif multi-faktor yang canggih yang mengidentifikasi perusahaan dengan tingkat akumulasi institusional tertinggi. Model penilaian menggunakan kombinasi dari total peningkatan pemilik yang diungkapkan, perubahan dalam alokasi portofolio pada pemilik tersebut, dan metrik lainnya. Angka berkisar dari 0 hingga 100, dengan angka yang lebih tinggi menunjukkan tingkat akumulasi yang lebih tinggi dibandingkan dengan perusahaan sejenisnya, dan 50 adalah rata-ratanya.
Frekuensi Pembaruan: Setiap Hari
Lihat Ownership Explorer, yang menyediakan daftar perusahaan dengan peringkat tertinggi.
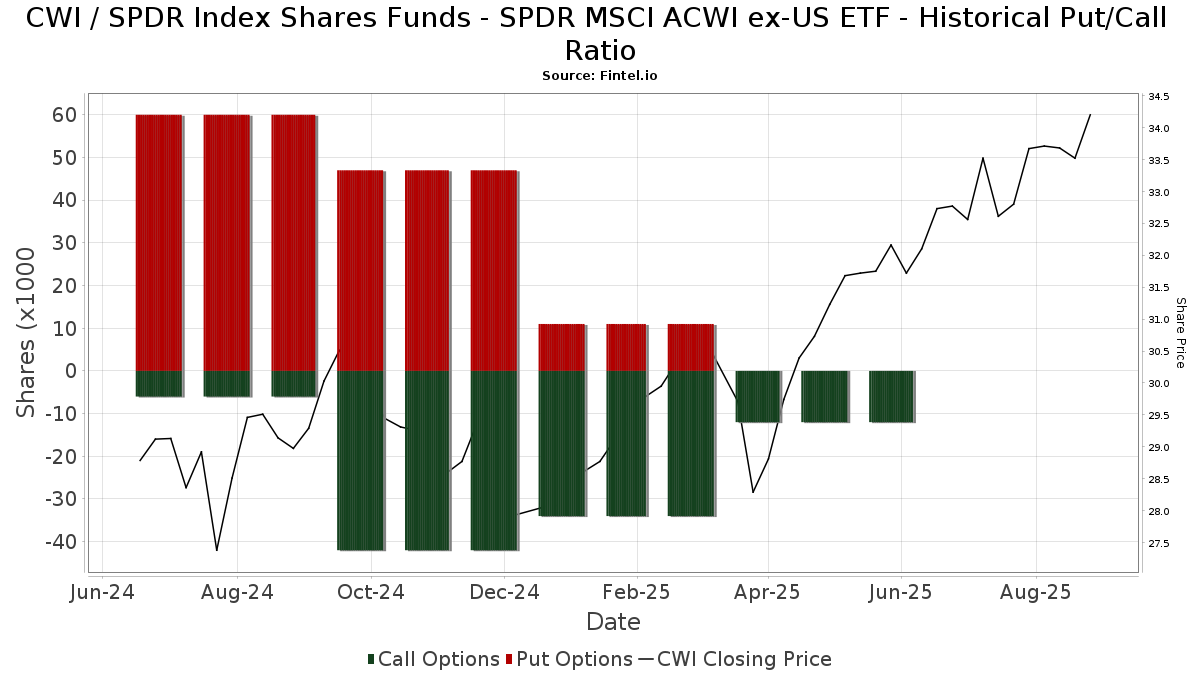
Rasio Put/Call Institusional
Selain melaporkan isu ekuitas dan utang standar, institusi dengan aset di bawah manajemen lebih dari 100 juta dolar AS juga harus mengungkapkan kepemilikan opsi put dan call mereka. Karena opsi put umumnya menunjukkan sentimen negatif, dan opsi call menunjukkan sentimen positif, kita dapat mengetahui sentimen institusional secara keseluruhan dengan memplot rasio put terhadap call. Grafik di sebelah kanan memplot rasio put/call historis untuk instrumen ini.
Menggunakan Rasio Put/Call sebagai indikator sentimen investor mengatasi salah satu kekurangan utama dari penggunaan total kepemilikan institusional, yaitu sejumlah besar aset yang dikelola diinvestasikan secara pasif untuk melacak indeks. Dana yang dikelola secara pasif biasanya tidak membeli opsi, sehingga indikator rasio put/call lebih akurat dalam melacak sentimen dana yang dikelola secara aktif.
Pengajuan 13D/G
Kami menyajikan pengajuan 13D/G secara terpisah dari pengajuan 13F karena perlakuan yang berbeda oleh SEC. Pengajuan 13D/G dapat diajukan oleh kelompok investor (dengan satu pemimpin), sedangkan pengajuan 13F tidak bisa. Hal ini mengakibatkan situasi di mana seorang investor dapat mengajukan 13D/G yang melaporkan satu nilai untuk total saham (mewakili semua saham yang dimiliki oleh kelompok investor), tetapi kemudian mengajukan 13F yang melaporkan nilai yang berbeda untuk total saham (mewakili kepemilikan mereka sendiri). Ini berarti bahwa kepemilikan saham dari pengajuan 13D/G dan pengajuan 13F seringkali tidak dapat dibandingkan secara langsung, sehingga kami menyajikannya secara terpisah.
Catatan: Mulai 16 Mei 2021, kami tidak lagi menampilkan pemilik yang belum mengajukan 13D/G dalam setahun terakhir. Sebelumnya, kami menampilkan riwayat lengkap pengajuan 13D/G. Secara umum, entitas yang diwajibkan untuk mengajukan pengajuan 13D/G harus mengajukan setidaknya setiap tahun sebelum mengirimkan pengajuan penutupan. Namun, terkadang dana keluar dari posisi tanpa mengirimkan pengajuan penutupan (misalnya, mereka menghentikan operasi), sehingga menampilkan riwayat lengkap terkadang menyebabkan kebingungan tentang kepemilikan saat ini. Untuk mencegah kebingungan, kami sekarang hanya menampilkan pemilik 'saat ini' - yaitu - pemilik yang telah mengajukan dalam setahun terakhir.
Upgrade to unlock premium data.
| Tanggal File | Formulir | Investor | Sebelumnya Saham |
Terbaru Saham |
Δ Saham (Persen) |
Kepemilikan (Persen) |
Δ Pagmamay-ari (Persen) |
|
|---|---|---|---|---|---|---|---|---|
| 2025-02-07 | PNC FINANCIAL SERVICES GROUP, INC. | 3,462,275 | 3,590,561 | 3.71 | 6.33 | 0.80 |
Pengajuan 13F dan NPORT
Detail pada pengajuan 13F tersedia gratis. Detail pada pengajuan NP memerlukan keanggotaan premium. Baris berwarna hijau menunjukkan posisi baru. Baris berwarna merah menunjukkan posisi yang sudah ditutup. Klik tautan ini ikon untuk melihat riwayat transaksi selengkapnya.
Tingkatkan
untuk membuka data premium dan mengekspor ke Excel ![]() .
.
| Tanggal File | Sumber | Investor | Ketik | Presyo ng Avg (Silangan) |
Saham | Δ Saham (%) |
Dilaporkan Nilai ($1000) |
Nilai Δ (%) |
Alokasi Port (%) |
|
|---|---|---|---|---|---|---|---|---|---|---|
| 2025-07-16 | 13F | Newton One Investments LLC | 1,419 | 1.36 | 46 | 12.20 | ||||
| 2025-07-18 | 13F | Newman Dignan & Sheerar, Inc. | 33,705 | -7.87 | 1,101 | 1.66 | ||||
| 2025-07-24 | 13F | KC Investment Advisors, LLC | 6,979 | 0.00 | 228 | 10.19 | ||||
| 2025-07-23 | 13F | SpringVest Wealth Management LLC | 18,052 | -47.16 | 590 | -41.68 | ||||
| 2025-08-08 | 13F | Avantax Advisory Services, Inc. | 30,716 | 1,003 | ||||||
| 2025-08-11 | 13F | Annis Gardner Whiting Capital Advisors, LLC | 0 | -100.00 | 0 | |||||
| 2025-08-14 | 13F | Monograph Wealth Advisors, Llc | 49,665 | 0.00 | 1,622 | 10.42 | ||||
| 2025-07-30 | 13F | Towneley Capital Management, Inc / DE | 14,526 | -37.18 | 474 | -30.60 | ||||
| 2025-08-11 | 13F | Mill Creek Capital Advisors, LLC | 340,260 | 60.07 | 11,113 | 76.72 | ||||
| 2025-07-28 | 13F | BRYN MAWR TRUST Co | 430,680 | 5.10 | 14,066 | 16.06 | ||||
| 2025-08-01 | 13F | Bessemer Group Inc | 25 | 0.00 | 0 | |||||
| 2025-08-06 | 13F | Wedbush Securities Inc | 7,135 | 0 | ||||||
| 2025-08-14 | 13F | RMB Capital Management, LLC | 11,321 | 0.00 | 370 | 10.48 | ||||
| 2025-07-21 | 13F | Cliftonlarsonallen Wealth Advisors, Llc | 1,148,042 | -3.38 | 37,495 | 6.68 | ||||
| 2025-07-16 | 13F | Meridian Investment Counsel Inc. | 72,039 | 0.00 | 2,353 | 10.42 | ||||
| 2025-08-05 | 13F | Strategic Financial Concepts, LLC | 11,677 | 40.40 | 381 | 54.88 | ||||
| 2025-08-14 | 13F/A | Skopos Labs, Inc. | 8,368 | 273 | ||||||
| 2025-07-24 | 13F | Lokken Investment Group LLC | 31,040 | 161.79 | 1,014 | 189.43 | ||||
| 2025-08-04 | 13F | Flagship Harbor Advisors, Llc | 9,402 | -14.47 | 307 | -5.54 | ||||
| 2025-07-28 | 13F | Harbour Investments, Inc. | 752 | 1.35 | 25 | 14.29 | ||||
| 2025-08-12 | 13F | PSI Advisors, LLC | 0 | -100.00 | 0 | |||||
| 2025-07-18 | 13F | Truist Financial Corp | 686,603 | -0.37 | 22,424 | 10.01 | ||||
| 2025-08-01 | 13F | Cobblestone Capital Advisors Llc /ny/ | 464,287 | -7.42 | 15,164 | 2.22 | ||||
| 2025-07-16 | 13F | Signaturefd, Llc | 1,900 | -78.15 | 62 | -75.88 | ||||
| 2025-07-24 | 13F | IFP Advisors, Inc | 0 | -100.00 | 0 | |||||
| 2025-07-30 | 13F | Sentry LLC | 8,250 | 0.00 | 269 | 10.25 | ||||
| 2025-07-25 | 13F | Sequoia Financial Advisors, LLC | 376,350 | -28.57 | 12,292 | -21.13 | ||||
| 2025-08-14 | 13F/A | Rockefeller Capital Management L.P. | 51,780 | 10.03 | 1,691 | 21.48 | ||||
| 2025-08-14 | 13F | Stifel Financial Corp | 45,985 | -6.02 | 1,502 | 3.73 | ||||
| 2025-07-10 | 13F | CWC Advisors, LLC. | 132,748 | 5.78 | 4,336 | 16.78 | ||||
| 2025-07-15 | 13F | GSB Wealth Management, LLC | 13,301 | -26.46 | 434 | -18.73 | ||||
| 2025-08-12 | 13F | Steward Partners Investment Advisory, Llc | 78,523 | -0.95 | 2,565 | 9.34 | ||||
| 2025-07-31 | 13F | Sage Mountain Advisors LLC | 7,067 | 3,433.50 | 231 | 4,500.00 | ||||
| 2025-08-06 | 13F | AE Wealth Management LLC | 2,901 | -33.36 | 95 | -26.56 | ||||
| 2025-07-21 | 13F | Ameritas Advisory Services, LLC | 1,039 | 34 | ||||||
| 2025-07-22 | 13F | Iowa State Bank | 18,005 | -11.41 | 588 | -2.16 | ||||
| 2025-08-12 | 13F | Jpmorgan Chase & Co | 203,910 | -34.64 | 6,660 | -27.84 | ||||
| 2025-07-31 | 13F | 3EDGE Asset Management, LP | 456,426 | 215.45 | 14,868 | 244.97 | ||||
| 2025-08-05 | 13F | Atlas Private Wealth Advisors | 552,137 | 1.42 | 18,033 | 11.98 | ||||
| 2025-08-13 | 13F | Rsm Us Wealth Management Llc | 9,195 | 300 | ||||||
| 2025-08-06 | 13F | Atlantic Union Bankshares Corp | 6,127 | 200 | ||||||
| 2025-08-11 | 13F | Wealthgarden F.s. Llc | 6,914 | -1.62 | 223 | 7.73 | ||||
| 2025-08-14 | 13F | Smartleaf Asset Management LLC | 54 | 1,700.00 | 2 | |||||
| 2025-08-07 | 13F | Cvfg Llc | 162,797 | 5.42 | 5,317 | 16.37 | ||||
| 2025-08-26 | 13F/A | Thrivent Financial For Lutherans | 96,076 | 3 | -99.29 | |||||
| 2025-08-14 | 13F | Wetherby Asset Management Inc | 7,979 | 8.50 | 261 | 26.83 | ||||
| 2025-08-14 | 13F | Financial Engines Advisors L.L.C. | 60,594 | 0.09 | 1,979 | 10.50 | ||||
| 2025-08-08 | 13F | Glassman Wealth Services | 7,978 | 0.00 | 261 | 10.64 | ||||
| 2025-08-14 | 13F | EP Wealth Advisors, Inc. | 6,818 | 1.31 | 223 | 11.56 | ||||
| 2025-07-10 | 13F | Baker Tilly Financial, Llc | 19,306 | 0.00 | 631 | 10.33 | ||||
| 2025-08-08 | 13F | Creative Planning | 37,875 | -2.18 | 1,237 | 7.95 | ||||
| 2025-08-15 | 13F | Morgan Stanley | 612,186 | -22.31 | 19,994 | -14.21 | ||||
| 2025-08-04 | 13F | Bristlecone Advisors, LLC | 0 | -100.00 | 0 | |||||
| 2025-07-28 | 13F | Stegner Investment Associates Inc. | 12,365 | -5.01 | 404 | 4.68 | ||||
| 2025-07-15 | 13F | Wela Strategies, Inc. | 23,980 | 0.59 | 783 | 11.06 | ||||
| 2025-08-08 | 13F | Bailard, Inc. | 44,256 | 0.00 | 1,445 | 10.39 | ||||
| 2025-05-14 | 13F | First Trust Advisors Lp | 0 | -100.00 | 0 | |||||
| 2025-07-31 | 13F | FSM Wealth Advisors, LLC | 9,865 | 1.28 | 320 | 10.76 | ||||
| 2025-08-14 | 13F | Jane Street Group, Llc | 0 | -100.00 | 0 | |||||
| 2025-07-30 | 13F | Bogart Wealth, LLC | 61 | 0.00 | 2 | 0.00 | ||||
| 2025-07-09 | 13F | Radnor Capital Management, LLC | 12,000 | 0.00 | 0 | |||||
| 2025-08-11 | 13F | Western Wealth Management, LLC | 16,043 | 23.00 | 524 | 35.84 | ||||
| 2025-08-14 | 13F | Qube Research & Technologies Ltd | 2,196 | -52.97 | 72 | -48.55 | ||||
| 2025-07-22 | 13F | Sage Financial Group Inc | 25,771 | 0.00 | 842 | 10.37 | ||||
| 2025-08-08 | 13F | Tiemann Investment Advisors, Llc | 110,878 | -2.07 | 3,621 | 8.15 | ||||
| 2025-07-21 | 13F | Mirae Asset Global Investments Co., Ltd. | 458,520 | 8.26 | 14,975 | 18.70 | ||||
| 2025-08-14 | 13F | Ameriprise Financial Inc | 224,478 | -2.66 | 7,332 | 7.37 | ||||
| 2025-08-14 | 13F | GWM Advisors LLC | 343,391 | 2.02 | 11,215 | 12.65 | ||||
| 2025-08-08 | 13F | Compass Wealth Management LLC | 0 | -100.00 | 0 | |||||
| 2025-08-13 | 13F | Baird Financial Group, Inc. | 421,489 | -0.36 | 13,766 | 10.01 | ||||
| 2025-08-28 | NP | EDGI - 3EDGE Dynamic International Equity ETF | 456,426 | 215.45 | 14,907 | 248.35 | ||||
| 2025-07-09 | 13F | Chesley Taft & Associates LLC | 19,132 | 10.08 | 625 | 21.40 | ||||
| 2025-04-15 | 13F | Greenwood Capital Associates Llc | 0 | -100.00 | 0 | |||||
| 2025-08-14 | 13F | Betterment LLC | 14,303 | 0 | ||||||
| 2025-08-11 | 13F | First American Trust, Fsb | 54,854 | 4.67 | 1,792 | 15.55 | ||||
| 2025-08-12 | 13F | Coston, McIsaac & Partners | 1,717 | 0.00 | 0 | |||||
| 2025-08-11 | 13F | Private Advisor Group, LLC | 485,594 | 4.46 | 15,860 | 15.34 | ||||
| 2025-09-04 | 13F/A | Advisor Group Holdings, Inc. | 101,983 | -22.57 | 3,331 | -14.50 | ||||
| 2025-07-10 | 13F | Fulton Bank, N.a. | 17,000 | 0.00 | 555 | 10.56 | ||||
| 2025-07-29 | 13F | BKD Wealth Advisors, LLC | 706,444 | -0.73 | 23,072 | 9.61 | ||||
| 2025-07-31 | 13F | Glass Jacobson Investment Advisors llc | 0 | -100.00 | 0 | |||||
| 2025-08-13 | 13F | MONECO Advisors, LLC | 13,567 | -1.93 | 443 | 8.31 | ||||
| 2025-07-30 | 13F | Klingenstein Fields & Co Lp | 12,496 | 0.00 | 408 | 10.57 | ||||
| 2025-08-12 | 13F | Clal Insurance Enterprises Holdings Ltd | 781,424 | 0.00 | 26 | 8.70 | ||||
| 2025-07-25 | 13F | Priebe Wealth Holdings LLC | 76,863 | -19.54 | 2,510 | -11.15 | ||||
| 2025-08-01 | 13F | First National Trust Co | 7,668 | 0.00 | 250 | 10.62 | ||||
| 2025-07-10 | 13F | Focus Financial Network, Inc. | 91,672 | 0.22 | 2,994 | 10.68 | ||||
| 2025-07-24 | 13F | Eastern Bank | 95,803 | -9.04 | 3,129 | 0.42 | ||||
| 2025-08-15 | 13F | Equitable Holdings, Inc. | 24,981 | 3.06 | 816 | 13.67 | ||||
| 2025-08-07 | 13F | Nwam Llc | 0 | -100.00 | 0 | |||||
| 2025-07-15 | 13F | MCF Advisors LLC | 667 | 0.00 | 22 | 10.53 | ||||
| 2025-08-14 | 13F | UBS Group AG | 252,480 | 2.36 | 8,246 | 13.01 | ||||
| 2025-08-07 | 13F | Midwest Trust Co | 125,117 | 4,086 | ||||||
| 2025-07-11 | 13F | Farther Finance Advisors, LLC | 2,234 | -19.44 | 73 | -12.20 | ||||
| 2025-08-06 | 13F | Rialto Wealth Management, LLC | 1,483 | 0.00 | 48 | 11.63 | ||||
| 2025-08-12 | 13F | Franklin Resources Inc | 136 | 0.00 | 4 | 0.00 | ||||
| 2025-08-12 | 13F | Tradition Wealth Management, LLC | 37,781 | 2.63 | 1,234 | 13.33 | ||||
| 2025-07-25 | 13F | Hazlett, Burt & Watson, Inc. | 360 | 0.00 | 0 | |||||
| 2025-07-25 | 13F | Cwm, Llc | 1,908 | 2,444.00 | 0 | |||||
| 2025-08-14 | 13F | Integrated Wealth Concepts LLC | 6,490 | 212 | ||||||
| 2025-07-15 | 13F | Kagan Cocozza Asset Management | 24,410 | -3.53 | 797 | 6.55 | ||||
| 2025-07-25 | 13F | Stonehage Fleming Financial Services Holdings Ltd | 23,790 | 0.00 | 777 | 10.38 | ||||
| 2025-07-16 | 13F | Dakota Wealth Management | 0 | -100.00 | 0 | |||||
| 2025-08-12 | 13F | Proequities, Inc. | 0 | 0 | ||||||
| 2025-07-14 | 13F | Friday Financial | 237,758 | 6.59 | 7,765 | 17.19 | ||||
| 2025-07-25 | 13F | Lodestar Private Asset Management Llc | 785,162 | 5.08 | 25,643 | 16.02 | ||||
| 2025-08-12 | 13F | Gladstone Institutional Advisory LLC | 10,582 | 6.00 | 346 | 16.95 | ||||
| 2025-07-24 | 13F | Ronald Blue Trust, Inc. | 519 | 0.00 | 17 | 6.67 | ||||
| 2025-08-12 | 13F | Global Retirement Partners, LLC | 23,718 | -3.32 | 775 | 12.99 | ||||
| 2025-05-01 | 13F | McCarthy Grittinger Financial Group, LLC | 0 | -100.00 | 0 | |||||
| 2025-08-06 | 13F | Commonwealth Equity Services, Llc | 205,393 | -18.81 | 7 | -14.29 | ||||
| 2025-08-05 | 13F | Dunhill Financial, LLC | 563 | 1.26 | 18 | 12.50 | ||||
| 2025-05-01 | 13F | Bleakley Financial Group, LLC | 0 | -100.00 | 0 | -100.00 | ||||
| 2025-08-04 | 13F | Hantz Financial Services, Inc. | 307,993 | -2.01 | 10 | 11.11 | ||||
| 2025-08-08 | 13F | SBI Securities Co., Ltd. | 609 | -17.03 | 20 | -9.52 | ||||
| 2025-07-25 | 13F | Midwest Capital Advisors, LLC | 16,725 | 1.91 | 546 | 12.58 | ||||
| 2025-08-14 | 13F | Bbr Partners, Llc | 23,341 | 762 | ||||||
| 2025-08-14 | 13F | Warren Averett Asset Management, LLC | 275,064 | 5.87 | 8,984 | 16.89 | ||||
| 2025-08-04 | 13F | HBK Sorce Advisory LLC | 35,362 | -7.84 | 1,155 | 1.76 | ||||
| 2025-08-05 | 13F | Bank Of Montreal /can/ | 226,395 | -6.55 | 7,394 | 3.20 | ||||
| 2025-08-01 | 13F | Envestnet Asset Management Inc | 617,595 | 0.59 | 20,171 | 11.07 | ||||
| 2025-07-15 | 13F | Retirement Income Solutions, Inc | 29,457 | 962 | ||||||
| 2025-07-24 | 13F | Jfs Wealth Advisors, Llc | 6,729 | 0.00 | 220 | 10.05 | ||||
| 2025-08-14 | 13F | Mariner, LLC | 155,453 | -1.58 | 5,077 | 8.67 | ||||
| 2025-07-09 | 13F | Goelzer Investment Management, Inc. | 12,113 | 12.31 | 396 | 23.82 | ||||
| 2025-07-24 | 13F | Blair William & Co/il | 8,816 | 117.25 | 288 | 139.17 | ||||
| 2025-07-23 | 13F | Arcadia Investment Advisors Llc | 378,915 | -1.77 | 12,375 | 8.47 | ||||
| 2025-08-05 | 13F | Tiaa Trust, National Association | 18,879 | 7.59 | 617 | 18.69 | ||||
| 2025-07-07 | 13F | First Community Trust Na | 1,312 | 43 | ||||||
| 2025-07-07 | 13F | Wealth Alliance Advisory Group, LLC | 475,441 | 2.65 | 15,528 | 13.34 | ||||
| 2025-07-22 | 13F | Merit Financial Group, LLC | 276,442 | 0.12 | 9,029 | 10.54 | ||||
| 2025-07-24 | 13F | 3Chopt Investment Partners, LLC | 0 | -100.00 | 0 | |||||
| 2025-08-11 | 13F | Synergy Investment Management, LLC | 0 | -100.00 | 0 | |||||
| 2025-08-13 | 13F | Wambolt & Associates, LLC | 11,516 | -2.07 | 375 | 7.76 | ||||
| 2025-08-13 | 13F | VestGen Advisors, LLC | 185,891 | -0.46 | 6,053 | 9.58 | ||||
| 2025-07-14 | 13F | AdvisorNet Financial, Inc | 174 | 0.00 | 6 | 0.00 | ||||
| 2025-08-12 | 13F | Jacobi Capital Management LLC | 584,073 | 19,076 | ||||||
| 2025-08-11 | 13F | Mach-1 Financial Group, Inc. | 246,902 | 7.90 | 8,064 | 19.13 | ||||
| 2025-08-14 | 13F | Royal Bank Of Canada | 30,207 | -53.12 | 987 | -48.22 | ||||
| 2025-08-13 | 13F | Northwestern Mutual Wealth Management Co | 34,268 | -4.07 | 1,119 | 5.97 | ||||
| 2025-05-12 | 13F | Kohmann Bosshard Financial Services, LLC | 0 | -100.00 | 0 | |||||
| 2025-05-09 | 13F | Banco Santander, S.A. | 0 | -100.00 | 0 | |||||
| 2025-07-18 | 13F | Bartlett & Co. Wealth Management Llc | 331 | 0.00 | 11 | 11.11 | ||||
| 2025-07-30 | 13F | Whittier Trust Co Of Nevada Inc | 5,889 | 0.00 | 192 | 10.34 | ||||
| 2025-08-14 | 13F | Citadel Advisors Llc | Call | 12,200 | -64.53 | 398 | -60.87 | |||
| 2025-07-31 | 13F | GLOBALT Investments LLC / GA | 1,439,421 | -2.07 | 47,012 | 8.12 | ||||
| 2025-08-14 | 13F | Raymond James Financial Inc | 172,759 | -13.80 | 5,642 | -4.82 | ||||
| 2025-07-14 | 13F | Opal Wealth Advisors, LLC | 137,921 | 3.42 | 4,505 | 14.20 | ||||
| 2025-07-24 | 13F | Us Bancorp \de\ | 25,382 | 829 | ||||||
| 2025-08-12 | 13F | CIBC Private Wealth Group, LLC | 1,776 | 0.00 | 58 | 26.09 | ||||
| 2025-08-13 | 13F | Lido Advisors, LLC | 36,400 | 0.01 | 1,189 | 10.41 | ||||
| 2025-07-16 | 13F | Novem Group | 106,320 | 4.02 | 3,472 | 14.85 | ||||
| 2025-07-31 | 13F | Nisa Investment Advisors, Llc | 199,000 | 0.00 | 6,499 | 10.41 | ||||
| 2025-08-08 | 13F | MTM Investment Management, LLC | 528 | 17 | ||||||
| 2025-08-14 | 13F | Fmr Llc | 13,832 | 86.49 | 452 | 105.94 | ||||
| 2025-08-14 | 13F | Bragg Financial Advisors, Inc | 33,078 | -6.97 | 1,080 | 2.76 | ||||
| 2025-07-15 | 13F | Main Street Group, LTD | 1,303 | 0.08 | 43 | 10.53 | ||||
| 2025-08-11 | 13F | United Capital Financial Advisers, Llc | 69,006 | -13.09 | 2,254 | -4.05 | ||||
| 2025-07-17 | 13F | Janney Montgomery Scott LLC | 7,919 | 0.00 | 0 | |||||
| 2025-07-16 | 13F | Blue Oak Capital, LLC | 0 | -100.00 | 0 | |||||
| 2025-08-14 | 13F | Citadel Advisors Llc | 14,676 | 89.78 | 479 | 110.09 | ||||
| 2025-07-15 | 13F | Smith & Howard Wealth Management, LLC | 6,411 | 209 | ||||||
| 2025-07-23 | 13F | BankPlus Trust Department | 468 | 0.00 | 15 | 15.38 | ||||
| 2025-08-13 | 13F | Tobias Financial Advisors, Inc. | 191,704 | -2.00 | 6,261 | 8.21 | ||||
| 2025-08-14 | 13F | Mml Investors Services, Llc | 28,516 | 2.86 | 1 | |||||
| 2025-07-14 | 13F | Brady Martz Wealth Solutions, LLC | 186,640 | 0.26 | 6,096 | 10.70 | ||||
| 2025-07-29 | 13F | Tradewinds Capital Management, LLC | 45 | 1 | ||||||
| 2025-08-14 | 13F | Synovus Financial Corp | 85,635 | -0.56 | 2,797 | 9.82 | ||||
| 2025-07-28 | 13F | Mutual Advisors, LLC | 83,649 | 10.89 | 2,785 | 22.43 | ||||
| 2025-08-14 | 13F | Matrix Private Capital Group Llc | 6,800 | 0.00 | 222 | 10.45 | ||||
| 2025-08-15 | 13F | Lantern Wealth Advisors, LLC | 11,775 | 14.60 | 385 | 33.80 | ||||
| 2025-07-10 | 13F | Sharkey, Howes & Javer | 10,026 | -40.34 | 327 | -34.21 | ||||
| 2025-07-23 | 13F | Valmark Advisers, Inc. | 143,239 | -0.75 | 4,678 | 9.61 | ||||
| 2025-07-23 | 13F | Laraway Financial Inc | 37,991 | 0.02 | 1,241 | 10.42 | ||||
| 2025-08-12 | 13F | MAI Capital Management | 8,562 | -4.81 | 280 | 4.89 | ||||
| 2025-08-12 | 13F | LPL Financial LLC | 1,465,088 | 11.00 | 47,850 | 22.56 | ||||
| 2025-08-12 | 13F | O'shaughnessy Asset Management, Llc | 146 | 5 | ||||||
| 2025-07-18 | 13F | First Pacific Financial | 4,270 | -2.76 | 139 | 7.75 | ||||
| 2025-05-14 | 13F | Van Hulzen Asset Management, LLC | 0 | -100.00 | 0 | -100.00 | ||||
| 2025-07-29 | 13F | Private Wealth Management Group, LLC | 3,200 | 0.00 | 105 | 10.64 | ||||
| 2025-08-06 | 13F | SOUTH STATE Corp | 24 | 1 | ||||||
| 2025-07-22 | 13F | Simplicity Wealth,LLC | 25,412 | 112.26 | 830 | 134.18 | ||||
| 2025-08-01 | 13F | GoalVest Advisory LLC | 6,979 | 0.00 | 228 | 10.19 | ||||
| 2025-08-05 | 13F | Bank of New York Mellon Corp | 15,559 | -46.45 | 508 | -40.86 | ||||
| 2025-08-12 | 13F | Cornerstone Wealth Management, LLC | 13,410 | 0.06 | 438 | 10.35 | ||||
| 2025-07-08 | 13F | Nbc Securities, Inc. | 523 | 0.00 | 0 | |||||
| 2025-08-04 | 13F | Assetmark, Inc | 270 | 9 | ||||||
| 2025-08-18 | 13F | Geneos Wealth Management Inc. | 3,948 | 171.71 | 129 | 204.76 | ||||
| 2025-08-14 | 13F | CoreCap Advisors, LLC | 1,693 | 4.51 | 55 | 17.02 | ||||
| 2025-04-18 | 13F | CENTRAL TRUST Co | 0 | -100.00 | 0 | |||||
| 2025-07-17 | 13F | Hengehold Capital Management Llc | 1,140,791 | -0.08 | 37,258 | 10.32 | ||||
| 2025-05-15 | 13F | Johnson Financial Group, Inc. | 0 | -100.00 | 0 | -100.00 | ||||
| 2025-05-15 | 13F | Mercer Global Advisors Inc /adv | 0 | -100.00 | 0 | |||||
| 2025-07-07 | 13F | Investors Research Corp | 8,148 | -75.70 | 266 | -73.16 | ||||
| 2025-05-15 | 13F | Gts Securities Llc | 0 | -100.00 | 0 | -100.00 | ||||
| 2025-08-05 | 13F | Huntington National Bank | 11,454 | 9.45 | ||||||
| 2025-08-14 | 13F | First Commonwealth Financial Corp /pa/ | 18,091 | 28.20 | 591 | 41.49 | ||||
| 2025-08-04 | 13F | Spire Wealth Management | 154 | 0.00 | 5 | 25.00 | ||||
| 2025-08-11 | 13F | Principal Securities, Inc. | 1,000 | 0.00 | 33 | 18.52 | ||||
| 2025-07-23 | 13F | Penney Financial, LLC | 6,540 | 214 | ||||||
| 2025-07-30 | 13F | Whittier Trust Co | 265,091 | -0.14 | 8,655 | 10.27 | ||||
| 2025-08-11 | 13F | HHM Wealth Advisors, LLC | 72,779 | -8.06 | 2,377 | 1.50 | ||||
| 2025-08-11 | 13F | HighTower Advisors, LLC | 1,652,547 | -10.97 | 53,972 | -1.70 | ||||
| 2025-07-18 | 13F | SMI Advisory Services, LLC | 16,628 | -4.49 | 541 | 17.10 | ||||
| 2025-08-11 | 13F | TD Waterhouse Canada Inc. | 932 | 0.00 | 30 | 11.11 | ||||
| 2025-08-12 | 13F | Deutsche Bank Ag\ | 6,149 | 0.00 | 201 | 10.50 | ||||
| 2025-05-13 | 13F | Renaissance Group Llc | 0 | -100.00 | 0 | |||||
| 2025-08-12 | 13F | BlackRock, Inc. | 19 | 5.56 | 1 | |||||
| 2025-08-14 | 13F | Wells Fargo & Company/mn | 174,426 | -30.92 | 5,697 | -23.74 | ||||
| 2025-08-13 | 13F | Avestar Capital, LLC | 9,363 | 306 | ||||||
| 2025-07-10 | 13F | Wealth Enhancement Advisory Services, Llc | 569,855 | -4.86 | 18,703 | 5.56 | ||||
| 2025-08-08 | 13F | WASHINGTON TRUST Co | 0 | -100.00 | 0 | |||||
| 2025-08-11 | 13F | ARS Investment Partners, LLC | 8,579 | 0.00 | 280 | 17.15 | ||||
| 2025-08-19 | 13F/A | Pitcairn Co | 742,155 | -28.87 | 24,239 | -21.47 | ||||
| 2025-05-15 | 13F | Glenmede Trust Co Na | 3,075 | 0.00 | 91 | 5.88 | ||||
| 2025-04-23 | 13F | Financial Life Planners | 0 | -100.00 | 0 | |||||
| 2025-08-14 | 13F | Bank Of America Corp /de/ | 7,855,164 | 3.82 | 256,550 | 14.63 | ||||
| 2025-08-15 | 13F | Security National Bank Of So Dak | 12,977 | 0.00 | 424 | 10.44 | ||||
| 2025-08-01 | 13F | Financial Counselors Inc | 0 | -100.00 | 0 | |||||
| 2025-08-14 | 13F | 10Elms LLP | 5,528 | -14.99 | 181 | -6.25 | ||||
| 2025-08-14 | 13F | Colony Group, LLC | 150,551 | 0.37 | 4,917 | 10.82 | ||||
| 2025-07-24 | 13F | Stonebridge Financial Group, LLC | 0 | -100.00 | 0 | |||||
| 2025-08-08 | 13F | Pnc Financial Services Group, Inc. | 3,848,129 | -0.27 | 125,680 | 10.12 | ||||
| 2025-08-13 | 13F | IAG Wealth Partners, LLC | 302,274 | -4.22 | 9,872 | 5.75 | ||||
| 2025-07-11 | 13F | BTC Capital Management, Inc. | 89,586 | 0.00 | 2,926 | 10.42 | ||||
| 2025-08-12 | 13F | YANKCOM Partnership | 1,538 | 0.00 | 50 | 11.11 | ||||
| 2025-07-08 | 13F | Lowe Wealth Advisors, LLC | 2,864 | 0.00 | 94 | 10.71 | ||||
| 2025-07-18 | 13F | RKL Wealth Management LLC | 0 | -100.00 | 0 | |||||
| 2025-07-31 | 13F | Buckingham Strategic Partners | 425,027 | 3.71 | 13,881 | 14.51 | ||||
| 2025-08-06 | 13F | Savant Capital, LLC | 126,001 | -0.34 | 4,115 | 10.06 | ||||
| 2025-07-25 | 13F | Mitchell Capital Management Co | 10,157 | 5.64 | 331 | 16.55 | ||||
| 2025-08-13 | 13F | Cerity Partners LLC | 85,915 | -0.62 | 2,806 | 9.70 | ||||
| 2025-07-25 | 13F | Courage Miller Partners, LLC | 200,366 | 1.61 | 6,544 | 12.19 | ||||
| 2025-08-08 | 13F | Cetera Investment Advisers | 45,765 | 6.71 | 1,495 | 17.82 | ||||
| 2025-07-31 | 13F | BIP Wealth, LLC | 7,479 | -4.56 | 244 | 5.63 | ||||
| 2025-08-14 | 13F | Citadel Advisors Llc | Put | 0 | -100.00 | 0 | ||||
| 2025-07-29 | 13F | Signature Estate & Investment Advisors Llc | 568,497 | -0.09 | 18,567 | 10.31 | ||||
| 2025-05-15 | 13F | SIH Partners, LLLP | 0 | -100.00 | 0 | |||||
| 2025-08-14 | 13F | Goldman Sachs Group Inc | 24,109 | -68.92 | 787 | -65.69 | ||||
| 2025-08-12 | 13F | Virtu Financial LLC | 0 | -100.00 | 0 | |||||
| 2025-08-05 | 13F | Tsfg, Llc | 1,969 | 0.00 | 0 | |||||
| 2025-04-23 | 13F | Continuum Advisory, LLC | 0 | -100.00 | 0 | -100.00 | ||||
| 2025-07-15 | 13F | RVW Wealth, LLC | 6,425 | 210 | ||||||
| 2025-04-17 | 13F | Montecito Bank & Trust | 124,481 | -2.37 | 3,682 | 3.37 | ||||
| 2025-07-15 | 13F | Td Private Client Wealth Llc | 92,719 | -7.26 | 3,028 | 2.40 | ||||
| 2025-08-01 | 13F | Chilton Capital Management Llc | 1,397 | 0.00 | 46 | 9.76 | ||||
| 2025-07-29 | 13F | Angeles Wealth Management, Llc | 305 | 10 | ||||||
| 2025-08-11 | 13F | Avantax Planning Partners, Inc. | 2,394,331 | 15.42 | 78,199 | 27.44 | ||||
| 2025-05-12 | 13F | Todd Asset Management Llc | 0 | -100.00 | 0 | |||||
| 2025-08-13 | 13F | Capital Group Private Client Services, Inc. | 18,846 | 616 | ||||||
| 2025-08-07 | 13F/A | Joseph Group Capital Management | 777 | -43.20 | 25 | -37.50 | ||||
| 2025-08-11 | 13F | Highview Capital Management LLC/DE/ | 10,541 | 0.00 | 344 | 10.61 | ||||
| 2025-07-14 | 13F | Masso Torrence Wealth Management Inc. | 29,571 | 7.12 | 966 | 18.26 | ||||
| 2025-07-14 | 13F | GAMMA Investing LLC | 374 | 0.00 | 12 | 9.09 | ||||
| 2025-08-12 | 13F | Bokf, Na | 17,553 | 0.00 | 573 | 10.40 | ||||
| 2025-08-08 | 13F | Flaharty Asset Management, LLC | 24 | 0.00 | 1 | |||||
| 2025-07-15 | 13F/A | Kure Advisory, LLC | 15,762 | 0.00 | 515 | 10.30 | ||||
| 2025-08-06 | 13F | Walkner Condon Financial Advisors LLC | 136,585 | 1.40 | 4,461 | 11.95 | ||||
| 2025-08-15 | 13F | WFA of San Diego, LLC | 17,680 | -19.31 | 577 | -13.36 | ||||
| 2025-07-23 | 13F | Center For Asset Management LLC | 0 | -100.00 | 0 | |||||
| 2025-08-14 | 13F | Comerica Bank | 1,150 | 0.00 | 38 | 8.82 | ||||
| 2025-07-18 | 13F | Financial Consulate, Inc | 30,171 | 985 | ||||||
| 2025-08-14 | 13F | Glenmede Investment Management, LP | 3,075 | 100 | ||||||
| 2025-07-31 | 13F | Cambridge Investment Research Advisors, Inc. | 96,785 | 46.74 | 3 | 200.00 | ||||
| 2025-08-05 | 13F | Scarborough Advisors, LLC | 800 | 26 | ||||||
| 2025-08-05 | 13F | Key FInancial Inc | 7,705 | 1,691.86 | 252 | 1,991.67 | ||||
| 2025-05-14 | 13F | Oarsman Capital, Inc. | 0 | -100.00 | 0 | |||||
| 2025-08-15 | 13F | Kestra Advisory Services, LLC | 52,281 | 54.72 | 1,708 | 70.87 | ||||
| 2025-08-15 | 13F | CI Private Wealth, LLC | 94,794 | 107.06 | 3,096 | 128.58 | ||||
| 2025-07-25 | 13F | Apollon Wealth Management, LLC | 38,035 | -8.20 | 1,242 | 1.39 | ||||
| 2025-08-14 | 13F | Gerber Kawasaki Wealth & Investment Management | 386,673 | 41.44 | 12,629 | 56.17 | ||||
| 2025-07-17 | 13F/A | Capital Investment Advisors, LLC | 113,560 | -1.98 | 3,709 | 8.20 | ||||
| 2025-07-29 | 13F | Koshinski Asset Management, Inc. | 6,788 | 0.00 | 222 | 10.50 | ||||
| 2025-08-15 | 13F | Captrust Financial Advisors | 165,778 | -36.77 | 5,414 | -30.19 | ||||
| 2025-07-29 | 13F | Private Trust Co Na | 10,397 | 1,647.39 | 340 | 1,894.12 | ||||
| 2025-08-05 | 13F | Freestone Capital Holdings, LLC | 79,711 | 27.49 | 2,603 | 40.78 | ||||
| 2025-07-14 | 13F | Sterling Group Wealth Management, LLC | 154,854 | -3.68 | 5,058 | 6.35 | ||||
| 2025-08-08 | 13F | Hartland & Co., LLC | 157,293 | 0.03 | 5,137 | 10.45 |