Mga Batayang Estadistika
| Pemilik Institusional | 297 total, 296 long only, 0 short only, 1 long/short - change of 8.00% MRQ |
| Alokasi Portofolio Rata-rata | 1.1559 % - change of -5.01% MRQ |
| Saham Institusional (Jangka Panjang) | 102,098,672 (ex 13D/G) - change of 13.21MM shares 14.86% MRQ |
| Nilai Institusional (Jangka Panjang) | $ 3,104,792 USD ($1000) |
Kepemilikan Institusional dan Pemegang Saham
Dimensional ETF Trust - Dimensional US Large Cap Value ETF (US:DFLV) memiliki 297 pemilik institusional dan pemegang saham yang telah mengajukan formulir 13D/G atau 13F kepada Komisi Bursa Efek (Securities Exchange Commission/SEC). Lembaga-lembaga ini memegang total 102,098,672 saham. Pemegang saham terbesar meliputi Savant Capital, LLC, EP Wealth Advisors, Inc., CI Private Wealth, LLC, Foster Group, Inc., Mosaic Family Wealth Partners, Llc, Truepoint, Inc., Pathstone Holdings, LLC, HighTower Advisors, LLC, Summit Financial Strategies, Inc., and Coldstream Capital Management Inc .
Struktur kepemilikan institusional Dimensional ETF Trust - Dimensional US Large Cap Value ETF (ARCA:DFLV) menunjukkan posisi terkini di perusahaan oleh institusi dan dana, serta perubahan terbaru dalam ukuran posisi. Pemegang saham utama dapat mencakup investor individu, reksa dana, dana lindung nilai, atau institusi. Jadwal 13D menunjukkan bahwa investor memegang (atau pernah memegang) lebih dari 5% saham perusahaan dan bermaksud (atau pernah bermaksud) untuk secara aktif mengejar perubahan strategi bisnis. Jadwal 13G menunjukkan investasi pasif lebih dari 5%.
The share price as of September 5, 2025 is 32.43 / share. Previously, on September 9, 2024, the share price was 29.86 / share. This represents an increase of 8.61% over that period.

Skor Sentimen Dana
Skor Sentimen Dana (sebelumnya dikenal sebagai Skor Akumulasi Kepemilikan) menemukan saham-saham yang paling banyak dibeli oleh dana. Ini adalah hasil dari model kuantitatif multi-faktor yang canggih yang mengidentifikasi perusahaan dengan tingkat akumulasi institusional tertinggi. Model penilaian menggunakan kombinasi dari total peningkatan pemilik yang diungkapkan, perubahan dalam alokasi portofolio pada pemilik tersebut, dan metrik lainnya. Angka berkisar dari 0 hingga 100, dengan angka yang lebih tinggi menunjukkan tingkat akumulasi yang lebih tinggi dibandingkan dengan perusahaan sejenisnya, dan 50 adalah rata-ratanya.
Frekuensi Pembaruan: Setiap Hari
Lihat Ownership Explorer, yang menyediakan daftar perusahaan dengan peringkat tertinggi.
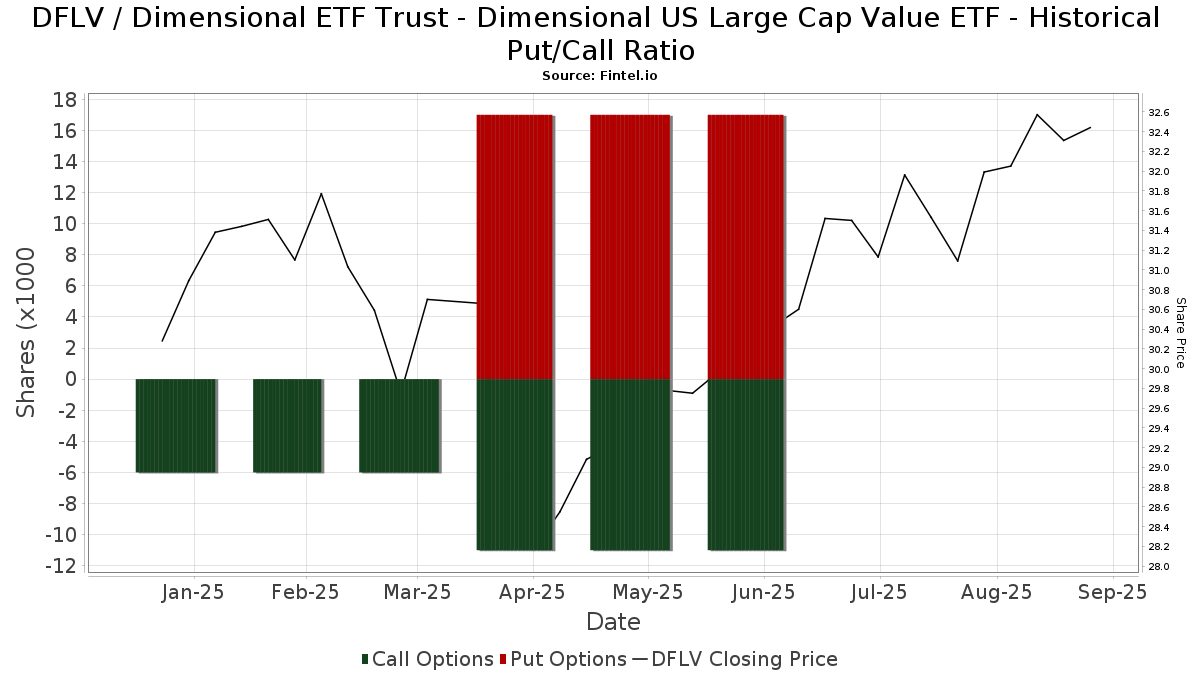
Rasio Put/Call Institusional
Selain melaporkan isu ekuitas dan utang standar, institusi dengan aset di bawah manajemen lebih dari 100 juta dolar AS juga harus mengungkapkan kepemilikan opsi put dan call mereka. Karena opsi put umumnya menunjukkan sentimen negatif, dan opsi call menunjukkan sentimen positif, kita dapat mengetahui sentimen institusional secara keseluruhan dengan memplot rasio put terhadap call. Grafik di sebelah kanan memplot rasio put/call historis untuk instrumen ini.
Menggunakan Rasio Put/Call sebagai indikator sentimen investor mengatasi salah satu kekurangan utama dari penggunaan total kepemilikan institusional, yaitu sejumlah besar aset yang dikelola diinvestasikan secara pasif untuk melacak indeks. Dana yang dikelola secara pasif biasanya tidak membeli opsi, sehingga indikator rasio put/call lebih akurat dalam melacak sentimen dana yang dikelola secara aktif.
Pengajuan 13F dan NPORT
Detail pada pengajuan 13F tersedia gratis. Detail pada pengajuan NP memerlukan keanggotaan premium. Baris berwarna hijau menunjukkan posisi baru. Baris berwarna merah menunjukkan posisi yang sudah ditutup. Klik tautan ini ikon untuk melihat riwayat transaksi selengkapnya.
Tingkatkan
untuk membuka data premium dan mengekspor ke Excel ![]() .
.
| Tanggal File | Sumber | Investor | Ketik | Presyo ng Avg (Silangan) |
Saham | Δ Saham (%) |
Dilaporkan Nilai ($1000) |
Nilai Δ (%) |
Alokasi Port (%) |
|
|---|---|---|---|---|---|---|---|---|---|---|
| 2025-05-12 | 13F | Sandy Spring Bank | 145,271 | 6.74 | 4,441 | 8.64 | ||||
| 2025-08-14 | 13F | Goldman Sachs Group Inc | 0 | -100.00 | 0 | |||||
| 2025-08-11 | 13F | VSM Wealth Advisory, LLC | 5,811 | 0.00 | 180 | 1.69 | ||||
| 2025-07-17 | 13F | Melfa Wealth Management, Llc | 15,845 | -13.59 | 492 | -12.32 | ||||
| 2025-07-16 | 13F | Gradient Capital Advisors, LLC | 100,792 | 6.34 | 3,127 | 7.90 | ||||
| 2025-07-31 | 13F | City State Bank | 48,540 | 10.11 | 1,506 | 11.73 | ||||
| 2025-07-28 | 13F | Harbour Investments, Inc. | 600 | 0.00 | 19 | 0.00 | ||||
| 2025-08-13 | 13F | Jones Financial Companies Lllp | 1,738 | 54 | ||||||
| 2025-08-06 | 13F | Disciplined Investors, L.L.C. | 45,134 | 7.59 | 1,400 | 9.20 | ||||
| 2025-07-15 | 13F | Level Financial Advisors, Inc. | 217,854 | 0.90 | 6,758 | 2.38 | ||||
| 2025-07-17 | 13F | Nelson, Van Denburg & Campbell Wealth Management Group, LLC | 29,767 | -75.21 | 923 | -74.85 | ||||
| 2025-07-28 | 13F | RCS Financial Planning, LLC | 11,419 | 0.00 | 354 | 1.43 | ||||
| 2025-07-22 | 13F | DBK Financial Counsel, LLC | 68,959 | 22.74 | 2,139 | 24.58 | ||||
| 2025-08-08 | 13F | Truepoint, Inc. | 2,820,890 | 2.84 | 87,504 | 4.36 | ||||
| 2025-08-13 | 13F | Cary Street Partner Investment Advisory Llc | 3,100 | 0.00 | 96 | 2.13 | ||||
| 2025-07-23 | 13F | Pillar Financial Advisors, LLC | 256,140 | 5.89 | 7,945 | 7.45 | ||||
| 2025-08-15 | 13F | CI Private Wealth, LLC | 5,629,872 | 4.90 | 174,639 | 6.45 | ||||
| 2025-08-15 | 13F | Kestra Advisory Services, LLC | 48,558 | -11.73 | 1,506 | -10.41 | ||||
| 2025-08-07 | 13F | McClarren Financial Advisors, Inc. | 7,144 | 39.07 | 222 | |||||
| 2025-07-11 | 13F | Farther Finance Advisors, LLC | 67,492 | 1.35 | 2,094 | 3.05 | ||||
| 2025-08-13 | 13F | Renaissance Technologies Llc | 49,500 | 1,535 | ||||||
| 2025-07-14 | 13F | Maryland Capital Advisors Inc. | 263,953 | 25.73 | 8,188 | 27.58 | ||||
| 2025-07-31 | 13F | Topsail Wealth Management, LLC | 958 | 0.00 | 30 | 0.00 | ||||
| 2025-07-28 | 13F | Sterling Financial Planning, Inc. | 31,344 | 25.43 | 972 | 27.39 | ||||
| 2025-08-05 | 13F | Bridgewater Advisors Inc. | 29,434 | 15.56 | 936 | 26.49 | ||||
| 2025-08-13 | 13F | Cerity Partners LLC | 969,393 | 14.61 | 30,071 | 16.29 | ||||
| 2025-08-14 | 13F | Stage Harbor Financial, Llc | 585,040 | 19.09 | 18,148 | 20.83 | ||||
| 2025-08-14 | 13F | Jane Street Group, Llc | 18,826 | 3.44 | 584 | 4.86 | ||||
| 2025-08-12 | 13F | McGrath & Associates, Inc. | 17,548 | 6.51 | 544 | 8.15 | ||||
| 2025-08-12 | 13F | Team Hewins, LLC | 839,232 | 1.59 | 26,033 | 3.08 | ||||
| 2025-08-13 | 13F | Townsquare Capital Llc | 0 | -100.00 | 0 | |||||
| 2025-07-10 | 13F | Voisard Asset Management Group, Inc. | 38,204 | 1,185 | ||||||
| 2025-07-17 | 13F | Mustard Seed Financial, LLC | 169,182 | 11.50 | 5,248 | 13.15 | ||||
| 2025-05-02 | 13F | BluePointe Capital Management, LLC | 77,809 | 133.36 | 2,379 | 137.56 | ||||
| 2025-08-01 | 13F | Redwood Park Advisors LLC | 123,896 | 7.61 | 3,843 | 9.21 | ||||
| 2025-08-12 | 13F | LPL Financial LLC | 1,377,603 | 6.49 | 42,733 | 8.06 | ||||
| 2025-07-16 | 13F | Signature Resources Capital Management, LLC | 651 | 0.00 | 20 | 5.26 | ||||
| 2025-08-08 | 13F | Hartland & Co., LLC | 727 | 0.00 | 23 | 0.00 | ||||
| 2025-08-11 | 13F | HighTower Advisors, LLC | 1,956,955 | 21.09 | 60,705 | 22.87 | ||||
| 2025-08-14 | 13F | Monograph Wealth Advisors, Llc | 291,473 | 0.00 | 9,041 | 1.47 | ||||
| 2025-07-16 | 13F | Jentner Corp | 835,891 | 14.39 | 25,929 | 16.07 | ||||
| 2025-08-12 | 13F | Jpmorgan Chase & Co | 432,023 | 9.13 | 13,401 | 10.74 | ||||
| 2025-07-10 | 13F | Strathmore Capital Advisors, Inc. | 9,644 | -3.80 | 304 | 0.66 | ||||
| 2025-08-14 | 13F | Staley Capital Advisers Inc | 26,880 | 21.08 | 834 | 22.86 | ||||
| 2025-07-24 | 13F | Ronald Blue Trust, Inc. | 157,093 | 2.00 | 4,873 | 3.50 | ||||
| 2025-07-30 | 13F | Rehmann Capital Advisory Group | 7,142 | 0.00 | 222 | 1.38 | ||||
| 2025-08-14 | 13F | Envision Financial Planning, LLC | 86,284 | -11.86 | 2,677 | -10.56 | ||||
| 2025-08-14 | 13F | Ancora Advisors, LLC | 1,850 | 0.00 | 57 | 1.79 | ||||
| 2025-08-08 | 13F | Francis Financial, Inc. | 351,879 | -15.14 | 10,915 | -13.89 | ||||
| 2025-07-14 | 13F | Financial Harvest, LLC | 36,530 | 1,133 | ||||||
| 2025-07-22 | 13F | Gemmer Asset Management LLC | 243,224 | 2.90 | 7,545 | 4.40 | ||||
| 2025-08-12 | 13F | Tableaux Llc | 10,159 | 262 | ||||||
| 2025-07-15 | 13F | Great Oak Capital Partners, Llc | 846,779 | 5.12 | 26,699 | 9.71 | ||||
| 2025-08-01 | 13F | Envestnet Asset Management Inc | 181,941 | 18.92 | 5,644 | 20.65 | ||||
| 2025-07-29 | 13F | Fundamentun, Llc | 19,969 | 619 | ||||||
| 2025-07-22 | 13F | SOL Capital Management CO | 48,369 | 17.00 | 2 | 0.00 | ||||
| 2025-08-14 | 13F | Clg Llc | 88,832 | 2.11 | 2,756 | 3.61 | ||||
| 2025-07-16 | 13F | Builder Investment Group Inc /adv | 48,802 | 26.75 | 1,514 | 28.55 | ||||
| 2025-07-22 | 13F | Wealthcare Advisory Partners LLC | 100,936 | 261.89 | 3,131 | 267.49 | ||||
| 2025-07-24 | 13F | Cyndeo Wealth Partners, LLC | 115,715 | 2.56 | 3,589 | 4.06 | ||||
| 2025-07-15 | 13F | Mather Group, Llc. | 1,106,184 | 5.52 | 34,314 | 7.07 | ||||
| 2025-07-29 | 13F | Signature Estate & Investment Advisors Llc | 56,831 | 21.36 | 1,763 | 23.13 | ||||
| 2025-07-29 | 13F | Stratos Wealth Partners, LTD. | 7,283 | 226 | ||||||
| 2025-08-05 | 13F | Sigma Planning Corp | 9,847 | 305 | ||||||
| 2025-07-17 | 13F | Porter White Investment Advisors, Inc. | 66,141 | -6.86 | 2,052 | -5.48 | ||||
| 2025-08-07 | 13F | Samalin Investment Counsel, LLC | 27,213 | 2.64 | 844 | 4.20 | ||||
| 2025-08-12 | 13F | Cowa, Llc | 29,854 | 1.25 | 926 | 2.77 | ||||
| 2025-08-12 | 13F | Global Retirement Partners, LLC | 1,977 | 8.21 | 61 | 12.96 | ||||
| 2025-07-29 | 13F | Stratos Wealth Advisors, LLC | 32,709 | 24.38 | 1,015 | 26.28 | ||||
| 2025-07-03 | 13F | Trinity Financial Advisors LLC | 35,384 | -36.61 | 1,098 | -32.74 | ||||
| 2025-08-06 | 13F | AE Wealth Management LLC | 1,742 | 54 | ||||||
| 2025-08-13 | 13F | EverSource Wealth Advisors, LLC | 700 | -50.21 | 22 | -50.00 | ||||
| 2025-08-07 | 13F | Fidelis Capital Partners, LLC | 14,251 | 443 | ||||||
| 2025-07-29 | 13F | Aire Advisors, Llc | 55,006 | 120.07 | 1,706 | 123.30 | ||||
| 2025-07-23 | 13F | Sax Wealth Advisors, Llc | 256,989 | 16.13 | 7,972 | 17.84 | ||||
| 2025-08-11 | 13F | Wescott Financial Advisory Group, LLC | 561,403 | 7.37 | 17,415 | 8.95 | ||||
| 2025-08-14 | 13F | DecisionPoint Financial, LLC | 1,207 | 0.00 | 38 | 2.78 | ||||
| 2025-08-12 | 13F | Vawter Financial, Ltd. | 0 | -100.00 | 0 | |||||
| 2025-08-05 | 13F | Cherry Tree Wealth Management, LLC | 1,089 | 0.00 | 34 | 0.00 | ||||
| 2025-08-12 | 13F | AlphaCore Capital LLC | 3,894 | 0.13 | 121 | 1.69 | ||||
| 2025-08-06 | 13F | Commonwealth Equity Services, Llc | 219,399 | 4.57 | 7 | 0.00 | ||||
| 2025-08-14 | 13F | C M Bidwell & Associates Ltd | 10,880 | 37.29 | 337 | 39.26 | ||||
| 2025-07-23 | 13F | Clear Creek Financial Management, LLC | 36,744 | 2.12 | 1,140 | 3.64 | ||||
| 2025-07-30 | 13F | Clune & Associates, Ltd. | 63,554 | 7.12 | 1,971 | 8.71 | ||||
| 2025-05-14 | 13F | Flow Traders U.s. Llc | 0 | -100.00 | 0 | |||||
| 2025-07-23 | 13F | L.K. Benson & Company, P.C. | 47,542 | 0.47 | 1,475 | 1.94 | ||||
| 2025-07-16 | 13F | TCI Wealth Advisors, Inc. | 187,965 | 65.38 | 5,831 | 67.82 | ||||
| 2025-07-03 | 13F | Collective Family Office Llc | 96,523 | 9.85 | 2,994 | 11.47 | ||||
| 2025-08-07 | 13F | Resources Investment Advisors, LLC. | 906,069 | -3.51 | 28,106 | -2.09 | ||||
| 2025-08-07 | 13F | Prudent Man Investment Management, Inc. | 240 | 0.00 | 7 | 0.00 | ||||
| 2025-08-13 | 13F | Northwestern Mutual Wealth Management Co | 3,242 | 214.45 | 101 | 222.58 | ||||
| 2025-08-14 | 13F | Ameriprise Financial Inc | 6,971 | 216 | ||||||
| 2025-08-14 | 13F | Mariner, LLC | 604,958 | 30.12 | 18,766 | 32.04 | ||||
| 2025-08-11 | 13F | Dorsey & Whitney Trust CO LLC | 23,149 | 0.81 | 718 | 2.43 | ||||
| 2025-05-12 | 13F | C2P Capital Advisory Group, LLC d.b.a. Prosperity Capital Advisors | 0 | -100.00 | 0 | -100.00 | ||||
| 2025-08-14 | 13F | Raymond James Financial Inc | 91,193 | -3.08 | 2,829 | -1.67 | ||||
| 2025-07-08 | 13F | Apella Capital, LLC | 980,236 | 36.22 | 30,760 | 48.11 | ||||
| 2025-07-14 | 13F | Sentinel Pension Advisors Inc | 159,445 | 4,946 | ||||||
| 2025-07-24 | 13F | Eastern Bank | 75,007 | -23.35 | 2,327 | -22.23 | ||||
| 2025-07-30 | 13F | Exencial Wealth Advisors, Llc | 673,910 | 18.08 | 20,905 | 19.81 | ||||
| 2025-08-13 | 13F | Beacon Pointe Advisors, LLC | 806,797 | 2.41 | 25,027 | 3.92 | ||||
| 2025-07-09 | 13F | Aurelius Family Office LLC | 9,115 | -0.32 | 283 | 1.08 | ||||
| 2025-07-29 | 13F | Chicago Partners Investment Group LLC | 396,169 | 0.40 | 12,662 | 9.81 | ||||
| 2025-08-14 | 13F | Wells Fargo & Company/mn | 0 | -100.00 | 0 | |||||
| 2025-08-14 | 13F | Pine Harbor Wealth Management, LLC | 83,825 | 10.62 | 2,600 | 12.26 | ||||
| 2025-07-14 | 13F | Foster Group, Inc. | 3,686,352 | 8.07 | 114,351 | 9.66 | ||||
| 2025-07-28 | 13F | Mitchell Mcleod Pugh & Williams Inc | 11,410 | 44.63 | 354 | 46.47 | ||||
| 2025-08-14 | 13F | Cardiff Park Advisors, Llc | 33,149 | 19.18 | 1,028 | 20.94 | ||||
| 2025-08-01 | 13F | Zhang Financial LLC | 56,975 | 98.80 | 1,767 | 101.71 | ||||
| 2025-08-13 | 13F | Cary Street Partners Financial Llc | 6,175 | 0.16 | 192 | 1.60 | ||||
| 2025-08-11 | 13F | Mosaic Family Wealth Partners, Llc | 2,901,838 | 2.96 | 90,015 | 4.48 | ||||
| 2025-07-25 | 13F | Concord Wealth Partners | 164 | 0.00 | 5 | 0.00 | ||||
| 2025-08-06 | 13F | Modera Wealth Management, LLC | 175,123 | 1.42 | 5,432 | 2.92 | ||||
| 2025-07-16 | 13F | RWM Asset Management, LLC | 947,175 | 0.46 | 29,381 | 1.94 | ||||
| 2025-08-08 | 13F | Avantax Advisory Services, Inc. | 1,773,795 | 2.73 | 55,023 | 4.24 | ||||
| 2025-08-14 | 13F | Susquehanna International Group, Llp | 20,672 | -36.52 | 641 | -35.58 | ||||
| 2025-07-14 | 13F | Lakeshore Financial Planning, Inc. | 507,954 | -15.03 | 15,757 | -13.78 | ||||
| 2025-07-30 | 13F | Mills Wealth Advisors LLC | 102,309 | 27.41 | 3,174 | 29.30 | ||||
| 2025-08-11 | 13F | Avantax Planning Partners, Inc. | 133,712 | 0.00 | 4,148 | 1.47 | ||||
| 2025-07-21 | 13F | Warner Financial, Inc | 12,660 | 0.47 | 0 | |||||
| 2025-07-24 | 13F | Drucker Wealth 3.0, LLC | 54,333 | 170.83 | 1,711 | 179.12 | ||||
| 2025-08-06 | 13F | Atlantic Union Bankshares Corp | 163,099 | 1,450.96 | 5,059 | 1,476.01 | ||||
| 2025-08-14 | 13F | Citadel Advisors Llc | Call | 11,000 | 71.88 | 341 | 74.87 | |||
| 2025-07-11 | 13F | Sprinkle Financial Consultants LLC | 121,105 | 32.84 | 3,757 | 34.82 | ||||
| 2025-07-22 | 13F | Berger Financial Group, Inc | 31,481 | 0.95 | 977 | 2.41 | ||||
| 2025-08-14 | 13F | Qube Research & Technologies Ltd | 5,105 | 471.03 | 158 | 485.19 | ||||
| 2025-08-01 | 13F | Fort Vancouver Investment Management, LLC | 206,564 | 26.54 | 6,408 | 28.40 | ||||
| 2025-07-29 | 13F | Werba Rubin Papier Wealth Management | 13,496 | -1.44 | 419 | 0.00 | ||||
| 2025-07-28 | 13F | Strategent Financial, LLC | 90,903 | 14.24 | 2,820 | 15.91 | ||||
| 2025-08-11 | 13F | Foundation Wealth Management, LLC\PA | 16,281 | 0.00 | 505 | 1.61 | ||||
| 2025-08-13 | 13F | GeoWealth Management, LLC | 9,301 | 0.00 | 289 | 1.41 | ||||
| 2025-05-13 | 13F | Brooklyn FI, LLC | 0 | -100.00 | 0 | -100.00 | ||||
| 2025-07-22 | 13F | Merit Financial Group, LLC | 162,652 | -13.53 | 5,045 | -12.26 | ||||
| 2025-07-17 | 13F | Oceanside Advisors LLC | 25,190 | 24.24 | 781 | 26.17 | ||||
| 2025-08-12 | 13F | Coldstream Capital Management Inc | 1,830,037 | 56,768 | ||||||
| 2025-08-14 | 13F | Colony Group, LLC | 232,725 | 60.74 | 7,219 | 63.14 | ||||
| 2025-07-31 | 13F | BIP Wealth, LLC | 80,638 | 15.60 | 2,501 | 17.31 | ||||
| 2025-08-14 | 13F | Aqr Capital Management Llc | 7,870 | 244 | ||||||
| 2025-07-15 | 13F | Kelly Financial Group Llc | 387,042 | 10.48 | 12,006 | 12.11 | ||||
| 2025-08-14 | 13F | Citadel Advisors Llc | 19,776 | -51.89 | 613 | -51.19 | ||||
| 2025-08-11 | 13F | Johnson Financial Group, LLC | 0 | -100.00 | 0 | |||||
| 2025-08-14 | 13F | Citadel Advisors Llc | Put | 17,400 | 540 | |||||
| 2025-08-04 | 13F | Spire Wealth Management | 17,310 | -20.34 | 537 | -19.28 | ||||
| 2025-08-11 | 13F | Private Advisor Group, LLC | 93,006 | 22.99 | 2,885 | 24.84 | ||||
| 2025-08-07 | 13F | Aegis Wealth Management LLC | 20,039 | 0.00 | 613 | 0.00 | ||||
| 2025-07-18 | 13F | GEN Financial Management, INC. | 60,665 | 5.37 | 1,882 | 6.94 | ||||
| 2025-08-08 | 13F | RAM Investment Partners, LLC | 9,351 | -7.53 | 290 | -6.15 | ||||
| 2025-07-23 | 13F | Austin Asset Management Co Inc | 403,310 | 16.82 | 12,511 | 18.53 | ||||
| 2025-08-13 | 13F | Vance Wealth, Inc. | 155,473 | 187.58 | 4,823 | 191.89 | ||||
| 2025-08-14 | 13F | Bank Of America Corp /de/ | 849,607 | 39.19 | 26,355 | 41.24 | ||||
| 2025-08-01 | 13F | Clark Asset Management, LLC | 0 | -100.00 | 0 | |||||
| 2025-08-14 | 13F | Mml Investors Services, Llc | 39,034 | 97.49 | 1 | |||||
| 2025-08-05 | 13F | Bank Of Montreal /can/ | 1,167,915 | 11.72 | 36,229 | 13.36 | ||||
| 2025-08-08 | 13F | Pinney & Scofield, Inc. | 109,168 | 8.03 | 3,386 | 9.61 | ||||
| 2025-07-15 | 13F | Total Wealth Planning, Llc | 986,879 | 12.01 | 30,613 | 13.66 | ||||
| 2025-08-12 | 13F | Burk Holdings LLC | 308,361 | 17.51 | 9,565 | 19.23 | ||||
| 2025-08-05 | 13F | Golden Bell Financial Planning LLC | 207,073 | 10.74 | 6,423 | 12.37 | ||||
| 2025-07-17 | 13F | Eclectic Associates Inc /adv | 248,324 | 75.56 | 7,703 | 78.16 | ||||
| 2025-07-16 | 13F | Strategic Investment Solutions, Inc. /IL | 79,853 | -42.35 | 2,477 | -41.50 | ||||
| 2025-08-11 | 13F | Root Financial Partners, LLC | 981,440 | 105.06 | 30,444 | 108.08 | ||||
| 2025-08-14 | 13F | Royal Bank Of Canada | 14,508 | 24.74 | 450 | 26.40 | ||||
| 2025-07-25 | 13F | LRI Investments, LLC | 197,594 | -1.17 | 6,129 | 0.28 | ||||
| 2025-08-08 | 13F | VeraBank, N.A. | 512,211 | 17.26 | 15,889 | 18.98 | ||||
| 2025-08-01 | 13F | PCA Investment Advisory Services Inc. | 52,746 | 3.33 | 1,636 | 4.87 | ||||
| 2025-07-16 | 13F | Essex Financial Services, Inc. | 78,921 | 6.91 | 2,448 | 8.51 | ||||
| 2025-08-14 | 13F | GWM Advisors LLC | 612,943 | -10.14 | 19,014 | -8.82 | ||||
| 2025-09-04 | 13F/A | Advisor Group Holdings, Inc. | 184,001 | 23.52 | 5,708 | 25.35 | ||||
| 2025-07-14 | 13F | Parkshore Wealth Management, Inc. | 16,428 | 1.68 | 510 | 3.25 | ||||
| 2025-08-07 | 13F | Allworth Financial LP | 280,243 | 4.61 | 8,693 | 11.86 | ||||
| 2025-07-10 | 13F | Wealth Enhancement Advisory Services, Llc | 1,091,263 | 12.61 | 34,593 | 16.77 | ||||
| 2025-07-30 | 13F | Avidian Wealth Solutions, LLC | 56,423 | 0.00 | 1,750 | 1.51 | ||||
| 2025-04-16 | 13F | Lam Group, Inc. | 0 | -100.00 | 0 | |||||
| 2025-07-23 | 13F | First Financial Group Corp | 107,322 | 17.39 | 3,329 | 19.15 | ||||
| 2025-08-04 | 13F | Linscomb & Williams, Inc. | 277,873 | 9.41 | 8,620 | 11.01 | ||||
| 2025-07-14 | 13F | AdvisorNet Financial, Inc | 3,163 | 0.48 | 98 | 2.08 | ||||
| 2025-07-23 | 13F | Wealth Management Nebraska | 10,636 | 329 | ||||||
| 2025-07-15 | 13F | Cordant, Inc. | 160,938 | 5.43 | 4,992 | 6.99 | ||||
| 2025-08-07 | 13F | Addison Advisors LLC | 1,810 | -52.18 | 56 | -51.30 | ||||
| 2025-07-17 | 13F | SC&H Financial Advisors, Inc. | 61,946 | 21.55 | 1,922 | 23.38 | ||||
| 2025-07-18 | 13F | PBMares Wealth Management LLC | 11,766 | 34.76 | 365 | 36.84 | ||||
| 2025-07-25 | 13F | Cwm, Llc | 5,507 | 243.12 | 0 | |||||
| 2025-08-14 | 13F | EP Wealth Advisors, Inc. | 7,789,534 | 20.34 | 241,631 | 22.11 | ||||
| 2025-08-11 | 13F | WPWealth LLP | 1,136,750 | -24.28 | 35,262 | -23.17 | ||||
| 2025-07-10 | 13F | Exchange Traded Concepts, Llc | 378 | 12 | ||||||
| 2025-07-18 | 13F | Naples Global Advisors, Llc | 16,788 | 0.00 | 521 | 1.36 | ||||
| 2025-07-30 | 13F | Phillips Financial Management, Llc | 1,314,950 | 6.33 | 40,790 | 7.90 | ||||
| 2025-07-31 | 13F | Buckingham Strategic Partners | 95,156 | 102.34 | 2,952 | 105.36 | ||||
| 2025-07-03 | 13F | Fiduciary Financial Group, Llc | 219,547 | 4.17 | 6,909 | 17.58 | ||||
| 2025-07-28 | 13F | Eq Wealth Advisors, Llc | 14,831 | -89.99 | 460 | -89.84 | ||||
| 2025-07-25 | 13F | Wealth Architects, LLC | 575,555 | -2.00 | 17,854 | -0.56 | ||||
| 2025-07-25 | 13F | Index Fund Advisors, Inc. | 1,068,530 | 8.90 | 33,146 | 10.51 | ||||
| 2025-07-17 | 13F | Vermillion Wealth Management, Inc. | 610 | 17.99 | 19 | 20.00 | ||||
| 2025-07-29 | NP | EBI - Longview Advantage ETF | 0 | -100.00 | 0 | -100.00 | ||||
| 2025-07-14 | 13F | ABLE Financial Group, LLC | 10,391 | 322 | ||||||
| 2025-07-16 | 13F | Blue Oak Capital, LLC | 213,277 | -21.07 | 6,616 | -19.92 | ||||
| 2025-08-13 | 13F | M Holdings Securities, Inc. | 35,694 | 1 | ||||||
| 2025-07-16 | 13F | Formidable Asset Management, LLC | 15,865 | 0.00 | 485 | 0.00 | ||||
| 2025-04-15 | 13F | Corrigan Financial, Inc. | 948,486 | 52.51 | 28,995 | 55.26 | ||||
| 2025-08-14 | 13F | Warren Averett Asset Management, LLC | 189,077 | -4.04 | 5,865 | -2.62 | ||||
| 2025-08-04 | 13F | McMill Wealth Management | 47,498 | -0.07 | 1,471 | 1.24 | ||||
| 2025-08-12 | 13F | Pathstone Holdings, LLC | 2,620,224 | 0.71 | 81,279 | 2.20 | ||||
| 2025-07-21 | 13F | Family CFO Inc | 6,904 | 0.00 | 214 | 1.42 | ||||
| 2025-08-12 | 13F | CIBC Private Wealth Group, LLC | 0 | -100.00 | 0 | |||||
| 2025-07-15 | 13F | Vannoy Advisory Group, Inc. | 75,242 | 3.32 | 2,334 | 4.85 | ||||
| 2025-07-18 | 13F | Parkwoods Wealth Partners, LLC | 16,816 | 522 | ||||||
| 2025-08-07 | 13F | Vise Technologies, Inc. | 7,536 | 234 | ||||||
| 2025-08-15 | 13F | Equitable Holdings, Inc. | 53,437 | 38.03 | 1,658 | 40.07 | ||||
| 2025-08-14 | 13F | Fmr Llc | 1,572 | -13.63 | 49 | -12.73 | ||||
| 2025-07-25 | 13F | Acorn Creek Capital Llc | 749,894 | 21.04 | 23,262 | 22.83 | ||||
| 2025-08-11 | 13F | FineMark National Bank & Trust | 58,609 | 40.28 | 1,818 | 42.36 | ||||
| 2025-08-12 | 13F | Legacy Financial Group, Inc. | 228,760 | 12.66 | 7,096 | 14.32 | ||||
| 2025-07-16 | 13F | Vestia Personal Wealth Advisors | 51,131 | 20.80 | 1,586 | 22.66 | ||||
| 2025-08-06 | 13F | Cannon Financial Strategists, Inc. | 44,000 | 1,365 | ||||||
| 2025-07-09 | 13F | GEM Asset Management, LLC | 116,794 | 15.63 | 3,665 | 18.96 | ||||
| 2025-08-12 | 13F | SRS Capital Advisors, Inc. | 119,307 | -1.65 | 3,701 | -0.22 | ||||
| 2025-07-28 | 13F | Morris Financial Concepts, Inc. | 66,652 | 12.82 | 2,068 | 14.45 | ||||
| 2025-08-08 | 13F | Tortoise Investment Management, LLC | 11,807 | -23.51 | 366 | -22.29 | ||||
| 2025-08-12 | 13F | Tumwater Wealth Management, LLC | 852,008 | 4.88 | 26,429 | 6.43 | ||||
| 2025-08-05 | 13F | Sensible Money, LLC | 14,335 | 0.42 | 445 | 1.83 | ||||
| 2025-08-14 | 13F | Seneschal Advisors, LLC | 20,765 | 47.02 | 644 | 49.42 | ||||
| 2025-07-10 | 13F | Fortress Wealth Management, Inc. | 26,090 | 248.61 | 809 | 254.82 | ||||
| 2025-08-11 | 13F | CFS Investment Advisory Services, LLC | 14,605 | 0.00 | 0 | |||||
| 2025-08-01 | 13F | SYM FINANCIAL Corp | 12,497 | -0.61 | 388 | 0.78 | ||||
| 2025-07-17 | 13F | Summit Financial Strategies, Inc. | 1,913,371 | 5.31 | 59,353 | 6.86 | ||||
| 2025-05-02 | 13F | Cable Hill Partners, LLC | 1,774,258 | 4.33 | 51,595 | 1.03 | ||||
| 2025-05-05 | 13F | Keyes, Stange & Wooten Wealth Management, LLC | 0 | -100.00 | 0 | -100.00 | ||||
| 2025-07-18 | 13F | TruNorth Capital Management, LLC | 359 | 0.00 | 11 | 10.00 | ||||
| 2025-08-11 | 13F | Ritter Daniher Financial Advisory LLC / DE | 6 | 0 | ||||||
| 2025-08-08 | 13F | Larson Financial Group LLC | 212,612 | -9.49 | 6,595 | -8.16 | ||||
| 2025-07-15 | 13F | Optima Capital Llc | 18,500 | 0.00 | 574 | 1.42 | ||||
| 2025-08-13 | 13F | Parkworth Wealth Management, Inc. | 4,848 | 150 | ||||||
| 2025-08-12 | 13F | Steward Partners Investment Advisory, Llc | 2,907 | -92.28 | 90 | -92.18 | ||||
| 2025-08-13 | 13F | Tobias Financial Advisors, Inc. | 457,843 | -3.42 | 14,202 | -1.99 | ||||
| 2025-08-13 | 13F | American Investment Services, Inc. | 101,010 | -9.94 | 3,133 | -8.61 | ||||
| 2025-07-25 | 13F | Ruedi Wealth Management, Inc. | 226,261 | -29.24 | 7,019 | -28.20 | ||||
| 2025-07-22 | 13F | Capital Advisors Inc/ok | 7,844 | 243 | ||||||
| 2025-08-05 | 13F | Simplex Trading, Llc | 58 | 0 | ||||||
| 2025-07-17 | 13F | Willow Creek Wealth Management Inc. | 32,954 | 157.37 | 1,022 | 161.38 | ||||
| 2025-07-29 | 13F | Wealthstream Advisors, Inc. | 7,225 | 0.47 | 224 | 2.28 | ||||
| 2025-07-31 | 13F | Glass Jacobson Investment Advisors llc | 90,229 | -1.56 | 2,799 | 1.67 | ||||
| 2025-07-14 | 13F | Park Avenue Securities Llc | 121,100 | 4 | ||||||
| 2025-07-28 | 13F | RFG Advisory, LLC | 316,789 | -31.94 | 9,827 | -30.94 | ||||
| 2025-08-13 | 13F | Lauer Wealth, LLC | 0 | -100.00 | 0 | |||||
| 2025-08-13 | 13F | Momentous Wealth Management, Inc. | 203,671 | 6.31 | 6,318 | 7.87 | ||||
| 2025-07-09 | 13F | Dynamic Advisor Solutions LLC | 10,916 | 339 | ||||||
| 2025-07-30 | 13F | Forum Financial Management, LP | 18,721 | -1.91 | 581 | -0.51 | ||||
| 2025-07-31 | 13F | LJI Wealth Management, LLC | 32,130 | -3.32 | 997 | -1.87 | ||||
| 2025-08-14 | 13F | Investmark Advisory Group LLC | 87,015 | 12.06 | 2,699 | 13.74 | ||||
| 2025-07-14 | 13F | Infinity Wealth Counsel, LLC | 20,549 | 2.81 | 637 | 4.26 | ||||
| 2025-08-14 | 13F | Quantinno Capital Management LP | 25,556 | 124.39 | 793 | 127.59 | ||||
| 2025-05-15 | 13F | Mercer Global Advisors Inc /adv | 0 | -100.00 | 0 | |||||
| 2025-07-17 | 13F | Elser Financial Planning, Inc | 8,151 | 253 | ||||||
| 2025-08-15 | 13F | Captrust Financial Advisors | 41,368 | 4.76 | 1,283 | 6.30 | ||||
| 2025-08-07 | 13F | Tilson Financial Group, Inc. | 723,818 | -4.22 | 22 | -4.35 | ||||
| 2025-08-13 | 13F | Rsm Us Wealth Management Llc | 25,273 | 72.83 | 784 | 75.17 | ||||
| 2025-07-21 | 13F | Triad Wealth Partners, LLC | 14,721 | 118.25 | 457 | 121.36 | ||||
| 2025-07-21 | 13F | Quent Capital, LLC | 1,058,596 | -8.18 | 32,838 | -6.83 | ||||
| 2025-07-15 | 13F | Evanson Asset Management, LLC | 436,327 | 0.82 | 13,535 | 2.30 | ||||
| 2025-07-30 | 13F | EnRich Financial Partners LLC | 937,615 | -2.81 | 29,085 | -1.38 | ||||
| 2025-07-15 | 13F | Bfsg, Llc | 113,077 | 3.15 | 3,508 | 4.66 | ||||
| 2025-07-24 | 13F | Vantage Point Financial LLC | 100,250 | 0.85 | 3,110 | 2.34 | ||||
| 2025-08-15 | 13F | Morgan Stanley | 7,598 | 74.47 | 236 | 76.69 | ||||
| 2025-08-12 | 13F | Quadcap Wealth Management, LLC | 12,305 | 1.00 | 382 | 2.42 | ||||
| 2025-08-14 | 13F | D. E. Shaw & Co., Inc. | 8,045 | 250 | ||||||
| 2025-07-22 | 13F | Hill Island Financial Llc | 566,242 | -0.91 | 17,565 | 0.55 | ||||
| 2025-07-24 | 13F | IFP Advisors, Inc | 14,364 | -11.96 | 446 | -10.64 | ||||
| 2025-07-16 | 13F | BOS Asset Management, LLC | 351,753 | 3.10 | 10,911 | 4.62 | ||||
| 2025-08-13 | 13F | Providence Capital Advisors, LLC | 849 | 26 | ||||||
| 2025-07-31 | 13F | Curio Wealth, Llc | 20,219 | 48,040.48 | 627 | 16.11 | ||||
| 2025-07-14 | 13F | S.A. Mason LLC | 2,853 | 0.00 | 88 | 1.15 | ||||
| 2025-07-17 | 13F | DiNuzzo Private Wealth, Inc. | 1,818,553 | 1.70 | 56,412 | 3.19 | ||||
| 2025-07-16 | 13F | Perigon Wealth Management, LLC | 21,275 | 28.02 | 660 | 29.72 | ||||
| 2025-07-23 | 13F | Mraz, Amerine & Associates, Inc. | 63,699 | -12.53 | 1,976 | -10.43 | ||||
| 2025-07-21 | 13F | Matauro, Llc | 0 | -100.00 | 0 | |||||
| 2025-08-06 | 13F | Savant Capital, LLC | 13,169,045 | 39.25 | 408,504 | 41.30 | ||||
| 2025-07-10 | 13F | Pacific Asset Management, LLC | 6,650 | 0.29 | 206 | 1.98 | ||||
| 2025-07-16 | 13F | Plancorp, LLC | 121,657 | 167.20 | 3,774 | 171.24 | ||||
| 2025-04-17 | 13F | Scratch Capital Llc | 0 | -100.00 | 0 | |||||
| 2025-08-14 | 13F | McIlrath & Eck, LLC | 2,409 | 2.29 | 75 | 4.23 | ||||
| 2025-08-14 | 13F | Stifel Financial Corp | 171,724 | 58.82 | 5,327 | 61.15 | ||||
| 2025-08-12 | 13F | Martin Worley Group | 309,250 | 16.10 | 9,593 | 17.81 | ||||
| 2025-08-07 | 13F | Parkside Financial Bank & Trust | 2,109 | 0.00 | 65 | 1.56 | ||||
| 2025-07-30 | 13F | Canvas Wealth Advisors, LLC | 9,389 | 0.00 | 299 | 12.03 | ||||
| 2025-08-14 | 13F | Betterment LLC | 603,824 | 20.45 | 19 | 20.00 | ||||
| 2025-08-12 | 13F | Proequities, Inc. | 0 | 0 | ||||||
| 2025-08-06 | 13F | Cloud Capital Management, LLC | 11,678 | 351.76 | 0 | |||||
| 2025-08-13 | 13F | Lido Advisors, LLC | 69,887 | 2,168 | ||||||
| 2025-08-14 | 13F | Premier Financial Group | 1,125,404 | 35,551 | ||||||
| 2025-07-30 | 13F | Studio Investment Management Llc | 145,873 | 3.40 | 4,525 | 4.92 | ||||
| 2025-08-06 | 13F | Longview Financial Advisors LLC | 191,161 | 4.04 | 5,930 | 5.57 | ||||
| 2025-08-19 | 13F | Asset Dedication, LLC | 14,335 | 0.42 | 445 | 1.83 | ||||
| 2025-07-21 | 13F | Keb Asset Management, Llc | 8,467 | 0.00 | 263 | 1.55 | ||||
| 2025-07-15 | 13F | Retirement Guys Formula Llc | 52,829 | -1.67 | 1,639 | -0.24 | ||||
| 2025-08-01 | 13F | Advisory Alpha, LLC | 356,569 | 5.43 | 11,061 | 6.97 | ||||
| 2025-08-07 | 13F | Compass Financial Group, Inc. | 78,866 | 11.52 | 2,446 | 13.19 | ||||
| 2025-07-29 | 13F | Wingate Wealth Advisors, Inc. | 14,376 | 0.47 | 446 | 1.83 | ||||
| 2025-08-06 | 13F | Paladin Advisory Group, LLC | 0 | -100.00 | 0 | |||||
| 2025-07-31 | 13F | Schoolcraft Capital LLC | 389,986 | -16.19 | 12,097 | -14.95 | ||||
| 2025-08-01 | 13F | Liberty Wealth Management Llc | 397,919 | -1.85 | 12,348 | -0.36 | ||||
| 2025-08-14 | 13F | Sterling Wealth Management, Inc. | 287,887 | 11.59 | 8,930 | 15.27 | ||||
| 2025-07-09 | 13F | Emprise Bank | 33,945 | -1.59 | 1,053 | -0.19 | ||||
| 2025-07-24 | 13F | FinDec Wealth Services, Inc. | 373,645 | -4.38 | 11,590 | -2.97 | ||||
| 2025-08-08 | 13F | Creative Planning | 37,544 | -35.14 | 1,165 | -34.20 | ||||
| 2025-08-11 | 13F | Diversified Portfolios, Inc. | 652,553 | 6.26 | 20,242 | 7.83 | ||||
| 2025-07-14 | 13F | Acropolis Investment Management, LLC | 755,117 | 0.51 | 23,424 | 1.99 | ||||
| 2025-08-08 | 13F | Austin Wealth Management, LLC | 24,209 | 758 | ||||||
| 2025-08-06 | 13F | Summit Wealth Group, LLC | 97,288 | 3 | ||||||
| 2025-08-11 | 13F | Oder Investment Management, LLC | 11,994 | 52.83 | 372 | 55.65 | ||||
| 2025-07-07 | 13F | RB Capital Management, LLC | 10,528 | 4.27 | 327 | 5.84 | ||||
| 2025-07-15 | 13F | Fortitude Family Office, LLC | 22,512 | 698 | ||||||
| 2025-08-11 | 13F | TAGStone Capital, Inc. | 13,365 | 4.67 | 419 | |||||
| 2025-07-29 | 13F | Disciplined Investments, LLC | 314,162 | 24.16 | 9,745 | 25.99 | ||||
| 2025-07-31 | 13F | Cambridge Investment Research Advisors, Inc. | 31,351 | 15.67 | 1 | |||||
| 2025-08-07 | 13F | Panoramic Investment Advisors, Llc | 88,653 | 1.45 | 2,750 | 2.96 | ||||
| 2025-07-17 | 13F | Avondale Wealth Management | 0 | -100.00 | 0 | |||||
| 2025-07-23 | 13F | Elevate Wealth Advisory, Inc | 106,355 | -3.01 | 3,299 | -1.58 | ||||
| 2025-07-17 | 13F | Global Trust Asset Management, LLC | 1,043 | 12.27 | 32 | 14.29 | ||||
| 2025-08-14 | 13F | Hilltop Holdings Inc. | 9,698 | 0.00 | 301 | 1.35 | ||||
| 2025-08-15 | 13F | Tower Research Capital LLC (TRC) | 6,487 | -49.13 | 201 | -48.33 | ||||
| 2025-04-08 | 13F | Parallel Advisors, LLC | 0 | -100.00 | 0 |