Mga Batayang Estadistika
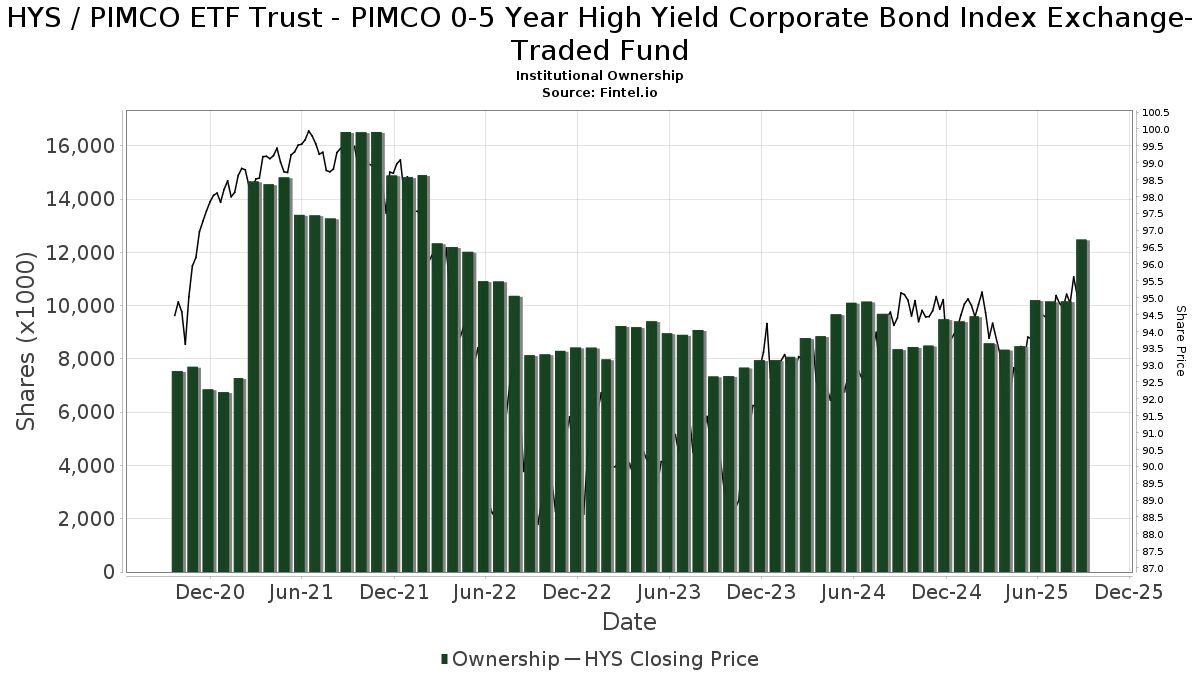
| Pemilik Institusional | 226 total, 226 long only, 0 short only, 0 long/short - change of -7.32% MRQ |
| Alokasi Portofolio Rata-rata | 0.3922 % - change of -17.15% MRQ |
| Saham Institusional (Jangka Panjang) | 12,442,240 (ex 13D/G) - change of 2.24MM shares 21.92% MRQ |
| Nilai Institusional (Jangka Panjang) | $ 862,207 USD ($1000) |
Kepemilikan Institusional dan Pemegang Saham
PIMCO ETF Trust - PIMCO 0-5 Year High Yield Corporate Bond Index Exchange-Traded Fund (US:HYS) memiliki 226 pemilik institusional dan pemegang saham yang telah mengajukan formulir 13D/G atau 13F kepada Komisi Bursa Efek (Securities Exchange Commission/SEC). Lembaga-lembaga ini memegang total 12,442,240 saham. Pemegang saham terbesar meliputi Proficio Capital Partners LLC, Allianz Asset Management GmbH, Morgan Stanley, Assetmark, Inc, BOND - PIMCO Active Bond Exchange-Traded Fund, Envestnet Asset Management Inc, Jpmorgan Chase & Co, Pnc Financial Services Group, Inc., Mid-American Wealth Advisory Group, Inc., and LPL Financial LLC .
Struktur kepemilikan institusional PIMCO ETF Trust - PIMCO 0-5 Year High Yield Corporate Bond Index Exchange-Traded Fund (ARCA:HYS) menunjukkan posisi terkini di perusahaan oleh institusi dan dana, serta perubahan terbaru dalam ukuran posisi. Pemegang saham utama dapat mencakup investor individu, reksa dana, dana lindung nilai, atau institusi. Jadwal 13D menunjukkan bahwa investor memegang (atau pernah memegang) lebih dari 5% saham perusahaan dan bermaksud (atau pernah bermaksud) untuk secara aktif mengejar perubahan strategi bisnis. Jadwal 13G menunjukkan investasi pasif lebih dari 5%.
The share price as of September 5, 2025 is 95.37 / share. Previously, on September 9, 2024, the share price was 94.36 / share. This represents an increase of 1.07% over that period.
Skor Sentimen Dana
Skor Sentimen Dana (sebelumnya dikenal sebagai Skor Akumulasi Kepemilikan) menemukan saham-saham yang paling banyak dibeli oleh dana. Ini adalah hasil dari model kuantitatif multi-faktor yang canggih yang mengidentifikasi perusahaan dengan tingkat akumulasi institusional tertinggi. Model penilaian menggunakan kombinasi dari total peningkatan pemilik yang diungkapkan, perubahan dalam alokasi portofolio pada pemilik tersebut, dan metrik lainnya. Angka berkisar dari 0 hingga 100, dengan angka yang lebih tinggi menunjukkan tingkat akumulasi yang lebih tinggi dibandingkan dengan perusahaan sejenisnya, dan 50 adalah rata-ratanya.
Frekuensi Pembaruan: Setiap Hari
Lihat Ownership Explorer, yang menyediakan daftar perusahaan dengan peringkat tertinggi.
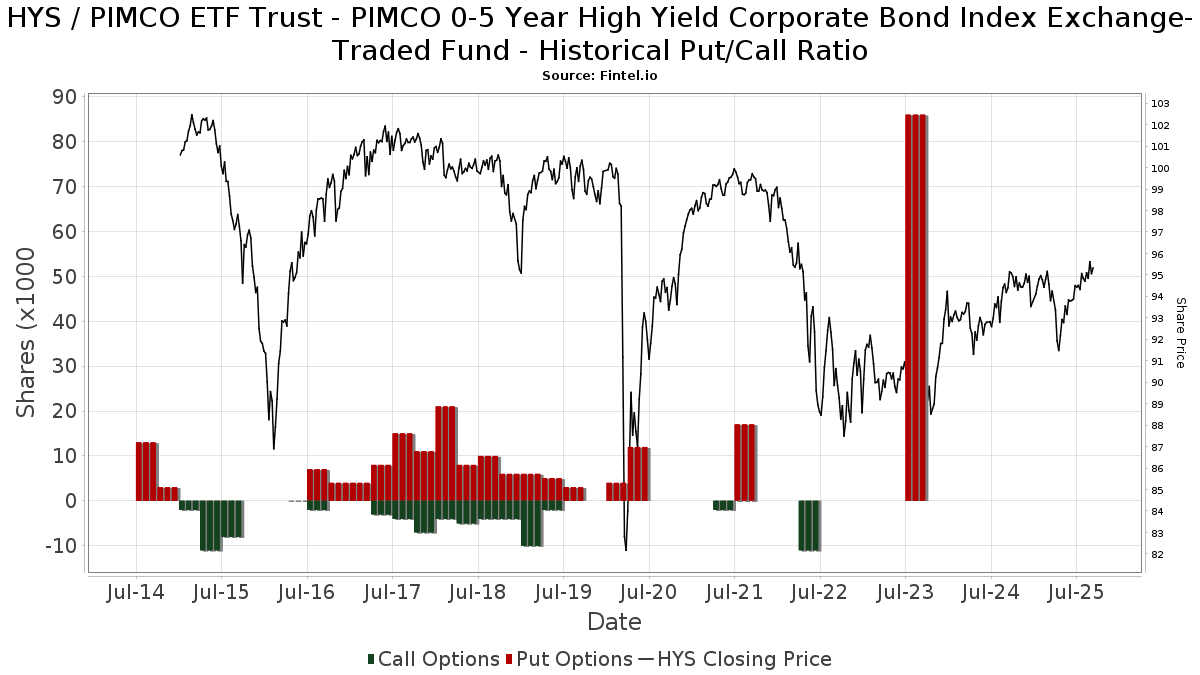
Rasio Put/Call Institusional
Selain melaporkan isu ekuitas dan utang standar, institusi dengan aset di bawah manajemen lebih dari 100 juta dolar AS juga harus mengungkapkan kepemilikan opsi put dan call mereka. Karena opsi put umumnya menunjukkan sentimen negatif, dan opsi call menunjukkan sentimen positif, kita dapat mengetahui sentimen institusional secara keseluruhan dengan memplot rasio put terhadap call. Grafik di sebelah kanan memplot rasio put/call historis untuk instrumen ini.
Menggunakan Rasio Put/Call sebagai indikator sentimen investor mengatasi salah satu kekurangan utama dari penggunaan total kepemilikan institusional, yaitu sejumlah besar aset yang dikelola diinvestasikan secara pasif untuk melacak indeks. Dana yang dikelola secara pasif biasanya tidak membeli opsi, sehingga indikator rasio put/call lebih akurat dalam melacak sentimen dana yang dikelola secara aktif.
Pengajuan 13D/G
Kami menyajikan pengajuan 13D/G secara terpisah dari pengajuan 13F karena perlakuan yang berbeda oleh SEC. Pengajuan 13D/G dapat diajukan oleh kelompok investor (dengan satu pemimpin), sedangkan pengajuan 13F tidak bisa. Hal ini mengakibatkan situasi di mana seorang investor dapat mengajukan 13D/G yang melaporkan satu nilai untuk total saham (mewakili semua saham yang dimiliki oleh kelompok investor), tetapi kemudian mengajukan 13F yang melaporkan nilai yang berbeda untuk total saham (mewakili kepemilikan mereka sendiri). Ini berarti bahwa kepemilikan saham dari pengajuan 13D/G dan pengajuan 13F seringkali tidak dapat dibandingkan secara langsung, sehingga kami menyajikannya secara terpisah.
Catatan: Mulai 16 Mei 2021, kami tidak lagi menampilkan pemilik yang belum mengajukan 13D/G dalam setahun terakhir. Sebelumnya, kami menampilkan riwayat lengkap pengajuan 13D/G. Secara umum, entitas yang diwajibkan untuk mengajukan pengajuan 13D/G harus mengajukan setidaknya setiap tahun sebelum mengirimkan pengajuan penutupan. Namun, terkadang dana keluar dari posisi tanpa mengirimkan pengajuan penutupan (misalnya, mereka menghentikan operasi), sehingga menampilkan riwayat lengkap terkadang menyebabkan kebingungan tentang kepemilikan saat ini. Untuk mencegah kebingungan, kami sekarang hanya menampilkan pemilik 'saat ini' - yaitu - pemilik yang telah mengajukan dalam setahun terakhir.
Upgrade to unlock premium data.
| Tanggal File | Formulir | Investor | Sebelumnya Saham |
Terbaru Saham |
Δ Saham (Persen) |
Kepemilikan (Persen) |
Δ Pagmamay-ari (Persen) |
|
|---|---|---|---|---|---|---|---|---|
| 2025-04-23 | FIRST TRUST PORTFOLIOS LP | 949,932 | 5.97 |
Pengajuan 13F dan NPORT
Detail pada pengajuan 13F tersedia gratis. Detail pada pengajuan NP memerlukan keanggotaan premium. Baris berwarna hijau menunjukkan posisi baru. Baris berwarna merah menunjukkan posisi yang sudah ditutup. Klik tautan ini ikon untuk melihat riwayat transaksi selengkapnya.
Tingkatkan
untuk membuka data premium dan mengekspor ke Excel ![]() .
.
| Tanggal File | Sumber | Investor | Ketik | Presyo ng Avg (Silangan) |
Saham | Δ Saham (%) |
Dilaporkan Nilai ($1000) |
Nilai Δ (%) |
Alokasi Port (%) |
|
|---|---|---|---|---|---|---|---|---|---|---|
| 2025-08-19 | 13F | Cape Investment Advisory, Inc. | 133 | 2.31 | 13 | 0.00 | ||||
| 2025-08-13 | 13F | Scotia Capital Inc. | 0 | -100.00 | 0 | |||||
| 2025-08-13 | 13F | Kayne Anderson Rudnick Investment Management Llc | 6,467 | 9.80 | 613 | 11.25 | ||||
| 2025-07-18 | 13F | Consolidated Portfolio Review Corp | 2,189 | 1.72 | 208 | 2.99 | ||||
| 2025-08-04 | 13F | Assetmark, Inc | 644,813 | -2.13 | 61,264 | -0.72 | ||||
| 2025-08-14 | 13F | Royal Bank Of Canada | 184,724 | 1.28 | 17,551 | 2.74 | ||||
| 2025-08-07 | 13F | Resources Investment Advisors, LLC. | 216,890 | 20.03 | 20,607 | 21.76 | ||||
| 2025-08-08 | 13F | TD Capital Management LLC | 586 | 56 | ||||||
| 2025-07-25 | 13F | Concurrent Investment Advisors, LLC | 27,945 | 3.11 | 2,655 | 4.61 | ||||
| 2025-08-12 | 13F | Viawealth, Llc | 18,128 | -8.00 | 1,722 | -6.67 | ||||
| 2025-08-14 | 13F | UBS Group AG | 215,039 | -35.97 | 20,431 | -35.05 | ||||
| 2025-07-28 | 13F | Allianz Asset Management GmbH | 707,506 | -7.42 | 67,220 | -6.09 | ||||
| 2025-08-07 | 13F | Allworth Financial LP | 1,978 | -0.30 | 188 | 1.63 | ||||
| 2025-07-24 | 13F | Us Bancorp \de\ | 5,445 | 0.00 | 517 | 1.57 | ||||
| 2025-08-01 | 13F | Boyd Watterson Asset Management Llc/oh | 0 | -100.00 | 0 | |||||
| 2025-08-13 | 13F | Johnson Financial Group, Inc. | 951 | -17.38 | 90 | -15.89 | ||||
| 2025-08-13 | 13F/A | StoneX Group Inc. | 45,825 | 4,409 | ||||||
| 2025-08-08 | 13F | Cetera Investment Advisers | 267,732 | 1.48 | 25,437 | 2.95 | ||||
| 2025-08-14 | 13F | Helium Advisors LLC | 3,623 | -1.58 | 344 | 0.00 | ||||
| 2025-08-14 | 13F | Great Valley Advisor Group, Inc. | 58,459 | 5,555 | ||||||
| 2025-07-21 | 13F | TFG Advisers LLC | 7,030 | 3.14 | 668 | 4.55 | ||||
| 2025-08-05 | 13F | Huntington National Bank | 3,806 | -0.34 | ||||||
| 2025-07-25 | 13F | Richardson Financial Services Inc. | 6,760 | -14.66 | 637 | -14.04 | ||||
| 2025-07-24 | 13F | Ronald Blue Trust, Inc. | 46 | 0.00 | 4 | 0.00 | ||||
| 2025-08-06 | 13F | Legacy Investment Solutions, LLC | 23 | 0.00 | 2 | 0.00 | ||||
| 2025-07-22 | 13F | Merit Financial Group, LLC | 20,776 | -43.18 | 1,974 | -42.38 | ||||
| 2025-05-22 | 13F | Mattson Financial Services, LLC | 0 | -100.00 | 0 | |||||
| 2025-08-11 | 13F | Howard Wealth Management, Llc | 8,460 | 10.17 | 804 | 11.68 | ||||
| 2025-08-14 | 13F | Mml Investors Services, Llc | 22,131 | -26.97 | 2 | 0.00 | ||||
| 2025-08-14 | 13F | Wiley Bros.-aintree Capital, Llc | 8,863 | 9.88 | 790 | 4.64 | ||||
| 2025-08-14 | 13F | Sunbelt Securities, Inc. | 45 | 0.00 | 4 | 0.00 | ||||
| 2025-07-24 | 13F | Blair William & Co/il | 499 | 54.01 | 47 | 56.67 | ||||
| 2025-08-13 | 13F | Gateway Wealth Partners, LLC | 3,267 | -25.29 | 310 | -24.21 | ||||
| 2025-08-14 | 13F | Jane Street Group, Llc | 0 | -100.00 | 0 | |||||
| 2025-08-14 | 13F | Raymond James Financial Inc | 76,384 | 6.22 | 7,257 | 7.75 | ||||
| 2025-08-05 | 13F | Intellectus Partners, LLC | 6,921 | 1.51 | 658 | 2.98 | ||||
| 2025-08-07 | 13F | Compass Financial Group, Inc. | 26,774 | -1.13 | 2,544 | 0.28 | ||||
| 2025-07-22 | 13F | Valeo Financial Advisors, LLC | 5,275 | 0.00 | 501 | 1.42 | ||||
| 2025-07-22 | 13F | Beacon Financial Advisory LLC | 2,754 | 1.40 | 262 | 2.76 | ||||
| 2025-08-14 | 13F | Osterweis Capital Management Inc | 510 | 1.59 | ||||||
| 2025-07-29 | 13F | Financial Futures Ltd Liability Co. | 5,425 | -52.59 | 515 | -51.91 | ||||
| 2025-08-04 | 13F | IFG Advisory, LLC | 13,256 | 16.56 | 1,259 | 18.22 | ||||
| 2025-08-11 | 13F | Principal Securities, Inc. | 105 | 26.51 | 10 | 28.57 | ||||
| 2025-07-07 | 13F | Wesbanco Bank Inc | 19,968 | 1,897 | ||||||
| 2025-08-11 | 13F | TD Waterhouse Canada Inc. | 10,388 | 12.01 | 980 | 13.29 | ||||
| 2025-08-06 | 13F | Hoxton Planning & Management, LLC | 5,531 | -41.54 | 526 | -40.74 | ||||
| 2025-08-14 | 13F | Stifel Financial Corp | 51,266 | -7.87 | 4,870 | -6.54 | ||||
| 2025-07-29 | 13F | Financial Synergies Wealth Advisors, Inc. | 3,796 | 29.82 | 361 | 31.87 | ||||
| 2025-08-01 | NP | OTRFX - OnTrack Core Fund Investor Class Shares | 0 | -100.00 | 0 | -100.00 | ||||
| 2025-08-14 | 13F | Bank Of America Corp /de/ | 150,398 | -7.41 | 14,289 | -6.07 | ||||
| 2025-08-26 | 13F/A | Thrivent Financial For Lutherans | 0 | -100.00 | 0 | -100.00 | ||||
| 2025-08-08 | 13F | Capital Investment Advisory Services, LLC | 1,269 | 17.94 | 121 | 20.00 | ||||
| 2025-08-14 | 13F | Mercer Global Advisors Inc /adv | 5,455 | 1.26 | 518 | 2.78 | ||||
| 2025-05-29 | NP | TFAZX - TFA Tactical Income Fund Class I | 0 | -100.00 | 0 | -100.00 | ||||
| 2025-07-23 | 13F | Nbt Bank N A /ny | 1,885 | 0.00 | 179 | 1.70 | ||||
| 2025-08-07 | 13F | BHK Investment Advisors, LLC | 41,850 | 1.95 | 3,976 | 3.43 | ||||
| 2025-08-13 | 13F | Financial & Tax Architects, LLC | 35,400 | -3.62 | 3,363 | -2.21 | ||||
| 2025-08-14 | 13F | Federation des caisses Desjardins du Quebec | 223 | 0.00 | 21 | 5.00 | ||||
| 2025-08-29 | NP | BOND - PIMCO Active Bond Exchange-Traded Fund | 582,979 | -8.87 | 55,389 | -7.56 | ||||
| 2025-07-08 | 13F | RMR Wealth Builders | 159,615 | 7.28 | 15,165 | 8.83 | ||||
| 2025-07-25 | 13F | Northwest Capital Management Inc | 108 | 0.93 | 10 | 0.00 | ||||
| 2025-07-17 | 13F | Coastline Trust Co | 30,821 | 0.00 | 2,928 | 1.46 | ||||
| 2025-05-15 | 13F | Barclays Plc | 0 | -100.00 | 0 | -100.00 | ||||
| 2025-08-06 | 13F | Csenge Advisory Group | 2,365 | -13.34 | 222 | -11.55 | ||||
| 2025-08-14 | 13F | Wells Fargo & Company/mn | 162,796 | 14.59 | 15,467 | 16.25 | ||||
| 2025-07-17 | 13F | Sound Income Strategies, LLC | 44 | 4 | ||||||
| 2025-07-09 | 13F | Burt Wealth Advisors | 4,982 | 8.30 | 473 | 10.00 | ||||
| 2025-08-04 | 13F | Atria Investments Llc | 0 | -100.00 | 0 | |||||
| 2025-08-08 | 13F | Kane Investment Management, Inc. | 5,720 | 3.74 | 546 | 5.62 | ||||
| 2025-08-15 | 13F | Tower Research Capital LLC (TRC) | 42 | 4 | ||||||
| 2025-08-04 | 13F | Pensionmark Financial Group, Llc | 7,209 | -8.18 | 685 | -6.94 | ||||
| 2025-04-16 | 13F | New Century Financial Group, LLC | 0 | -100.00 | 0 | |||||
| 2025-07-18 | 13F | Bartlett & Co. Wealth Management Llc | 300 | 0.00 | 29 | 0.00 | ||||
| 2025-08-14 | 13F | Advisor OS, LLC | 3,973 | 0.00 | 377 | 1.34 | ||||
| 2025-08-07 | 13F | Curtis Advisory Group, LLC | 11,003 | 9.10 | 1,045 | 10.70 | ||||
| 2025-04-21 | 13F | ORG Partners LLC | 0 | -100.00 | 0 | |||||
| 2025-08-15 | 13F | Morgan Stanley | 693,838 | 4.03 | 65,922 | 5.53 | ||||
| 2025-05-09 | 13F | Legacy Capital Group California, Inc. | 0 | -100.00 | 0 | |||||
| 2025-08-12 | 13F | Pathstone Holdings, LLC | 3,201 | 20.02 | 304 | 22.09 | ||||
| 2025-07-18 | 13F | Rogco, Lp | 1,231 | -30.33 | 117 | -29.70 | ||||
| 2025-08-13 | 13F | Cerity Partners LLC | 3,451 | 3.73 | 328 | 5.14 | ||||
| 2025-07-21 | 13F | Cape Ann Savings Bank | 0 | -100.00 | 0 | |||||
| 2025-07-09 | 13F | Stokes Capital Advisors, LLC | 11,385 | 36.05 | 1,082 | 38.06 | ||||
| 2025-05-28 | NP | TFAFX - Tactical Growth Allocation Fund Class I | 2,900 | -27.39 | 272 | -27.54 | ||||
| 2025-07-17 | 13F | LexAurum Advisors, LLC | 18,261 | 1,735 | ||||||
| 2025-08-12 | 13F | Argent Trust Co | 7,374 | -10.42 | 701 | -9.21 | ||||
| 2025-07-23 | 13F | Roundview Capital LLC | 2,545 | 4.09 | 242 | 5.24 | ||||
| 2025-08-13 | 13F | Renaissance Technologies Llc | 32,600 | -70.71 | 3,097 | -70.29 | ||||
| 2025-08-14 | 13F | Glen Eagle Advisors, LLC | 14 | 0.00 | 1 | 0.00 | ||||
| 2025-08-06 | 13F | North Capital, Inc. | 180 | 0.00 | 17 | 6.25 | ||||
| 2025-08-05 | 13F | NewSquare Capital LLC | 26,482 | 23.15 | 2,516 | 24.93 | ||||
| 2025-05-30 | NP | ERNZ - TrueShares Active Yield ETF | 7,819 | 732 | ||||||
| 2025-07-23 | 13F | Axos Invest Inc. | 5,430 | -6.92 | 516 | -5.68 | ||||
| 2025-08-12 | 13F | Proequities, Inc. | 0 | 0 | ||||||
| 2025-07-08 | 13F | Zrc Wealth Management, Llc | 54 | 0.00 | 5 | 0.00 | ||||
| 2025-07-08 | 13F | Nbc Securities, Inc. | 649 | 0.00 | 0 | |||||
| 2025-04-23 | 13F | Golden State Wealth Management, LLC | 0 | -100.00 | 0 | |||||
| 2025-07-25 | 13F | Cwm, Llc | 223,327 | 74.75 | 21 | 90.91 | ||||
| 2025-08-12 | 13F | RiverFront Investment Group, LLC | 2,315 | 0.00 | 220 | 1.39 | ||||
| 2025-07-23 | 13F | Bellevue Asset Management, Llc | 240 | 0.00 | 23 | 0.00 | ||||
| 2025-07-22 | 13F | Global Assets Advisory, LLC | 0 | -100.00 | 0 | |||||
| 2025-08-14 | 13F | GWM Advisors LLC | 37,325 | 6.44 | 3,546 | 7.98 | ||||
| 2025-07-11 | 13F | Farther Finance Advisors, LLC | 3,174 | -28.61 | 302 | -27.29 | ||||
| 2025-08-08 | 13F | Pnc Financial Services Group, Inc. | 317,183 | 3.88 | 30,136 | 5.38 | ||||
| 2025-08-06 | 13F | Price Capital Management, Inc. | 0 | -100.00 | 0 | |||||
| 2025-07-18 | 13F | PFG Investments, LLC | 0 | -100.00 | 0 | |||||
| 2025-08-12 | 13F | Allianz Investment Management U.S. LLC | 9,977 | 0.00 | 948 | 3.05 | ||||
| 2025-07-02 | 13F/A | Bank Of Nova Scotia | 0 | -100.00 | 0 | -100.00 | ||||
| 2025-08-12 | 13F | Global Retirement Partners, LLC | 1,121 | 45.58 | 107 | 47.22 | ||||
| 2025-07-16 | 13F | ORG Wealth Partners, LLC | 18 | 0.00 | 2 | 0.00 | ||||
| 2025-08-14 | 13F | Tennessee Valley Asset Management Partners | 0 | -100.00 | 0 | |||||
| 2025-08-15 | 13F | Kestra Advisory Services, LLC | 6,811 | 202.71 | 647 | 208.10 | ||||
| 2025-08-29 | 13F | Centaurus Financial, Inc. | 0 | -100.00 | 0 | |||||
| 2025-08-12 | 13F | NFP Retirement, Inc. | 37,274 | -1.93 | 3,541 | -0.51 | ||||
| 2025-07-23 | 13F | Capital Management Associates, Inc | 132,121 | -48.80 | 12,553 | -48.06 | ||||
| 2025-04-22 | 13F | Synergy Financial Management, LLC | 0 | -100.00 | 0 | |||||
| 2025-08-12 | 13F | Jefferies Financial Group Inc. | 0 | -100.00 | 0 | |||||
| 2025-07-30 | 13F | Whittier Trust Co | 647 | -15.97 | 61 | -15.28 | ||||
| 2025-08-14 | 13F | Legacy Advisory Services, LLC | 3,410 | 1.85 | 324 | 3.51 | ||||
| 2025-08-05 | 13F | Westside Investment Management, Inc. | 126 | 0.00 | 12 | 0.00 | ||||
| 2025-08-05 | 13F | Milestone Asset Management, Llc | 9,938 | -76.67 | 944 | -76.33 | ||||
| 2025-05-07 | 13F | Foundations Investment Advisors, LLC | 0 | -100.00 | 0 | |||||
| 2025-08-13 | 13F | Level Four Advisory Services, Llc | 5,382 | 1.49 | 511 | 3.02 | ||||
| 2025-07-31 | 13F | Glass Jacobson Investment Advisors llc | 32,239 | -8.55 | 3,063 | -7.24 | ||||
| 2025-05-12 | 13F | Aveo Capital Partners, LLC | 0 | -100.00 | 0 | |||||
| 2025-07-24 | 13F | IFP Advisors, Inc | 3,866 | 70.53 | 367 | 73.11 | ||||
| 2025-08-14 | 13F | Integrated Wealth Concepts LLC | 12,675 | -2.48 | 1,204 | -1.07 | ||||
| 2025-07-22 | 13F | DAVENPORT & Co LLC | 4,107 | 17.28 | 390 | 19.27 | ||||
| 2025-08-05 | 13F | Sigma Planning Corp | 3,607 | -4.07 | 343 | -2.84 | ||||
| 2025-08-12 | 13F | Richard W. Paul & Associates, LLC | 14 | 0.00 | 1 | 0.00 | ||||
| 2025-08-14 | 13F | Comerica Bank | 2,653 | -0.52 | 252 | 1.20 | ||||
| 2025-03-28 | NP | DYFI - IDX DYNAMIC FIXED INCOME ETF | 57,096 | 50.11 | 5,418 | 50.92 | ||||
| 2025-07-23 | 13F | Valmark Advisers, Inc. | 26,914 | 2.54 | 2,557 | 4.03 | ||||
| 2025-08-11 | 13F | PAX Financial Group, LLC | 11,277 | -18.47 | 1,071 | -17.30 | ||||
| 2025-08-12 | 13F | Founders Financial Alliance, LLC | 0 | -100.00 | 0 | |||||
| 2025-05-06 | 13F | Navellier & Associates Inc | 0 | -100.00 | 0 | |||||
| 2025-05-16 | 13F | Coppell Advisory Solutions LLC | 0 | -100.00 | 0 | |||||
| 2025-08-13 | 13F | GeoWealth Management, LLC | 10,269 | 1.03 | 976 | 2.52 | ||||
| 2025-07-10 | 13F | Wealth Enhancement Advisory Services, Llc | 9,087 | -7.10 | 859 | -6.22 | ||||
| 2025-04-21 | 13F | Nelson, Van Denburg & Campbell Wealth Management Group, LLC | 0 | -100.00 | 0 | |||||
| 2025-05-14 | 13F | GM Advisory Group, Inc. | 0 | -100.00 | 0 | |||||
| 2025-08-06 | 13F | AE Wealth Management LLC | 12,470 | 5.54 | 1,185 | 7.05 | ||||
| 2025-07-14 | 13F/A | Seek First Inc. | 2,562 | 1.83 | 243 | 3.40 | ||||
| 2025-07-30 | 13F | Exencial Wealth Advisors, Llc | 67,622 | -19.81 | 6,425 | -18.66 | ||||
| 2025-08-12 | 13F | Steward Partners Investment Advisory, Llc | 359 | 734.88 | 34 | 750.00 | ||||
| 2025-07-08 | 13F | Parallel Advisors, LLC | 61 | 0.00 | 6 | 0.00 | ||||
| 2025-08-13 | 13F | Beacon Pointe Advisors, LLC | 43,850 | -7.54 | 4,166 | -6.19 | ||||
| 2025-07-21 | 13F | West Financial Advisors, LLC | 144,408 | 1.27 | 13,720 | 2.74 | ||||
| 2025-08-01 | 13F | Envestnet Asset Management Inc | 525,182 | 4.31 | 49,891 | 5.80 | ||||
| 2025-07-22 | 13F | SOL Capital Management CO | 8,443 | -8.31 | 1 | |||||
| 2025-07-23 | 13F | Element Wealth, LLC | 2,718 | 0.04 | 258 | 1.57 | ||||
| 2025-07-31 | 13F | Oppenheimer & Co Inc | 2,392 | 5.00 | 227 | 6.57 | ||||
| 2025-05-27 | NP | XFLX - FundX Flexible ETF | 64,125 | 52.97 | 6,006 | 52.92 | ||||
| 2025-08-14 | 13F | Hrt Financial Lp | 0 | -100.00 | 0 | |||||
| 2025-05-27 | NP | XRLX - FundX Conservative ETF | 27,989 | 52.62 | 2,621 | 52.65 | ||||
| 2025-07-29 | 13F | Barden Capital Management, Inc. | 14,597 | -5.95 | 1,387 | -4.61 | ||||
| 2025-08-14 | 13F | Harwood Advisory Group, LLC | 0 | -100.00 | 0 | |||||
| 2025-07-08 | 13F | Webster Bank, N. A. | 55 | 0.00 | 5 | 0.00 | ||||
| 2025-08-11 | 13F | Aspen Investment Management Inc | 27,538 | 2.04 | 3 | 0.00 | ||||
| 2025-08-18 | 13F/A | National Bank Of Canada /fi/ | 18,456 | 226.31 | 1,753 | 231.38 | ||||
| 2025-08-05 | 13F | Key FInancial Inc | 1,578 | -12.33 | 150 | -11.31 | ||||
| 2025-04-29 | 13F | DT Investment Partners, LLC | 0 | -100.00 | 0 | |||||
| 2025-08-04 | 13F | Kovack Advisors, Inc. | 3,273 | 0.03 | 311 | 1.31 | ||||
| 2025-08-13 | 13F | Continuum Advisory, LLC | 0 | -100.00 | 0 | |||||
| 2025-08-06 | 13F | Legacy Wealth Managment, LLC/ID | 23 | 0.00 | 2 | 0.00 | ||||
| 2025-05-06 | 13F | Advisors Preferred, LLC | 0 | -100.00 | 0 | |||||
| 2025-07-31 | 13F | Cambridge Investment Research Advisors, Inc. | 59,979 | -6.16 | 6 | 0.00 | ||||
| 2025-08-14 | 13F | Fwl Investment Management, Llc | 20 | 0.00 | 2 | 0.00 | ||||
| 2025-08-08 | 13F | Kingsview Wealth Management, LLC | 10,128 | 0.09 | 962 | 1.58 | ||||
| 2025-08-14 | 13F | Smartleaf Asset Management LLC | 39 | 0.00 | 4 | 0.00 | ||||
| 2025-07-28 | 13F | BRYN MAWR TRUST Co | 224 | 21 | ||||||
| 2025-08-08 | 13F | Security Financial Services, INC. | 5,705 | 4.43 | 542 | 6.07 | ||||
| 2025-07-21 | 13F | Ameritas Advisory Services, LLC | 2,774 | 3.93 | 264 | 5.62 | ||||
| 2025-08-14 | 13F | Man Group plc | 92,138 | 16.57 | 8,754 | 18.25 | ||||
| 2025-07-10 | 13F | Charter Oak Capital Management, LLC | 6,709 | -14.61 | 637 | -13.33 | ||||
| 2025-07-09 | 13F | Massmutual Trust Co Fsb/adv | 0 | -100.00 | 0 | |||||
| 2025-08-01 | 13F | Redwood Park Advisors LLC | 1,250 | 0.00 | 119 | 0.85 | ||||
| 2025-08-14 | 13F | Citadel Advisors Llc | 10,470 | -89.24 | 995 | -89.09 | ||||
| 2025-07-15 | 13F | Maseco Llp | 555 | 53 | ||||||
| 2025-07-21 | 13F | Empirical Financial Services, LLC d.b.a. Empirical Wealth Management | 20,118 | 9.12 | 1,911 | 10.72 | ||||
| 2025-07-15 | 13F | Td Private Client Wealth Llc | 158,694 | 4.73 | 15,077 | 6.24 | ||||
| 2025-08-05 | 13F | Bank of New York Mellon Corp | 7,780 | 13.78 | 739 | 15.47 | ||||
| 2025-08-11 | 13F | Parr Mcknight Wealth Management Group, Llc | 10,411 | 17.99 | 989 | 19.73 | ||||
| 2025-08-12 | 13F | Park Square Financial Group, LLC | 98 | 10.11 | 9 | 12.50 | ||||
| 2025-08-07 | 13F | Zions Bancorporation, National Association /ut/ | 850 | 0.00 | 81 | 1.27 | ||||
| 2025-07-18 | 13F | Dogwood Wealth Management LLC | 653 | 0.00 | 62 | 0.00 | ||||
| 2025-05-14 | 13F | Toroso Investments, LLC | 0 | -100.00 | 0 | |||||
| 2025-08-07 | 13F | Proficio Capital Partners LLC | 2,897,779 | 2,934 | ||||||
| 2025-08-18 | 13F | Geneos Wealth Management Inc. | 33 | 0.00 | 3 | 0.00 | ||||
| 2025-07-30 | 13F | Mid-American Wealth Advisory Group, Inc. | 315,569 | 1.36 | 29,982 | 2.82 | ||||
| 2025-07-28 | 13F | Harbour Investments, Inc. | 182 | 0.00 | 17 | 0.00 | ||||
| 2025-08-12 | 13F | LPL Financial LLC | 293,665 | 21.18 | 27,901 | 22.93 | ||||
| 2025-08-06 | 13F | Commonwealth Equity Services, Llc | 125,065 | -17.09 | 12 | -21.43 | ||||
| 2025-08-08 | 13F | Gts Securities Llc | 7,600 | 722 | ||||||
| 2025-08-14 | 13F | Atomi Financial Group, Inc. | 2,221 | -0.09 | 211 | 1.44 | ||||
| 2025-07-23 | 13F | Friedenthal Financial | 24,685 | 10.53 | 2,345 | 12.15 | ||||
| 2025-07-23 | 13F | Seamount Financial Group Inc | 40,617 | 7.13 | 3,859 | 8.70 | ||||
| 2025-08-13 | 13F | EverSource Wealth Advisors, LLC | 789 | -51.02 | 75 | -50.67 | ||||
| 2025-04-28 | 13F | First Horizon Advisors, Inc. | 0 | -100.00 | 0 | |||||
| 2025-07-24 | 13F | Capital Advisors, Ltd. LLC | 511 | 0.99 | 0 | |||||
| 2025-08-07 | 13F | Authentikos Wealth Advisory, LLC | 22,721 | 30.93 | 2,159 | 32.80 | ||||
| 2025-05-12 | 13F | Independent Advisor Alliance | 0 | -100.00 | 0 | |||||
| 2025-08-12 | 13F | Change Path, LLC | 39,334 | 4.16 | 3,737 | 5.68 | ||||
| 2025-07-15 | 13F | Financial Management Professionals, Inc. | 211,899 | -4.54 | 20,132 | -3.16 | ||||
| 2025-08-15 | 13F | WFA of San Diego, LLC | 1,015 | -28.27 | 96 | -28.89 | ||||
| 2025-07-24 | 13F | Beacon Bridge Wealth Partners, LLC | 2,505 | -28.86 | 238 | -27.66 | ||||
| 2025-08-12 | 13F | Jpmorgan Chase & Co | 337,940 | 18.47 | 32,108 | 20.17 | ||||
| 2025-08-14 | 13F | Fmr Llc | 128 | 161.22 | 12 | 200.00 | ||||
| 2025-08-08 | 13F | Avantax Advisory Services, Inc. | 3,397 | 323 | ||||||
| 2025-08-08 | 13F | Condor Capital Management | 152,331 | 5.85 | 14,473 | 7.37 | ||||
| 2025-08-14 | 13F | Mariner, LLC | 0 | -100.00 | 0 | |||||
| 2025-08-11 | 13F | One Capital Management, LLC | 0 | -100.00 | 0 | |||||
| 2025-08-05 | 13F | Bank Of Montreal /can/ | 1,570 | -11.10 | 149 | -9.70 | ||||
| 2025-07-16 | 13F | Brown, Lisle/cummings, Inc. | 570 | 0.00 | 54 | 1.89 | ||||
| 2025-08-06 | 13F | SOUTH STATE Corp | 134 | 13 | ||||||
| 2025-08-14 | 13F | Snowden Capital Advisors LLC | 4,158 | -1.54 | 395 | 0.00 | ||||
| 2025-07-29 | 13F | TrueMark Investments, LLC | 0 | -100.00 | 0 | |||||
| 2025-05-15 | 13F | Manufacturers Life Insurance Company, The | 0 | -100.00 | 0 | |||||
| 2025-08-11 | 13F | Strategic Wealth Partners, Ltd. | 746 | 71 | ||||||
| 2025-04-25 | 13F | New Wave Wealth Advisors Llc | 0 | -100.00 | 0 | |||||
| 2025-07-14 | 13F | Pacifica Partners Inc. | 189 | 1.07 | 18 | 0.00 | ||||
| 2025-08-07 | 13F | Rollins Financial Advisors, LLC | 4,280 | -29.19 | 407 | -28.27 | ||||
| 2025-07-21 | 13F | Mechanics Financial Corp | 357 | -28.46 | 34 | -28.26 | ||||
| 2025-08-06 | 13F | Rialto Wealth Management, LLC | 3,974 | 0.00 | 378 | 1.34 | ||||
| 2025-07-18 | 13F | Truist Financial Corp | 19,777 | -56.67 | 1,879 | -56.04 | ||||
| 2025-07-09 | 13F | Graves-Light Private Wealth Management, Inc. | 62,535 | -1.58 | 5,941 | -0.17 | ||||
| 2025-08-19 | 13F | Advisory Services Network, LLC | 21,723 | 3.11 | 2,061 | 4.46 | ||||
| 2025-08-14 | 13F | Headlands Technologies LLC | 0 | -100.00 | 0 | -100.00 | ||||
| 2025-08-12 | 13F | CIBC Private Wealth Group, LLC | 12,296 | 7.28 | 1,168 | 13.84 | ||||
| 2025-08-13 | 13F | Northwestern Mutual Wealth Management Co | 9,605 | 8.65 | 913 | 10.28 | ||||
| 2025-07-21 | 13F | Rainey & Randall Investment Management Inc. | 5,253 | 0.15 | 499 | 1.63 | ||||
| 2025-08-12 | 13F | Hillsdale Investment Management Inc. | 4,445 | 26.82 | 422 | 28.66 | ||||
| 2025-08-14 | 13F | Peapack Gladstone Financial Corp | 16,635 | 0.00 | 2 | 0.00 | ||||
| 2025-07-10 | 13F | Burns J W & Co Inc/ny | 3,255 | -9.71 | 309 | -8.31 | ||||
| 2025-08-13 | 13F | Flow Traders U.s. Llc | 0 | -100.00 | 0 | |||||
| 2025-08-20 | 13F | North Dallas Bank & Trust Co | 12,825 | 1,219 | ||||||
| 2025-08-14 | 13F | Susquehanna International Group, Llp | 0 | -100.00 | 0 | |||||
| 2025-08-14 | 13F | Murphy & Mullick Capital Management Corp | 5,405 | -7.03 | 513 | -5.88 | ||||
| 2025-08-14 | 13F | Transamerica Financial Advisors, Inc. | 1 | 0.00 | 0 | |||||
| 2025-08-14 | 13F | Visionary Wealth Advisors | 0 | -100.00 | 0 | |||||
| 2025-08-14 | 13F | Ameriprise Financial Inc | 117,834 | -16.76 | 11,195 | -15.57 | ||||
| 2025-07-29 | 13F | Bellecapital International Ltd. | 17,276 | 0.00 | 1,641 | 1.42 | ||||
| 2025-08-13 | 13F | Jones Financial Companies Lllp | 19,777 | 98.66 | 1,872 | 100.97 | ||||
| 2025-08-05 | 13F | Tsfg, Llc | 80 | 0.00 | 0 | |||||
| 2025-07-14 | 13F | AdvisorNet Financial, Inc | 2,473 | 19.18 | 235 | 20.62 | ||||
| 2025-08-14 | 13F | CoreCap Advisors, LLC | 15 | 0.00 | 1 | 0.00 | ||||
| 2025-08-14 | 13F | Bnp Paribas Arbitrage, Sa | 20,600 | -42.13 | 1,957 | -41.30 | ||||
| 2025-07-30 | 13F | Bleakley Financial Group, LLC | 159,883 | 15,190 | ||||||
| 2025-07-29 | 13F | Koshinski Asset Management, Inc. | 9,420 | -2.81 | 895 | -1.43 | ||||
| 2025-07-21 | 13F | Ameriflex Group, Inc. | 99 | 0.00 | 9 | 0.00 | ||||
| 2025-07-08 | 13F | Adamsbrown Wealth Consultants Llc | 19,823 | 10.21 | 1,883 | 11.82 | ||||
| 2025-07-25 | 13F | Atria Wealth Solutions, Inc. | 0 | -100.00 | 0 | |||||
| 2025-08-13 | 13F | Per Stirling Capital Management, LLC. | 0 | -100.00 | 0 | |||||
| 2025-08-14 | 13F | Old Mission Capital Llc | 0 | -100.00 | 0 | |||||
| 2025-08-06 | 13F | Stonebridge Financial Planning Group, LLC | 3,510 | 0.00 | 333 | 1.52 | ||||
| 2025-08-12 | 13F | JMG Financial Group, Ltd. | 4,862 | -21.15 | 462 | -20.10 | ||||
| 2025-07-11 | 13F | Pinnacle Bancorp, Inc. | 7,781 | -0.64 | 739 | 0.82 | ||||
| 2025-07-28 | 13F | Brown Financial Advisory | 2,158 | 205 | ||||||
| 2025-05-13 | 13F | Ground Swell Capital, LLC | 0 | -100.00 | 0 | |||||
| 2025-05-12 | 13F | Astor Investment Management LLC | 0 | -100.00 | 0 | |||||
| 2025-08-11 | 13F | Aptus Capital Advisors, LLC | 1,542 | 0.13 | 146 | 1.39 | ||||
| 2025-07-09 | 13F | Gilman Hill Asset Management, LLC | 4,500 | 56.52 | 428 | 58.74 | ||||
| 2025-08-12 | 13F | Putnam Fl Investment Management Co | 29,280 | -12.31 | 2,782 | -11.06 | ||||
| 2025-07-29 | 13F | Stephens Inc /ar/ | 2,175 | -33.34 | 207 | -32.46 | ||||
| 2025-08-05 | 13F | Cherry Tree Wealth Management, LLC | 733 | 0.00 | 70 | 1.47 | ||||
| 2025-08-11 | 13F | Advisor Resource Council | 0 | -100.00 | 0 | |||||
| 2025-09-04 | 13F/A | Advisor Group Holdings, Inc. | 177,030 | 157.53 | 16,724 | 159.61 | ||||
| 2025-08-04 | 13F | Creative Financial Designs Inc /adv | 274 | 1.86 | 26 | 4.00 | ||||
| 2025-07-28 | 13F | Ckw Financial Group | 4,189 | -0.48 | 0 | |||||
| 2025-08-18 | 13F | Hollencrest Capital Management | 17 | 0.00 | 2 | 0.00 | ||||
| 2025-08-12 | 13F | Main Management LLC | 0 | -100.00 | 0 | |||||
| 2025-08-11 | 13F | MainStreet Investment Advisors LLC | 0 | -100.00 | 0 | |||||
| 2025-08-12 | 13F | South Plains Financial, Inc. | 4,754 | -71.98 | 452 | -71.62 | ||||
| 2025-08-12 | 13F | MAI Capital Management | 1,379 | -1.15 | 131 | 0.00 | ||||
| 2025-08-14 | 13F | Cardiff Park Advisors, Llc | 1,230 | 0.00 | 117 | 0.87 | ||||
| 2025-08-11 | 13F | HighTower Advisors, LLC | 4,699 | -66.29 | 446 | -65.82 | ||||
| 2025-07-08 | 13F | Strategic Advocates LLC | 44,444 | -10.91 | 4,223 | -9.63 | ||||
| 2025-07-09 | 13F | Bank of New Hampshire | 99 | 0.00 | 9 | 0.00 | ||||
| 2025-07-15 | 13F | Financial Partners Group, Inc | 13,725 | 1,304 | ||||||
| 2025-07-24 | 13F | Standard Life Aberdeen plc | 2,864 | 272 | ||||||
| 2025-08-04 | 13F | Migdal Insurance & Financial Holdings Ltd. | 8,410 | 0.00 | 1 | |||||
| 2025-05-14 | 13F | Truvestments Capital Llc | 0 | -100.00 | 0 | |||||
| 2025-07-17 | 13F | Sage Rhino Capital Llc | 18,994 | -1.74 | 1,805 | -0.33 | ||||
| 2025-08-11 | 13F | Private Advisor Group, LLC | 6,076 | 159.44 | 577 | 163.47 |
Other Listings
| MX:HYS |