Mga Batayang Estadistika
| Pemilik Institusional | 171 total, 171 long only, 0 short only, 0 long/short - change of -3.33% MRQ |
| Alokasi Portofolio Rata-rata | 0.1158 % - change of -28.15% MRQ |
| Saham Institusional (Jangka Panjang) | 33,751,632 (ex 13D/G) - change of -1.39MM shares -3.95% MRQ |
| Nilai Institusional (Jangka Panjang) | $ 1,483,911 USD ($1000) |
Kepemilikan Institusional dan Pemegang Saham
VanEck ETF Trust - VanEck Intermediate Muni ETF (US:ITM) memiliki 171 pemilik institusional dan pemegang saham yang telah mengajukan formulir 13D/G atau 13F kepada Komisi Bursa Efek (Securities Exchange Commission/SEC). Lembaga-lembaga ini memegang total 33,751,632 saham. Pemegang saham terbesar meliputi Bank Of America Corp /de/, Northwestern Mutual Wealth Management Co, LPL Financial LLC, Envestnet Asset Management Inc, Ameriprise Financial Inc, Wells Fargo & Company/mn, Fmr Llc, CX Institutional, Morgan Stanley, and Wealth Enhancement Advisory Services, Llc .
Struktur kepemilikan institusional VanEck ETF Trust - VanEck Intermediate Muni ETF (BATS:ITM) menunjukkan posisi terkini di perusahaan oleh institusi dan dana, serta perubahan terbaru dalam ukuran posisi. Pemegang saham utama dapat mencakup investor individu, reksa dana, dana lindung nilai, atau institusi. Jadwal 13D menunjukkan bahwa investor memegang (atau pernah memegang) lebih dari 5% saham perusahaan dan bermaksud (atau pernah bermaksud) untuk secara aktif mengejar perubahan strategi bisnis. Jadwal 13G menunjukkan investasi pasif lebih dari 5%.
The share price as of September 5, 2025 is 46.02 / share. Previously, on September 6, 2024, the share price was 46.71 / share. This represents a decline of 1.48% over that period.

Skor Sentimen Dana
Skor Sentimen Dana (sebelumnya dikenal sebagai Skor Akumulasi Kepemilikan) menemukan saham-saham yang paling banyak dibeli oleh dana. Ini adalah hasil dari model kuantitatif multi-faktor yang canggih yang mengidentifikasi perusahaan dengan tingkat akumulasi institusional tertinggi. Model penilaian menggunakan kombinasi dari total peningkatan pemilik yang diungkapkan, perubahan dalam alokasi portofolio pada pemilik tersebut, dan metrik lainnya. Angka berkisar dari 0 hingga 100, dengan angka yang lebih tinggi menunjukkan tingkat akumulasi yang lebih tinggi dibandingkan dengan perusahaan sejenisnya, dan 50 adalah rata-ratanya.
Frekuensi Pembaruan: Setiap Hari
Lihat Ownership Explorer, yang menyediakan daftar perusahaan dengan peringkat tertinggi.
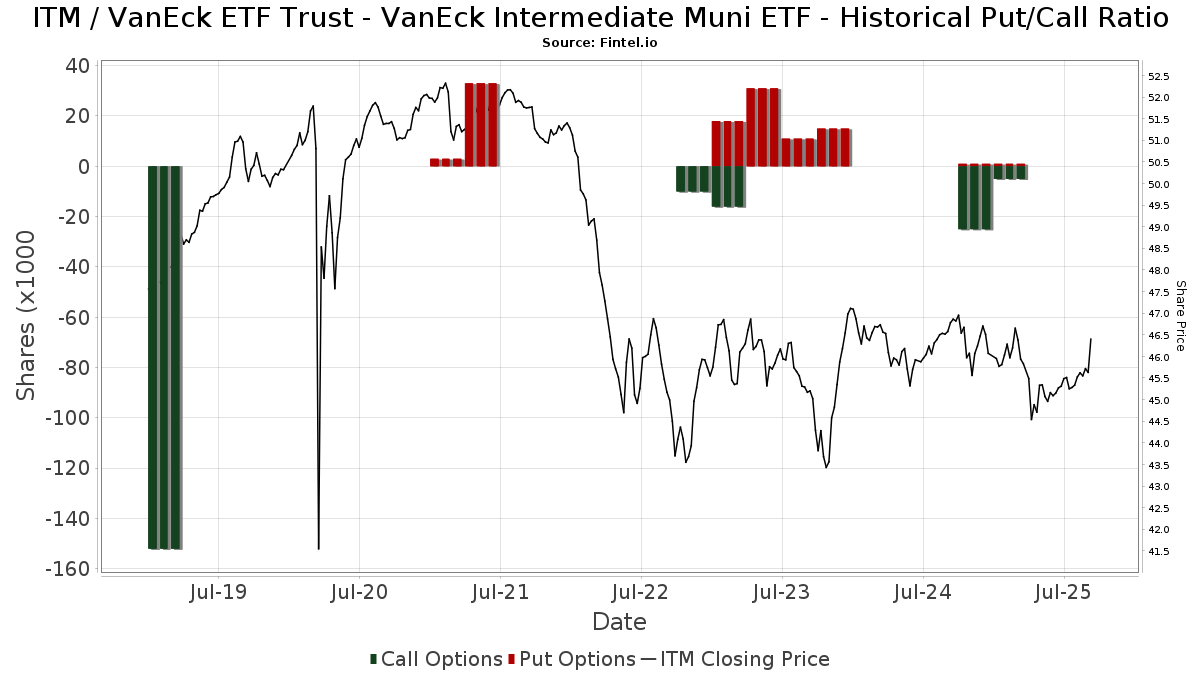
Rasio Put/Call Institusional
Selain melaporkan isu ekuitas dan utang standar, institusi dengan aset di bawah manajemen lebih dari 100 juta dolar AS juga harus mengungkapkan kepemilikan opsi put dan call mereka. Karena opsi put umumnya menunjukkan sentimen negatif, dan opsi call menunjukkan sentimen positif, kita dapat mengetahui sentimen institusional secara keseluruhan dengan memplot rasio put terhadap call. Grafik di sebelah kanan memplot rasio put/call historis untuk instrumen ini.
Menggunakan Rasio Put/Call sebagai indikator sentimen investor mengatasi salah satu kekurangan utama dari penggunaan total kepemilikan institusional, yaitu sejumlah besar aset yang dikelola diinvestasikan secara pasif untuk melacak indeks. Dana yang dikelola secara pasif biasanya tidak membeli opsi, sehingga indikator rasio put/call lebih akurat dalam melacak sentimen dana yang dikelola secara aktif.
Pengajuan 13F dan NPORT
Detail pada pengajuan 13F tersedia gratis. Detail pada pengajuan NP memerlukan keanggotaan premium. Baris berwarna hijau menunjukkan posisi baru. Baris berwarna merah menunjukkan posisi yang sudah ditutup. Klik tautan ini ikon untuk melihat riwayat transaksi selengkapnya.
Tingkatkan
untuk membuka data premium dan mengekspor ke Excel ![]() .
.
| Tanggal File | Sumber | Investor | Ketik | Presyo ng Avg (Silangan) |
Saham | Δ Saham (%) |
Dilaporkan Nilai ($1000) |
Nilai Δ (%) |
Alokasi Port (%) |
|
|---|---|---|---|---|---|---|---|---|---|---|
| 2025-04-24 | 13F | Wingate Wealth Advisors, Inc. | 0 | -100.00 | 0 | |||||
| 2025-08-12 | 13F | Steward Partners Investment Advisory, Llc | 10,010 | 0.00 | 455 | 0.00 | ||||
| 2025-08-04 | 13F | Assetmark, Inc | 0 | -100.00 | 0 | |||||
| 2025-08-05 | 13F | Bank Of Montreal /can/ | 6,193 | 0.00 | 282 | 0.00 | ||||
| 2025-07-24 | 13F | Lee Financial Co | 10,500 | 0.00 | 477 | 0.00 | ||||
| 2025-08-11 | 13F | Rothschild Investment Llc | 122 | 6 | ||||||
| 2025-07-21 | 13F | Cliftonlarsonallen Wealth Advisors, Llc | 15,554 | 51.17 | 707 | 51.07 | ||||
| 2025-08-11 | 13F | CFS Investment Advisory Services, LLC | 10,537 | -63.76 | 0 | -100.00 | ||||
| 2025-07-22 | 13F | Aquire Wealth Advisors, LLC | 19,259 | 0.25 | 876 | 0.11 | ||||
| 2025-07-16 | 13F/A | CX Institutional | 721,021 | -3.80 | 33 | -5.88 | ||||
| 2025-08-01 | 13F | Petra Financial Advisors Inc | 14,920 | 0.10 | 678 | 0.00 | ||||
| 2025-08-04 | 13F | Simon Quick Advisors, Llc | 109,868 | 4,996 | ||||||
| 2025-08-14 | 13F | Jane Street Group, Llc | 249,865 | -71.33 | 11,361 | -71.35 | ||||
| 2025-07-15 | 13F | Mather Group, Llc. | 447,121 | 49.69 | 20,331 | 49.56 | ||||
| 2025-08-07 | 13F | Resources Investment Advisors, LLC. | 453,820 | 35.26 | 20,635 | 35.14 | ||||
| 2025-08-13 | 13F | Jones Financial Companies Lllp | 26,144 | -3.74 | 1,186 | -3.73 | ||||
| 2025-07-16 | 13F | Magnus Financial Group LLC | 9,189 | -16.15 | 418 | -16.27 | ||||
| 2025-07-30 | 13F | Paul Damon & Associates, Inc. | 11,258 | -3.65 | 512 | -3.77 | ||||
| 2025-08-07 | 13F | Midwest Trust Co | 39,100 | 1,778 | ||||||
| 2025-08-12 | 13F | Founders Financial Alliance, LLC | 0 | -100.00 | 0 | |||||
| 2025-07-07 | 13F | RDA Financial Network | 6,875 | 313 | ||||||
| 2025-08-21 | 13F | Aveo Capital Partners, LLC | 0 | -100.00 | 0 | |||||
| 2025-08-13 | 13F | Renaissance Technologies Llc | 130,700 | 35.72 | 5,943 | 35.60 | ||||
| 2025-07-30 | 13F | Wbh Advisory Inc | 13,222 | 601 | ||||||
| 2025-04-09 | 13F | Baker Tilly Financial, Llc | 0 | -100.00 | 0 | |||||
| 2025-09-04 | 13F/A | Advisor Group Holdings, Inc. | 33,303 | 4.58 | 1,515 | 4.55 | ||||
| 2025-07-18 | 13F | Vicus Capital | 53,270 | 18.03 | 2,422 | 17.92 | ||||
| 2025-07-09 | 13F | Massmutual Trust Co Fsb/adv | 14,986 | -58.49 | 681 | -58.55 | ||||
| 2025-08-14 | 13F | Bnp Paribas Arbitrage, Sa | 0 | -100.00 | 0 | |||||
| 2025-08-14 | 13F | Mariner, LLC | 35,213 | 14.69 | 1,601 | 14.60 | ||||
| 2025-08-08 | 13F | Kingsview Wealth Management, LLC | 0 | -100.00 | 0 | |||||
| 2025-07-11 | 13F | Farther Finance Advisors, LLC | 898 | 0.34 | 41 | 0.00 | ||||
| 2025-08-14 | 13F | Wiley Bros.-aintree Capital, Llc | 12,374 | -24.50 | 563 | -24.36 | ||||
| 2025-07-29 | 13F | Stratos Wealth Partners, LTD. | 6,741 | 0.03 | 307 | 0.00 | ||||
| 2025-08-14 | 13F | Raymond James Financial Inc | 167,539 | -2.94 | 7,618 | -3.03 | ||||
| 2025-07-28 | 13F | J.Safra Asset Management Corp | 48,404 | 2,197 | ||||||
| 2025-07-21 | 13F | DHJJ Financial Advisors, Ltd. | 4 | 0.00 | 0 | |||||
| 2025-07-22 | 13F | Gutierrez Wealth Advisory, LLC | 13,598 | 618 | ||||||
| 2025-04-21 | 13F | Nelson, Van Denburg & Campbell Wealth Management Group, LLC | 0 | -100.00 | 0 | |||||
| 2025-07-08 | 13F/A | Salem Investment Counselors Inc | 41 | 0.00 | 2 | 0.00 | ||||
| 2025-07-30 | 13F | Granite Harbor Advisors, Inc. | 78,012 | 11.96 | 3,547 | 11.86 | ||||
| 2025-05-15 | 13F | Two Sigma Securities, Llc | 0 | -100.00 | 0 | |||||
| 2025-08-07 | 13F/A | Tortoise Investment Management, LLC | 0 | -100.00 | 0 | -100.00 | ||||
| 2025-07-09 | 13F | FOCUS Wealth Advisors, LLC | 156,012 | 2.49 | 7,094 | 2.40 | ||||
| 2025-08-12 | 13F | CIBC Private Wealth Group, LLC | 1,080 | 0.00 | 49 | 4.26 | ||||
| 2025-08-14 | 13F | Wells Fargo & Company/mn | 865,145 | 3.20 | 39,338 | 3.11 | ||||
| 2025-08-04 | 13F | Atria Investments Llc | 0 | -100.00 | 0 | |||||
| 2025-08-05 | 13F | Cherry Tree Wealth Management, LLC | 699 | 0.00 | 32 | 0.00 | ||||
| 2025-08-14 | 13F | GWM Advisors LLC | 500 | -98.30 | 23 | -98.35 | ||||
| 2025-08-19 | 13F | Advisory Services Network, LLC | 0 | -100.00 | 0 | |||||
| 2025-07-24 | 13F | JNBA Financial Advisors | 0 | -100.00 | 0 | |||||
| 2025-07-31 | 13F | Oppenheimer & Co Inc | 23,828 | -7.30 | 1,083 | -7.36 | ||||
| 2025-04-09 | 13F | St Germain D J Co Inc | 0 | -100.00 | 0 | -100.00 | ||||
| 2025-08-13 | 13F | Capital Advisors Wealth Management, LLC | 9,407 | -3.10 | 428 | -3.17 | ||||
| 2025-08-14 | 13F | Goodwin Investment Advisory | 23,172 | -6.11 | 1,054 | -6.23 | ||||
| 2025-08-05 | 13F | Tsfg, Llc | 315 | 0.00 | 0 | |||||
| 2025-08-14 | 13F | Millennium Management Llc | 0 | -100.00 | 0 | |||||
| 2025-07-31 | 13F | GenTrust, LLC | 19,466 | -6.71 | 885 | -6.74 | ||||
| 2025-07-15 | 13F | Td Private Client Wealth Llc | 5,993 | 16.57 | 273 | 16.74 | ||||
| 2025-08-13 | 13F | Flow Traders U.s. Llc | 0 | -100.00 | 0 | |||||
| 2025-07-23 | 13F | Watershed Private Wealth Llc | 0 | -100.00 | 0 | |||||
| 2025-05-12 | 13F | Sandy Spring Bank | 57 | 3 | ||||||
| 2025-08-11 | 13F | HighTower Advisors, LLC | 344,123 | -3.89 | 15,647 | -3.97 | ||||
| 2025-08-14 | 13F | Susquehanna International Group, Llp | Call | 0 | -100.00 | 0 | ||||
| 2025-08-14 | 13F | Harwood Advisory Group, LLC | 0 | -100.00 | 0 | |||||
| 2025-07-17 | 13F | Janney Montgomery Scott LLC | 11,166 | -3.96 | 1 | |||||
| 2025-08-14 | 13F | AllSquare Wealth Management LLC | 525 | 0.00 | 24 | 0.00 | ||||
| 2025-08-14 | 13F | Van Eck Associates Corp | 0 | -100.00 | 0 | |||||
| 2025-07-25 | 13F | Atria Wealth Solutions, Inc. | 0 | -100.00 | 0 | |||||
| 2025-05-15 | 13F | Proquility Private Wealth Partners, LLC | 113,095 | 344.68 | 5,147 | 339.08 | ||||
| 2025-08-07 | 13F | Parkside Financial Bank & Trust | 54,503 | -24.06 | 2,478 | -24.13 | ||||
| 2025-07-30 | 13F | Avidian Wealth Solutions, LLC | 318,001 | -1.23 | 14,459 | -1.32 | ||||
| 2025-08-01 | 13F | Envestnet Asset Management Inc | 887,784 | -14.53 | 40,368 | -14.61 | ||||
| 2025-08-14 | 13F | Ameriprise Financial Inc | 877,749 | 217.29 | 39,908 | 217.02 | ||||
| 2025-05-12 | 13F | Townsquare Capital Llc | 0 | -100.00 | 0 | |||||
| 2025-07-30 | 13F | Atlantic Edge Private Wealth Management, LLC | 0 | 0 | ||||||
| 2025-08-07 | 13F | Vise Technologies, Inc. | 45,350 | 2,062 | ||||||
| 2025-08-26 | 13F/A | Thrivent Financial For Lutherans | 90,276 | 4 | ||||||
| 2025-08-06 | 13F | Columbia River Financial Group, LLC | 0 | -100.00 | 0 | |||||
| 2025-08-06 | 13F | Commonwealth Equity Services, Llc | 34,164 | 73.55 | 2 | |||||
| 2025-08-13 | 13F | Cerity Partners LLC | 95,014 | -3.43 | 4,320 | -3.51 | ||||
| 2025-08-11 | 13F | Dorsey & Whitney Trust CO LLC | 0 | -100.00 | 0 | |||||
| 2025-08-13 | 13F | Summit Financial, LLC | 8,546 | 36.41 | 389 | 36.14 | ||||
| 2025-05-09 | 13F | Intrust Bank Na | 0 | -100.00 | 0 | |||||
| 2025-07-10 | 13F | Wealth Enhancement Advisory Services, Llc | 643,409 | -6.54 | 29,246 | -6.65 | ||||
| 2025-08-12 | 13F | Proequities, Inc. | 0 | 0 | ||||||
| 2025-08-14 | 13F | Engineers Gate Manager LP | 7,098 | -61.48 | 323 | -61.58 | ||||
| 2025-08-14 | 13F | Clarity Asset Management, Inc. | 354 | 16 | ||||||
| 2025-08-07 | 13F | Winthrop Capital Management, LLC | 1,663 | 0.00 | 0 | |||||
| 2025-08-12 | 13F | Running Point Capital Advisors, LLC | 35,678 | 23.19 | 1,622 | 23.07 | ||||
| 2025-08-14 | 13F | Mml Investors Services, Llc | 67,840 | -26.99 | 3 | -25.00 | ||||
| 2025-07-30 | 13F | Bogart Wealth, LLC | 173 | 0.00 | 8 | 0.00 | ||||
| 2025-08-05 | 13F | NewSquare Capital LLC | 682 | 31 | ||||||
| 2025-07-24 | 13F | IFP Advisors, Inc | 802 | -53.26 | 36 | -53.85 | ||||
| 2025-08-08 | 13F | Hartland & Co., LLC | 79,534 | -9.57 | 3,616 | -9.65 | ||||
| 2025-07-25 | 13F | Envestnet Portfolio Solutions, Inc. | 0 | -100.00 | 0 | |||||
| 2025-08-14 | 13F/A | Rockefeller Capital Management L.P. | 35,676 | 81.33 | 1,622 | 81.23 | ||||
| 2025-08-13 | 13F | Northwestern Mutual Wealth Management Co | 3,636,894 | 47.13 | 165,370 | 47.00 | ||||
| 2025-08-14 | 13F | Susquehanna International Group, Llp | 5,112 | -96.88 | 232 | -96.89 | ||||
| 2025-07-10 | 13F | Fulton Bank, N.a. | 51,670 | 13.98 | 2,349 | 13.86 | ||||
| 2025-08-15 | 13F | Tower Research Capital LLC (TRC) | 9 | 0 | ||||||
| 2025-07-16 | 13F | Beaumont Financial Advisors, LLC | 27,214 | -1.96 | 1,237 | -2.06 | ||||
| 2025-08-18 | 13F | Front Row Advisors LLC | 1,200 | 0.00 | 55 | 0.00 | ||||
| 2025-07-09 | 13F | Fragasso Group Inc. | 35,959 | 1,635 | ||||||
| 2025-08-06 | 13F | Stokes Family Office, LLC | 9,361 | -23.40 | 426 | -23.56 | ||||
| 2025-08-12 | 13F | NFP Retirement, Inc. | 8,994 | -0.48 | 409 | -0.73 | ||||
| 2025-07-28 | 13F | BRYN MAWR TRUST Co | 652 | 0.00 | 30 | 0.00 | ||||
| 2025-08-11 | 13F | Aptus Capital Advisors, LLC | 1,882 | 206.02 | 86 | 214.81 | ||||
| 2025-07-18 | 13F | Northeast Financial Group, Inc. | 0 | -100.00 | 0 | |||||
| 2025-08-12 | 13F | YANKCOM Partnership | 1,272 | 58 | ||||||
| 2025-05-15 | 13F | Buckingham Strategic Partners | 0 | -100.00 | 0 | |||||
| 2025-07-16 | 13F | Perigon Wealth Management, LLC | 14,334 | 652 | ||||||
| 2025-08-14 | 13F | Royal Bank Of Canada | 93,808 | -1.98 | 4,265 | -2.07 | ||||
| 2025-08-04 | 13F | Pensionmark Financial Group, Llc | 10,512 | -12.54 | 478 | -12.64 | ||||
| 2025-08-08 | 13F | Creative Planning | 6,525 | -3.87 | 297 | -3.90 | ||||
| 2025-08-12 | 13F | Global Retirement Partners, LLC | 1,725 | 11.36 | 78 | 9.86 | ||||
| 2025-07-25 | 13F | ONE Advisory Partners, LLC | 12,766 | 26.21 | 578 | 25.65 | ||||
| 2025-08-05 | 13F | Claro Advisors LLC | 0 | -100.00 | 0 | |||||
| 2025-08-19 | 13F | National Asset Management, Inc. | 0 | -100.00 | 0 | |||||
| 2025-08-14 | 13F | UBS Group AG | 317,417 | -2.35 | 14,433 | -2.43 | ||||
| 2025-08-01 | 13F | Brinker Capital Investments, LLC | 0 | -100.00 | 0 | -100.00 | ||||
| 2025-07-21 | 13F | HighMark Wealth Management LLC | 53 | 2 | ||||||
| 2025-08-13 | 13F | Baird Financial Group, Inc. | 4,420 | 201 | ||||||
| 2025-08-07 | 13F | 1620 Investment Advisors, Inc. | 26,729 | -4.60 | 1,215 | -4.71 | ||||
| 2025-08-14 | 13F | Stifel Financial Corp | 319,663 | -4.89 | 14,535 | -4.97 | ||||
| 2025-05-15 | 13F | Lavaca Capital Llc | 0 | -100.00 | 0 | |||||
| 2025-07-29 | 13F | Stephens Inc /ar/ | 7,221 | 2.40 | 328 | 2.50 | ||||
| 2025-08-13 | 13F | First Trust Advisors Lp | 9,540 | -1.27 | 434 | -1.37 | ||||
| 2025-07-08 | 13F | FF Advisors,LLC | 7,381 | 0.00 | 336 | 0.30 | ||||
| 2025-08-08 | 13F | Cetera Investment Advisers | 173,888 | -9.52 | 7,907 | -9.59 | ||||
| 2025-08-08 | 13F | Avantax Advisory Services, Inc. | 20,824 | 50.96 | 947 | 50.88 | ||||
| 2025-08-11 | 13F | Wealthspire Advisors, LLC | 14,001 | 0.00 | 637 | -0.16 | ||||
| 2025-07-22 | 13F | Apexium Financial, Lp | 7,496 | 0.00 | 341 | -0.29 | ||||
| 2025-08-14 | 13F | Hrt Financial Lp | 12,176 | 1 | ||||||
| 2025-07-29 | 13F | Private Trust Co Na | 12,715 | 0.12 | 578 | 0.17 | ||||
| 2025-08-08 | 13F | Avalon Trust Co | 1,100 | 0.00 | 50 | 0.00 | ||||
| 2025-08-14 | 13F | Sargent Investment Group, LLC | 6,926 | 3.51 | 315 | 3.62 | ||||
| 2025-07-24 | 13F | Brandywine Oak Private Wealth Llc | 84,423 | -47.73 | 3,839 | -47.78 | ||||
| 2025-08-14 | 13F | Lazard Asset Management Llc | 1 | 0.00 | ||||||
| 2025-07-09 | 13F | Alesco Advisors Llc | 15,240 | 0.00 | 693 | -0.14 | ||||
| 2025-08-11 | 13F | Principal Securities, Inc. | 70,938 | 7.70 | 3,226 | 6.23 | ||||
| 2025-05-15 | 13F | SIH Partners, LLLP | Call | 0 | -100.00 | 0 | ||||
| 2025-07-09 | 13F | Hardin Capital Partners, LLC | 4,692 | -0.85 | 213 | -0.93 | ||||
| 2025-07-31 | 13F | Optimum Investment Advisors | 10,250 | 0.00 | 466 | 0.00 | ||||
| 2025-08-12 | 13F | AlphaCore Capital LLC | 1,062 | 0.00 | 48 | 0.00 | ||||
| 2025-04-14 | 13F | Kennebec Savings Bank | 0 | -100.00 | 0 | |||||
| 2025-08-08 | 13F | Condor Capital Management | 7,379 | -97.00 | 336 | -97.00 | ||||
| 2025-07-21 | 13F | Ameritas Advisory Services, LLC | 1,183 | 54 | ||||||
| 2025-07-16 | 13F | Northern Oak Wealth Management Inc | 11,148 | -16.49 | 507 | -16.64 | ||||
| 2025-08-12 | 13F | Clearwater Capital Advisors, LLC | 11,351 | -1.09 | 516 | -1.15 | ||||
| 2025-08-14 | 13F | Ancora Advisors, LLC | 1,190 | -3.33 | 54 | -3.57 | ||||
| 2025-08-06 | 13F | Atlantic Union Bankshares Corp | 57 | 3 | ||||||
| 2025-04-17 | 13F | Warther Private Wealth, LLC | 0 | -100.00 | 0 | |||||
| 2025-07-17 | 13F | Keystone Global Partners, LLC | 0 | -100.00 | 0 | |||||
| 2025-08-15 | 13F | Morgan Stanley | 716,287 | 4.98 | 32,570 | 4.89 | ||||
| 2025-07-10 | 13F | Global Financial Private Client, LLC | 0 | -100.00 | 0 | |||||
| 2025-08-12 | 13F | Ameritas Investment Partners, Inc. | 14,430 | -6.27 | 656 | -6.29 | ||||
| 2025-08-14 | 13F | Warren Averett Asset Management, LLC | 44,674 | 53.03 | 2,031 | 52.94 | ||||
| 2025-08-06 | 13F | Hallmark Capital Management Inc | 0 | -100.00 | 0 | |||||
| 2025-08-14 | 13F | Bank Of America Corp /de/ | 14,995,417 | -2.64 | 681,842 | -2.73 | ||||
| 2025-08-14 | 13F | Integrated Wealth Concepts LLC | 19,093 | 10.99 | 868 | 11.00 | ||||
| 2025-07-16 | 13F | Signaturefd, Llc | 130 | 0.00 | 6 | 0.00 | ||||
| 2025-08-13 | 13F | Rsm Us Wealth Management Llc | 38,564 | 136.02 | 1,754 | 135.94 | ||||
| 2025-07-14 | 13F | Park Avenue Securities Llc | 101,524 | -7.76 | 5 | -20.00 | ||||
| 2025-07-24 | 13F | Us Bancorp \de\ | 1,279 | -95.57 | 58 | -95.59 | ||||
| 2025-08-12 | 13F | Jpmorgan Chase & Co | 401,796 | -35.84 | 18,270 | -35.90 | ||||
| 2025-08-14 | 13F | Aqr Capital Management Llc | 9,386 | 73.14 | 427 | 73.17 | ||||
| 2025-07-22 | 13F | Old National Bancorp /in/ | 127,818 | -28.42 | 5,812 | -28.49 | ||||
| 2025-08-13 | 13F | Continuum Advisory, LLC | 0 | -100.00 | 0 | |||||
| 2025-07-31 | 13F | Cambridge Investment Research Advisors, Inc. | 37,939 | -39.08 | 2 | -50.00 | ||||
| 2025-08-12 | 13F | Cornerstone Wealth Management, LLC | 67,998 | -1.40 | 3,092 | -1.50 | ||||
| 2025-05-09 | 13F | CoreCap Advisors, LLC | 0 | -100.00 | 0 | |||||
| 2025-08-06 | 13F | AE Wealth Management LLC | 475 | 22 | ||||||
| 2025-08-14 | 13F/A | Skopos Labs, Inc. | 937 | 43 | ||||||
| 2025-07-18 | 13F | Truist Financial Corp | 76,933 | -12.34 | 3,498 | -12.42 | ||||
| 2025-08-11 | 13F | Nations Financial Group Inc, /ia/ /adv | 7,075 | -6.01 | 322 | -6.14 | ||||
| 2025-05-09 | 13F | GeoWealth Management, LLC | 0 | -100.00 | 0 | |||||
| 2025-08-08 | 13F | Gts Securities Llc | 14,776 | 672 | ||||||
| 2025-08-12 | 13F | LPL Financial LLC | 1,937,260 | 6.53 | 88,087 | 6.43 | ||||
| 2025-08-14 | 13F | Synovus Financial Corp | 8,273 | -14.93 | 376 | -14.93 | ||||
| 2025-07-24 | 13F | Ronald Blue Trust, Inc. | 314 | 361.76 | 14 | 366.67 | ||||
| 2025-05-15 | 13F | Prospera Financial Services Inc | 0 | -100.00 | 0 | |||||
| 2025-07-22 | 13F | Merit Financial Group, LLC | 9,837 | -16.37 | 447 | -16.45 | ||||
| 2025-08-01 | 13F | James Investment Research Inc | 0 | -100.00 | 0 | |||||
| 2025-08-11 | 13F | Private Advisor Group, LLC | 14,223 | -10.83 | 647 | -10.90 | ||||
| 2025-08-14 | 13F | Clark Capital Management Group, Inc. | 142,114 | -2.79 | 6,462 | -2.89 | ||||
| 2025-08-05 | 13F | Westside Investment Management, Inc. | 20,251 | -5.26 | 921 | -5.35 | ||||
| 2025-07-29 | 13F | Mattson Financial Services, LLC | 0 | -100.00 | 0 | |||||
| 2025-08-13 | 13F | Willis Johnson & Associates, Inc. | 626,341 | 19.74 | 28,480 | 19.63 | ||||
| 2025-08-13 | 13F | Quadrature Capital Ltd | 14,669 | 667 | ||||||
| 2025-07-23 | 13F | Steel Peak Wealth Management LLC | 59,887 | 2.57 | 2,723 | 2.48 | ||||
| 2025-07-28 | 13F | Axxcess Wealth Management, Llc | 79,696 | 1,608.38 | 3,624 | 1,608.96 | ||||
| 2025-07-08 | 13F | Gradient Investments LLC | 9,802 | 9.97 | 446 | 9.88 | ||||
| 2025-08-13 | 13F | Baker Avenue Asset Management, LP | 21,301 | 1.87 | 969 | 1.79 | ||||
| 2025-07-28 | 13F | Davidson Investment Advisors | 350,047 | 0.11 | 15,917 | 0.02 | ||||
| 2025-08-14 | 13F | Hilltop Holdings Inc. | 9,998 | -5.79 | 455 | -5.81 | ||||
| 2025-08-14 | 13F | Old Mission Capital Llc | 31,037 | 1,411 | ||||||
| 2025-07-30 | 13F | Rehmann Capital Advisory Group | 8,408 | -2.19 | 382 | -2.30 | ||||
| 2025-08-14 | 13F | Citadel Advisors Llc | Put | 0 | -100.00 | 0 | ||||
| 2025-08-06 | 13F | First Horizon Advisors, Inc. | 5,242 | 9.28 | 238 | 9.17 | ||||
| 2025-08-12 | 13F | Ameraudi Asset Management, Inc. | 11,400 | 0.00 | 518 | 0.00 | ||||
| 2025-07-15 | 13F | Sheets Smith Wealth Management | 13,600 | 0.00 | 618 | 0.00 | ||||
| 2025-07-24 | 13F | Jfs Wealth Advisors, Llc | 3,043 | -41.98 | 138 | -42.02 | ||||
| 2025-07-24 | 13F | Robertson Stephens Wealth Management, LLC | 4,457 | 0.00 | 203 | 0.00 | ||||
| 2025-08-08 | 13F | Pnc Financial Services Group, Inc. | 2 | -98.92 | 0 | -100.00 | ||||
| 2025-08-14 | 13F | Comerica Bank | 23,310 | 2.55 | 1,060 | 2.42 | ||||
| 2025-07-24 | 13F | Blair William & Co/il | 200 | 0.00 | 9 | 0.00 | ||||
| 2025-07-25 | 13F | Cwm, Llc | 27,076 | 0.00 | 1 | 0.00 | ||||
| 2025-07-21 | 13F | Empirical Financial Services, LLC d.b.a. Empirical Wealth Management | 15,874 | -34.60 | 722 | -34.69 | ||||
| 2025-08-05 | 13F | Huntington National Bank | 0 | |||||||
| 2025-08-14 | 13F | Mercer Global Advisors Inc /adv | 0 | -100.00 | 0 | |||||
| 2025-07-09 | 13F | Hummer Financial Advisory Services Inc | 8,750 | 0.00 | 398 | -0.25 | ||||
| 2025-08-11 | 13F | Strategic Wealth Partners, Ltd. | 255 | 12 | ||||||
| 2025-07-25 | 13F | Ackerman Capital Advisors, LLC | 0 | -100.00 | 0 | |||||
| 2025-07-17 | 13F | XML Financial, LLC | 26,483 | -6.51 | 1,204 | -6.59 | ||||
| 2025-07-29 | 13F | Activest Wealth Management | 0 | 0 | ||||||
| 2025-05-14 | 13F | Orion Portfolio Solutions, LLC | 7,398 | 0.00 | 341 | 0.00 | ||||
| 2025-08-14 | 13F | Citadel Advisors Llc | 10,281 | -98.25 | 467 | -98.25 | ||||
| 2025-08-15 | 13F | Fft Wealth Management Llc | 0 | -100.00 | 0 | |||||
| 2025-07-30 | 13F | Strategic Blueprint, LLC | 15,663 | -49.05 | 712 | -49.07 | ||||
| 2025-08-14 | 13F | Fmr Llc | 808,015 | 7.39 | 36,740 | 7.30 | ||||
| 2025-08-14 | 13F | Smartleaf Asset Management LLC | 485 | 0.00 | 22 | 0.00 | ||||
| 2025-08-14 | 13F | Qube Research & Technologies Ltd | 2,953 | 108.69 | 134 | 109.38 | ||||
| 2025-08-01 | 13F | Financial Counselors Inc | 0 | -100.00 | 0 | |||||
| 2025-04-24 | 13F | Park Place Capital Corp | 0 | -100.00 | 0 | |||||
| 2025-07-30 | 13F | LGT Financial Advisors LLC | 0 | -100.00 | 0 | |||||
| 2025-08-13 | 13F | Idaho Trust Bank | 38,264 | -2.73 | 1,740 | -2.79 |
Other Listings
| MX:ITM |