Mga Batayang Estadistika
| Pemilik Institusional | 223 total, 223 long only, 0 short only, 0 long/short - change of 8.25% MRQ |
| Alokasi Portofolio Rata-rata | 0.0661 % - change of -15.85% MRQ |
| Saham Institusional (Jangka Panjang) | 25,862,027 (ex 13D/G) - change of 0.77MM shares 3.07% MRQ |
| Nilai Institusional (Jangka Panjang) | $ 550,861 USD ($1000) |
Kepemilikan Institusional dan Pemegang Saham
ORIX Corporation - Depositary Receipt (Common Stock) (US:IX) memiliki 223 pemilik institusional dan pemegang saham yang telah mengajukan formulir 13D/G atau 13F kepada Komisi Bursa Efek (Securities Exchange Commission/SEC). Lembaga-lembaga ini memegang total 25,862,027 saham. Pemegang saham terbesar meliputi Morgan Stanley, Fmr Llc, Bank Of America Corp /de/, Todd Asset Management Llc, Northern Trust Corp, Teachers Retirement System Of The State Of Kentucky, BlackRock, Inc., Wells Fargo & Company/mn, American Century Companies Inc, and Quantinno Capital Management LP .
Struktur kepemilikan institusional ORIX Corporation - Depositary Receipt (Common Stock) (NYSE:IX) menunjukkan posisi terkini di perusahaan oleh institusi dan dana, serta perubahan terbaru dalam ukuran posisi. Pemegang saham utama dapat mencakup investor individu, reksa dana, dana lindung nilai, atau institusi. Jadwal 13D menunjukkan bahwa investor memegang (atau pernah memegang) lebih dari 5% saham perusahaan dan bermaksud (atau pernah bermaksud) untuk secara aktif mengejar perubahan strategi bisnis. Jadwal 13G menunjukkan investasi pasif lebih dari 5%.
The share price as of September 5, 2025 is 26.22 / share. Previously, on September 9, 2024, the share price was 24.02 / share. This represents an increase of 9.18% over that period.

Skor Sentimen Dana
Skor Sentimen Dana (sebelumnya dikenal sebagai Skor Akumulasi Kepemilikan) menemukan saham-saham yang paling banyak dibeli oleh dana. Ini adalah hasil dari model kuantitatif multi-faktor yang canggih yang mengidentifikasi perusahaan dengan tingkat akumulasi institusional tertinggi. Model penilaian menggunakan kombinasi dari total peningkatan pemilik yang diungkapkan, perubahan dalam alokasi portofolio pada pemilik tersebut, dan metrik lainnya. Angka berkisar dari 0 hingga 100, dengan angka yang lebih tinggi menunjukkan tingkat akumulasi yang lebih tinggi dibandingkan dengan perusahaan sejenisnya, dan 50 adalah rata-ratanya.
Frekuensi Pembaruan: Setiap Hari
Lihat Ownership Explorer, yang menyediakan daftar perusahaan dengan peringkat tertinggi.
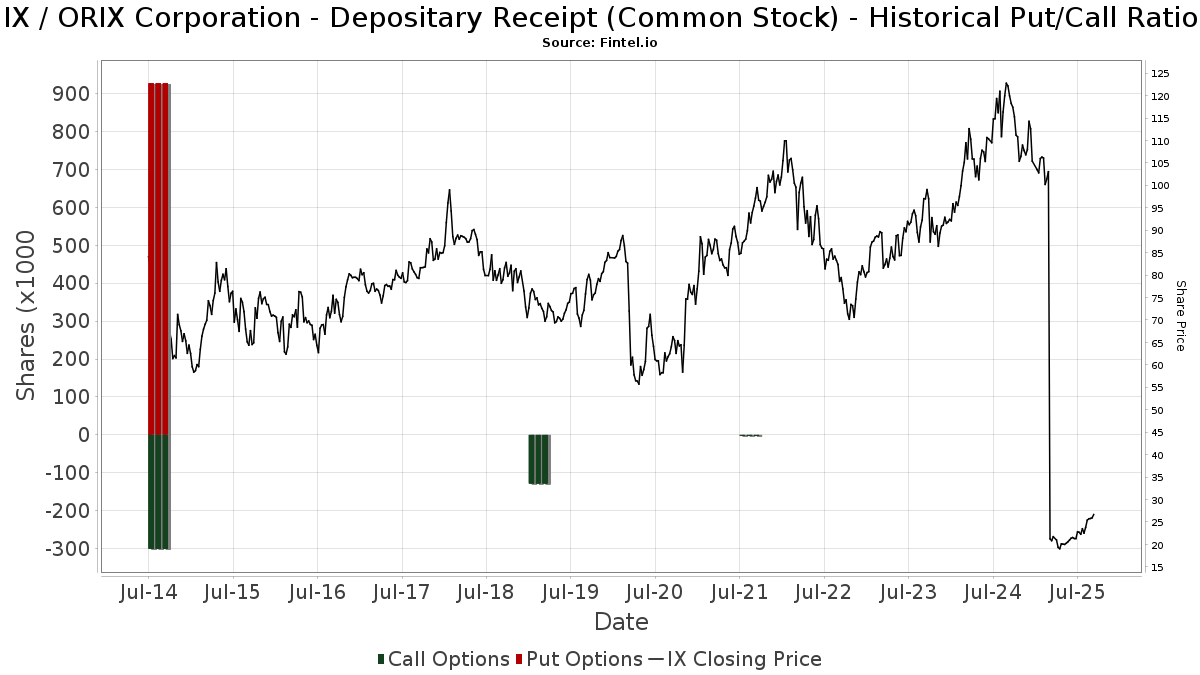
Rasio Put/Call Institusional
Selain melaporkan isu ekuitas dan utang standar, institusi dengan aset di bawah manajemen lebih dari 100 juta dolar AS juga harus mengungkapkan kepemilikan opsi put dan call mereka. Karena opsi put umumnya menunjukkan sentimen negatif, dan opsi call menunjukkan sentimen positif, kita dapat mengetahui sentimen institusional secara keseluruhan dengan memplot rasio put terhadap call. Grafik di sebelah kanan memplot rasio put/call historis untuk instrumen ini.
Menggunakan Rasio Put/Call sebagai indikator sentimen investor mengatasi salah satu kekurangan utama dari penggunaan total kepemilikan institusional, yaitu sejumlah besar aset yang dikelola diinvestasikan secara pasif untuk melacak indeks. Dana yang dikelola secara pasif biasanya tidak membeli opsi, sehingga indikator rasio put/call lebih akurat dalam melacak sentimen dana yang dikelola secara aktif.
Pengajuan 13F dan NPORT
Detail pada pengajuan 13F tersedia gratis. Detail pada pengajuan NP memerlukan keanggotaan premium. Baris berwarna hijau menunjukkan posisi baru. Baris berwarna merah menunjukkan posisi yang sudah ditutup. Klik tautan ini ikon untuk melihat riwayat transaksi selengkapnya.
Tingkatkan
untuk membuka data premium dan mengekspor ke Excel ![]() .
.
| Tanggal File | Sumber | Investor | Ketik | Presyo ng Avg (Silangan) |
Saham | Δ Saham (%) |
Dilaporkan Nilai ($1000) |
Nilai Δ (%) |
Alokasi Port (%) |
|
|---|---|---|---|---|---|---|---|---|---|---|
| 2025-08-12 | 13F | SRS Capital Advisors, Inc. | 1,217 | 739.31 | 40 | 1,233.33 | ||||
| 2025-05-14 | 13F | Van Hulzen Asset Management, LLC | 0 | -100.00 | 0 | -100.00 | ||||
| 2025-06-25 | NP | GENW - Genter Capital International Dividend ETF | 635 | 499.06 | 13 | 9.09 | ||||
| 2025-04-29 | 13F | Wood Tarver Financial Group, LLC | 0 | -100.00 | 0 | |||||
| 2025-08-08 | 13F | Crossmark Global Holdings, Inc. | 134,130 | -0.16 | 3,021 | 7.63 | ||||
| 2025-08-11 | 13F | Bell Investment Advisors, Inc | 140 | -25.93 | 3 | 0.00 | ||||
| 2025-08-13 | 13F | Centiva Capital, LP | 9,127 | 206 | ||||||
| 2025-08-15 | 13F | CI Private Wealth, LLC | 31,566 | 50.86 | 711 | 62.47 | ||||
| 2025-08-12 | 13F | Coldstream Capital Management Inc | 0 | -100.00 | 0 | |||||
| 2025-08-06 | 13F | First Horizon Advisors, Inc. | 165 | 4 | ||||||
| 2025-08-08 | 13F | Creative Planning | 26,837 | 11.66 | 604 | 20.32 | ||||
| 2025-08-11 | 13F | Dorsey & Whitney Trust CO LLC | 0 | -100.00 | 0 | |||||
| 2025-07-28 | NP | AVIV - Avantis International Large Cap Value ETF This fund is a listed as child fund of American Century Companies Inc and if that institution has disclosed ownership in this security, then these positions will not be double counted when calculating total shares and total value | 65,382 | 35.46 | 1,390 | 40.97 | ||||
| 2025-08-14 | 13F | Beaird Harris Wealth Management, LLC | 65 | 0.00 | 1 | 0.00 | ||||
| 2025-08-14 | 13F | Millennium Management Llc | 366,526 | 79.70 | 8,254 | 93.76 | ||||
| 2025-04-22 | 13F | Mendota Financial Group, LLC | 0 | -100.00 | 0 | |||||
| 2025-08-13 | 13F | Mount Yale Investment Advisors, LLC | 32,473 | 41.03 | 731 | 52.29 | ||||
| 2025-08-14 | 13F | Royal Bank Of Canada | 33,956 | -10.83 | 763 | -4.15 | ||||
| 2025-08-15 | 13F | Captrust Financial Advisors | 11,150 | -1.49 | 251 | 6.36 | ||||
| 2025-07-11 | 13F | Farther Finance Advisors, LLC | 1,995 | 27.64 | 45 | 37.50 | ||||
| 2025-08-13 | 13F | Lido Advisors, LLC | 12,884 | -15.24 | 290 | -8.52 | ||||
| 2025-07-28 | NP | AVDE - Avantis International Equity ETF This fund is a listed as child fund of American Century Companies Inc and if that institution has disclosed ownership in this security, then these positions will not be double counted when calculating total shares and total value | 420,480 | 9.40 | 8,939 | 13.79 | ||||
| 2025-07-24 | 13F | PDS Planning, Inc | 10,624 | -2.07 | 239 | 5.75 | ||||
| 2025-07-30 | NP | ENDW - Cambria Endowment Style ETF | 10 | 0 | ||||||
| 2025-07-31 | 13F | Whipplewood Advisors, LLC | 361 | 1,344.00 | 8 | 14.29 | ||||
| 2025-08-12 | 13F | BlackRock, Inc. | 876,513 | -4.98 | 19,739 | 2.43 | ||||
| 2025-07-21 | 13F | Credential Securities Inc. | 0 | -100.00 | 0 | |||||
| 2025-08-14 | 13F | Bnp Paribas Arbitrage, Sa | 16,041 | -44.09 | 361 | -39.73 | ||||
| 2025-08-08 | 13F | Pnc Financial Services Group, Inc. | 38,571 | 12.30 | 869 | 21.06 | ||||
| 2025-08-12 | 13F | Trexquant Investment LP | 23,004 | 12.80 | 518 | 21.60 | ||||
| 2025-08-11 | 13F | Principal Securities, Inc. | 1,360 | 461.98 | 31 | 20.00 | ||||
| 2025-08-05 | 13F | NewSquare Capital LLC | 2,659 | 628.49 | 60 | 742.86 | ||||
| 2025-07-23 | 13F | Venturi Wealth Management, LLC | 9,656 | 217 | ||||||
| 2025-08-12 | 13F | Pathstone Holdings, LLC | 111,844 | -5.84 | 2,519 | 1.37 | ||||
| 2025-08-07 | 13F | Sierra Ocean, Llc | 468 | 23.16 | 11 | 42.86 | ||||
| 2025-07-18 | 13F | Bartlett & Co. Wealth Management Llc | 115 | 0.00 | 3 | 0.00 | ||||
| 2025-08-15 | 13F | WealthCollab, LLC | 1,823 | -4.40 | 41 | 5.13 | ||||
| 2025-08-15 | 13F | Tower Research Capital LLC (TRC) | 2 | 0 | ||||||
| 2025-08-07 | 13F | Midwest Trust Co | 13,384 | 301 | ||||||
| 2025-07-23 | 13F | Optas, LLC | 10,484 | 236 | ||||||
| 2025-08-12 | 13F | CIBC Private Wealth Group, LLC | 0 | -100.00 | 0 | |||||
| 2025-08-14 | 13F | Ieq Capital, Llc | 14,371 | 324 | ||||||
| 2025-08-14 | 13F | Sei Investments Co | 126,198 | 4.66 | 2,842 | 12.87 | ||||
| 2025-08-12 | 13F | Jpmorgan Chase & Co | 150,478 | 64.26 | 3,389 | 77.10 | ||||
| 2025-08-12 | 13F | Dimensional Fund Advisors Lp | 53,855 | -0.15 | 1,213 | 7.64 | ||||
| 2025-08-14 | 13F | Syon Capital Llc | 12,033 | 271 | ||||||
| 2025-08-06 | 13F | Vestmark Advisory Solutions, Inc. | 23,837 | 537 | ||||||
| 2025-08-14 | 13F | Mml Investors Services, Llc | 18,726 | -1.63 | 0 | |||||
| 2025-07-16 | 13F | Signaturefd, Llc | 16,750 | -7.74 | 377 | -0.53 | ||||
| 2025-08-15 | 13F | Binnacle Investments Inc | 368 | 268.00 | 8 | 300.00 | ||||
| 2025-08-13 | 13F | EverSource Wealth Advisors, LLC | 6,364 | 611.86 | 143 | 694.44 | ||||
| 2025-08-11 | 13F | Cornerstone Planning Group LLC | 30 | 0.00 | 1 | |||||
| 2025-08-08 | 13F | SG Americas Securities, LLC | 7,316 | 26.73 | 0 | |||||
| 2025-08-14 | 13F | Quantinno Capital Management LP | 481,327 | 88.20 | 10,839 | 102.90 | ||||
| 2025-08-04 | 13F | Hantz Financial Services, Inc. | 2,484 | 1,105.83 | 0 | |||||
| 2025-05-13 | 13F | United Capital Financial Advisers, Llc | 0 | -100.00 | 0 | |||||
| 2025-08-13 | 13F | Kayne Anderson Rudnick Investment Management Llc | 35 | 0.00 | 1 | |||||
| 2025-07-25 | 13F | JustInvest LLC | 181,457 | 16.46 | 4,090 | 25.65 | ||||
| 2025-08-12 | 13F | Manchester Capital Management LLC | 70 | 2 | ||||||
| 2025-08-14 | 13F | Wiley Bros.-aintree Capital, Llc | 66,390 | 33.22 | 1,147 | 5.82 | ||||
| 2025-08-14 | 13F | Qube Research & Technologies Ltd | 28,002 | 16.04 | 631 | 25.00 | ||||
| 2025-07-24 | 13F | IFP Advisors, Inc | 536 | 2.88 | 12 | 20.00 | ||||
| 2025-08-13 | 13F | Quadrant Capital Group Llc | 73,134 | 32.51 | 1,647 | 42.88 | ||||
| 2025-08-12 | 13F | O'shaughnessy Asset Management, Llc | 229,623 | -5.26 | 5,171 | 2.13 | ||||
| 2025-08-12 | 13F | Global Retirement Partners, LLC | 913 | 4,972.22 | 21 | 1,900.00 | ||||
| 2025-08-12 | 13F | LPL Financial LLC | 24,606 | 63.13 | 554 | 75.87 | ||||
| 2025-08-18 | 13F | Geneos Wealth Management Inc. | 2,056 | -1.15 | 46 | 6.98 | ||||
| 2025-05-15 | 13F | Glenmede Trust Co Na | 19,364 | 601.09 | 405 | 37.88 | ||||
| 2025-07-09 | 13F | Sivia Capital Partners, LLC | 10,970 | 247 | ||||||
| 2025-08-08 | 13F | Larson Financial Group LLC | 365 | 8 | ||||||
| 2025-08-12 | 13F | Steward Partners Investment Advisory, Llc | 260 | -26.76 | 6 | -28.57 | ||||
| 2025-08-13 | 13F | Marshall Wace, Llp | 31,623 | 712 | ||||||
| 2025-08-14 | 13F | Mariner, LLC | 57,983 | -1.51 | 1,305 | 6.10 | ||||
| 2025-07-30 | 13F | Whittier Trust Co Of Nevada Inc | 22,529 | -3.07 | 507 | 4.54 | ||||
| 2025-07-08 | 13F | Nbc Securities, Inc. | 76 | 0 | ||||||
| 2025-07-16 | 13F/A | CX Institutional | 50 | 0.00 | 0 | |||||
| 2025-08-01 | 13F | Y-Intercept (Hong Kong) Ltd | 21,735 | 489 | ||||||
| 2025-08-13 | 13F | Wambolt & Associates, LLC | 97,031 | -8.76 | 2,208 | -0.32 | ||||
| 2025-08-13 | 13F | Brentview Investment Management LLC | 1,760 | 0.00 | 40 | 8.33 | ||||
| 2025-08-13 | 13F | Russell Investments Group, Ltd. | 1,417 | 5.75 | 32 | 14.81 | ||||
| 2025-07-09 | 13F | Bruce G. Allen Investments, LLC | 1,545 | 21.65 | 35 | 30.77 | ||||
| 2025-08-18 | 13F/A | National Bank Of Canada /fi/ | 56,000 | 0.00 | 1,261 | 7.87 | ||||
| 2025-07-14 | 13F | UMA Financial Services, Inc. | 290 | 0.00 | 7 | 0.00 | ||||
| 2025-08-14 | 13F | Principia Wealth Advisory, LLC | 35 | 1 | ||||||
| 2025-08-27 | 13F/A | Brinker Capital Investments, LLC | 56,265 | 31.88 | 1,267 | 42.20 | ||||
| 2025-07-15 | 13F | Mather Group, Llc. | 0 | -100.00 | 0 | |||||
| 2025-08-06 | 13F | Savant Capital, LLC | 16,735 | 61.41 | 377 | 74.07 | ||||
| 2025-07-28 | 13F | Ativo Capital Management LLC | 55,853 | -3.12 | 1,258 | 4.40 | ||||
| 2025-08-01 | 13F | Envestnet Asset Management Inc | 144,045 | -2.82 | 3,244 | 4.75 | ||||
| 2025-07-16 | 13F | Eagle Global Advisors Llc | 313,165 | -21.22 | 7,052 | -15.07 | ||||
| 2025-08-04 | 13F | Savvy Advisors, Inc. | 17,844 | 18.33 | 402 | 27.30 | ||||
| 2025-08-14 | 13F | Evergreen Capital Management Llc | 10,933 | 246 | ||||||
| 2025-08-12 | 13F | Charles Schwab Investment Management Inc | 153,323 | 5.31 | 3,453 | 13.52 | ||||
| 2025-08-14 | 13F | Glenmede Investment Management, LP | 20,210 | 455 | ||||||
| 2025-07-21 | 13F | Ascent Group, LLC | 11,749 | -6.79 | 265 | 0.38 | ||||
| 2025-07-29 | 13F | Harbor Asset Planning, Inc. | 905 | 20 | ||||||
| 2025-08-25 | 13F/A | Neuberger Berman Group LLC | 15,847 | 12.43 | 357 | 21.09 | ||||
| 2025-07-16 | 13F | Highline Wealth Partners Llc | 0 | -100.00 | 0 | |||||
| 2025-07-08 | 13F | Parallel Advisors, LLC | 9,215 | -0.22 | 208 | 7.81 | ||||
| 2025-08-12 | 13F | AlphaCore Capital LLC | 1,195 | 27 | ||||||
| 2025-07-25 | 13F | Yousif Capital Management, Llc | 12,225 | 8.19 | 275 | 16.53 | ||||
| 2025-07-14 | 13F | Park Avenue Securities Llc | 17,677 | 0 | ||||||
| 2025-05-05 | 13F | Lindbrook Capital, Llc | 1,500 | 351.81 | 31 | -11.43 | ||||
| 2025-08-13 | 13F | Cerity Partners LLC | 134,984 | 1.64 | 3,040 | 9.55 | ||||
| 2025-04-21 | 13F | Johnson Investment Counsel Inc | 0 | -100.00 | 0 | |||||
| 2025-08-12 | 13F | Pacer Advisors, Inc. | 9,608 | -2.48 | 218 | 7.43 | ||||
| 2025-07-22 | 13F | Boston Common Asset Management, LLC | 269,617 | -4.76 | 6,072 | 2.67 | ||||
| 2025-08-05 | 13F | Bank of New York Mellon Corp | 117,459 | 4.01 | 2,645 | 12.12 | ||||
| 2025-07-28 | 13F | Ritholtz Wealth Management | 77,119 | -7.56 | 1,737 | -0.34 | ||||
| 2025-07-21 | 13F | Ameritas Advisory Services, LLC | 535 | 12 | ||||||
| 2025-08-14 | 13F | Goldman Sachs Group Inc | 96,548 | 0.10 | 2,174 | 7.94 | ||||
| 2025-07-31 | 13F | R Squared Ltd | 10,204 | 230 | ||||||
| 2025-08-15 | 13F | Morgan Stanley | 5,048,466 | 1.90 | 113,692 | 9.85 | ||||
| 2025-05-05 | 13F | Creekmur Asset Management LLC | 0 | -100.00 | 0 | |||||
| 2025-07-10 | 13F | Global Financial Private Client, LLC | 0 | -100.00 | 0 | |||||
| 2025-07-25 | 13F | Allspring Global Investments Holdings, LLC | 234,358 | -2.54 | 5,334 | 6.47 | ||||
| 2025-08-14 | 13F | Fmr Llc | 4,152,488 | 3.91 | 93,514 | 12.02 | ||||
| 2025-07-21 | 13F | Qrg Capital Management, Inc. | 250,177 | 1.25 | 5,634 | 9.15 | ||||
| 2025-08-13 | 13F | Todd Asset Management Llc | 1,741,177 | 0.76 | 39,211 | 8.63 | ||||
| 2025-07-28 | 13F | Naviter Wealth, LLC | 14,699 | 331 | ||||||
| 2025-07-07 | 13F | Versant Capital Management, Inc | 16,733 | 5.91 | 377 | 13.94 | ||||
| 2025-07-28 | 13F | Private Wealth Asset Management, LLC | 40 | 0.00 | 1 | |||||
| 2025-07-17 | 13F | Halbert Hargrove Global Advisors, Llc | 0 | -100.00 | 0 | |||||
| 2025-08-01 | 13F | Bessemer Group Inc | 198 | -91.33 | 0 | |||||
| 2025-08-12 | 13F | Boreal Capital Management LLC | 210 | 5 | ||||||
| 2025-07-29 | NP | GINX - SGI Enhanced Global Income ETF | 16,202 | -10.04 | 344 | -6.52 | ||||
| 2025-07-30 | 13F | Bogart Wealth, LLC | 120 | 100.00 | 3 | 100.00 | ||||
| 2025-08-14 | 13F | GWM Advisors LLC | 334 | 4.38 | 8 | 16.67 | ||||
| 2025-05-13 | 13F | Hartland & Co., LLC | 0 | -100.00 | 0 | |||||
| 2025-08-13 | 13F | Rsm Us Wealth Management Llc | 17,359 | 7.93 | 391 | 16.42 | ||||
| 2025-07-25 | 13F | Cwm, Llc | 42,318 | 970.53 | 1 | |||||
| 2025-08-14 | 13F | Aqr Capital Management Llc | 79,972 | 79.52 | 1,801 | 93.55 | ||||
| 2025-08-14 | 13F | Principal Street Partners, LLC | 9,832 | 221 | ||||||
| 2025-08-13 | 13F | Natixis Advisors, L.p. | 168,232 | -4.33 | 4 | 0.00 | ||||
| 2025-07-28 | 13F | BRYN MAWR TRUST Co | 3,295 | 0.00 | 74 | 8.82 | ||||
| 2025-08-29 | 13F | Evolution Wealth Management Inc. | 500 | 11 | ||||||
| 2025-07-30 | 13F | Whittier Trust Co | 55,908 | -26.74 | 1,259 | -20.97 | ||||
| 2025-07-30 | NP | APIE - ActivePassive International Equity ETF | 169,979 | 11.20 | 3,614 | 15.65 | ||||
| 2025-08-12 | 13F | Franklin Resources Inc | 15,702 | -0.61 | 354 | 6.97 | ||||
| 2025-07-24 | 13F | Ronald Blue Trust, Inc. | 1,265 | 16.59 | 28 | 27.27 | ||||
| 2025-09-04 | 13F/A | Advisor Group Holdings, Inc. | 6,175 | 408.23 | 136 | 440.00 | ||||
| 2025-08-12 | 13F | Atlas Capital Advisors Llc | 490 | -82.69 | 11 | -81.36 | ||||
| 2025-08-01 | 13F | Financial Counselors Inc | 0 | -100.00 | 0 | |||||
| 2025-08-14 | 13F | Wells Fargo & Company/mn | 723,354 | 1.41 | 16,290 | 9.32 | ||||
| 2025-07-29 | 13F | Salomon & Ludwin, LLC | 13 | 0 | ||||||
| 2025-08-01 | 13F | First Command Advisory Services, Inc. | 40 | 0.00 | 1 | |||||
| 2025-07-25 | 13F | Sequoia Financial Advisors, LLC | 19,448 | -5.15 | 438 | 2.10 | ||||
| 2025-08-13 | 13F | Capital Analysts, Inc. | 750 | -14.29 | 0 | |||||
| 2025-08-14 | 13F | Pitcairn Co | 0 | -100.00 | 0 | |||||
| 2025-07-15 | 13F | Td Private Client Wealth Llc | 105 | 2 | ||||||
| 2025-07-28 | 13F | Harbour Investments, Inc. | 50 | 0.00 | 1 | 0.00 | ||||
| 2025-07-29 | 13F | Private Trust Co Na | 185 | 42.31 | 4 | 100.00 | ||||
| 2025-07-28 | NP | AVDEX - Avantis International Equity Fund Institutional Class This fund is a listed as child fund of American Century Companies Inc and if that institution has disclosed ownership in this security, then these positions will not be double counted when calculating total shares and total value | 21,678 | 34.73 | 461 | 40.24 | ||||
| 2025-08-13 | 13F | Continuum Advisory, LLC | 0 | -100.00 | 0 | |||||
| 2025-05-09 | 13F | Abc Arbitrage Sa | 0 | -100.00 | 0 | |||||
| 2025-08-13 | 13F | Northwestern Mutual Wealth Management Co | 946 | 31,433.33 | 21 | |||||
| 2025-06-26 | NP | DFIEX - International Core Equity Portfolio - Institutional Class This fund is a listed as child fund of Dimensional Fund Advisors Lp and if that institution has disclosed ownership in this security, then these positions will not be double counted when calculating total shares and total value | 25,055 | 400.00 | 503 | -5.28 | ||||
| 2025-08-14 | 13F | Mercer Global Advisors Inc /adv | 161,787 | -2.39 | 3,643 | 5.23 | ||||
| 2025-08-04 | 13F | Creative Financial Designs Inc /adv | 135 | -35.71 | 3 | -25.00 | ||||
| 2025-08-13 | 13F | Townsquare Capital Llc | 0 | -100.00 | 0 | |||||
| 2025-05-07 | 13F | Advantage Trust Co | 0 | -100.00 | 0 | |||||
| 2025-08-07 | 13F | Addison Advisors LLC | 1,537 | 480.00 | 35 | 580.00 | ||||
| 2025-08-14 | 13F | Ameriprise Financial Inc | 30,710 | 56.80 | 692 | 69.36 | ||||
| 2025-05-15 | 13F | CAPROCK Group, Inc. | 23,675 | 435.75 | 495 | 5.33 | ||||
| 2025-08-11 | 13F | Citigroup Inc | 14,592 | 6.76 | 329 | 15.09 | ||||
| 2025-08-14 | 13F | Smartleaf Asset Management LLC | 6,744 | -8.54 | 150 | -4.49 | ||||
| 2025-07-16 | 13F | Brown, Lisle/cummings, Inc. | 81 | 1.25 | 2 | 0.00 | ||||
| 2025-08-12 | 13F | Wayfinding Financial, LLC | 0 | -100.00 | 0 | |||||
| 2025-08-13 | 13F | First Trust Advisors Lp | 68,357 | -4.17 | 1,539 | 3.29 | ||||
| 2025-08-14 | 13F | Atomi Financial Group, Inc. | 15,371 | -3.09 | 346 | 4.53 | ||||
| 2025-08-12 | 13F | Advisors Asset Management, Inc. | 44,196 | 12.04 | 995 | 20.75 | ||||
| 2025-08-14 | 13F | Henry James International Management Inc. | 242,969 | -12.87 | 5,472 | -6.08 | ||||
| 2025-07-16 | 13F | Kathmere Capital Management, LLC | 20,807 | -22.52 | 469 | -16.58 | ||||
| 2025-08-11 | 13F | HighTower Advisors, LLC | 45,202 | 6.33 | 1,018 | 14.53 | ||||
| 2025-08-11 | 13F | Parr Mcknight Wealth Management Group, Llc | 67,964 | 1.01 | 1,531 | 8.90 | ||||
| 2025-05-15 | 13F/A | Orion Portfolio Solutions, LLC | 42,663 | 275.79 | 891 | -26.12 | ||||
| 2025-08-05 | 13F | Huntington National Bank | 4,824 | -2.13 | 109 | 5.88 | ||||
| 2025-08-07 | 13F | Atala Financial Inc | 0 | -100.00 | 0 | |||||
| 2025-07-15 | 13F | Ballentine Partners, LLC | 0 | -100.00 | 0 | |||||
| 2025-08-13 | 13F | Twin Peaks Wealth Advisors, LLC | 806 | 21 | ||||||
| 2025-07-14 | 13F | GAMMA Investing LLC | 5,243 | -8.15 | 118 | -0.84 | ||||
| 2025-08-12 | 13F | Deutsche Bank Ag\ | 0 | -100.00 | 0 | |||||
| 2025-07-15 | 13F | Financial Management Professionals, Inc. | 483 | -47.61 | 11 | -47.37 | ||||
| 2025-08-07 | 13F | Teachers Retirement System Of The State Of Kentucky | 1,058,900 | 0.00 | 24 | 4.55 | ||||
| 2025-08-12 | 13F | MAI Capital Management | 705 | 984.62 | 16 | 1,400.00 | ||||
| 2025-07-17 | 13F | Albion Financial Group /ut | 475 | 0.00 | 11 | 11.11 | ||||
| 2025-08-14 | 13F | Strategic Global Advisors, LLC | 29,375 | 29.95 | 662 | 40.04 | ||||
| 2025-08-14 | 13F | Laird Norton Trust Company, Llc | 13,400 | 0.00 | 302 | 7.89 | ||||
| 2025-08-14 | 13F | Bank Of America Corp /de/ | 2,353,948 | 4.41 | 53,011 | 12.56 | ||||
| 2025-08-01 | 13F | Boyd Watterson Asset Management Llc/oh | 1,170 | 0.00 | 26 | 8.33 | ||||
| 2025-08-13 | 13F | Arrowstreet Capital, Limited Partnership | 236,604 | 13.91 | 5,328 | 22.79 | ||||
| 2025-08-06 | 13F | Paradigm Asset Management Co Llc | 72,500 | 0.00 | 1,633 | 7.79 | ||||
| 2025-08-14 | 13F | State Street Corp | 32,135 | 0.00 | 724 | 7.75 | ||||
| 2025-08-04 | 13F | Simon Quick Advisors, Llc | 14,997 | 338 | ||||||
| 2025-08-06 | 13F | Golden State Wealth Management, LLC | 35 | 0.00 | 1 | |||||
| 2025-08-07 | 13F | Zions Bancorporation, National Association /ut/ | 175 | 0.00 | 4 | 0.00 | ||||
| 2025-08-12 | 13F | Soundwatch Capital LLC | 1,125 | 674 | ||||||
| 2025-07-28 | NP | AVSD - Avantis Responsible International Equity ETF | 17,524 | 203.97 | 373 | 217.95 | ||||
| 2025-04-21 | 13F | Nelson, Van Denburg & Campbell Wealth Management Group, LLC | 0 | -100.00 | 0 | |||||
| 2025-08-05 | 13F | GPS Wealth Strategies Group, LLC | 20 | 150.00 | 0 | |||||
| 2025-08-07 | 13F | Vise Technologies, Inc. | 39,597 | 598.61 | 892 | 48.01 | ||||
| 2025-07-30 | 13F | Blume Capital Management, Inc. | 15 | 0 | ||||||
| 2025-07-14 | 13F | Abound Wealth Management | 20 | 0.00 | 0 | |||||
| 2025-07-22 | 13F | Knights of Columbus Asset Advisors LLC | 7,774 | 0.00 | 175 | 8.02 | ||||
| 2025-08-14 | 13F | UBS Group AG | 11,756 | 6.10 | 265 | 14.29 | ||||
| 2025-08-14 | 13F/A | Skopos Labs, Inc. | 3,343 | 151.54 | 75 | 177.78 | ||||
| 2025-07-21 | 13F | Cromwell Holdings LLC | 3,050 | 0.00 | 69 | 7.94 | ||||
| 2025-08-08 | 13F | Tortoise Investment Management, LLC | 101 | 1.00 | 2 | 0.00 | ||||
| 2025-08-14 | 13F | Colony Group, LLC | 10,178 | 229 | ||||||
| 2025-08-07 | 13F | Parkside Financial Bank & Trust | 245 | 0.00 | 6 | 0.00 | ||||
| 2025-08-11 | 13F | GW&K Investment Management, LLC | 265 | 0.00 | 0 | |||||
| 2025-07-22 | 13F | Checchi Capital Advisers, LLC | 12,082 | -11.19 | 272 | -4.23 | ||||
| 2025-07-11 | 13F | BTC Capital Management, Inc. | 101,497 | 3.97 | 2,286 | 12.06 | ||||
| 2025-08-27 | NP | TPIAX - Timothy Plan International Fund Class A | 123,000 | -41.43 | 2,770 | -36.87 | ||||
| 2025-04-23 | 13F | Mascagni Wealth Management, Inc. | 0 | -100.00 | 0 | |||||
| 2025-07-24 | 13F | Us Bancorp \de\ | 54,052 | 22.64 | 1,217 | 32.28 | ||||
| 2025-08-07 | 13F | Allworth Financial LP | 614 | 0.00 | 14 | 8.33 | ||||
| 2025-07-30 | 13F | Ethic Inc. | 11,783 | 8.89 | 261 | 16.00 | ||||
| 2025-07-23 | 13F | Hardy Reed LLC | 13,525 | 0.74 | 305 | 8.57 | ||||
| 2025-08-13 | 13F | Healthcare Of Ontario Pension Plan Trust Fund | 178,000 | -71.81 | 4,009 | -69.62 | ||||
| 2025-05-15 | 13F | Aquatic Capital Management LLC | 0 | -100.00 | 0 | |||||
| 2025-07-11 | 13F | Pinnacle Bancorp, Inc. | 175 | 0.00 | 4 | 0.00 | ||||
| 2025-08-14 | 13F | D. E. Shaw & Co., Inc. | 33,533 | -70.54 | 755 | -68.24 | ||||
| 2025-07-11 | 13F/A | Umb Bank N A/mo | 740 | -11.38 | 17 | -5.88 | ||||
| 2025-08-07 | 13F | Campbell & CO Investment Adviser LLC | 89,988 | 26.68 | 2,027 | 36.61 | ||||
| 2025-04-11 | 13F | First Affirmative Financial Network | 14,712 | 360.04 | 307 | -9.44 | ||||
| 2025-07-15 | 13F | Fifth Third Bancorp | 36,933 | 0.97 | 832 | 8.77 | ||||
| 2025-08-14 | 13F | RMB Capital Management, LLC | 61,772 | 16.99 | 1,391 | 26.11 | ||||
| 2025-07-24 | 13F | Lester Murray Antman dba SimplyRich | 45,636 | 45.12 | 1 | |||||
| 2025-07-17 | 13F | Clean Yield Group | 0 | -100.00 | 0 | |||||
| 2025-07-22 | 13F | Net Worth Advisory Group | 11,413 | -0.95 | 257 | 7.08 | ||||
| 2025-08-12 | 13F | Proequities, Inc. | 0 | 0 | ||||||
| 2025-07-16 | 13F | American National Bank | 0 | -100.00 | 0 | |||||
| 2025-08-14 | 13F | Systematic Alpha Investments, LLC | 24,810 | 0.00 | 559 | 7.72 | ||||
| 2025-07-09 | 13F | Gilman Hill Asset Management, LLC | 196,669 | 0.36 | 4,429 | 8.18 | ||||
| 2025-04-29 | 13F | Callan Capital, LLC | 69,576 | 496.81 | 1,453 | 17.37 | ||||
| 2025-05-15 | 13F | Two Sigma Investments, Lp | 0 | -100.00 | 0 | |||||
| 2025-08-12 | 13F | Gitterman Wealth Management, LLC | 1,890 | -80.76 | 43 | -79.51 | ||||
| 2025-08-12 | 13F | Summit Global Investments | 19,157 | 16.65 | 0 | |||||
| 2025-08-13 | 13F | Jones Financial Companies Lllp | 554 | -37.05 | 12 | -33.33 | ||||
| 2025-07-30 | 13F | Rnc Capital Management Llc | 14,420 | 12.92 | 325 | 21.80 | ||||
| 2025-08-04 | 13F | Assetmark, Inc | 28,145 | -4.37 | 634 | 3.09 | ||||
| 2025-07-18 | 13F | Naples Global Advisors, Llc | 92,365 | 0.83 | 2,080 | 7.60 | ||||
| 2025-08-14 | 13F | Wetherby Asset Management Inc | 36,581 | 344.21 | 824 | -5.84 | ||||
| 2025-04-21 | 13F | Envestnet Portfolio Solutions, Inc. | 0 | -100.00 | 0 | |||||
| 2025-08-12 | 13F | American Century Companies Inc | 543,509 | 16.29 | 12,240 | 25.36 | ||||
| 2025-08-14 | 13F | Raymond James Financial Inc | 17,157 | 2.74 | 386 | 10.92 | ||||
| 2025-08-11 | 13F | Pinnacle Wealth Planning Services, Inc. | 9,243 | 208 | ||||||
| 2025-05-15 | 13F | Citadel Advisors Llc | 0 | -100.00 | 0 | |||||
| 2025-07-09 | 13F | Aaron Wealth Advisors LLC | 25,970 | 17.74 | 585 | 26.96 | ||||
| 2025-08-12 | 13F | Rhumbline Advisers | 43,195 | -0.00 | 973 | 7.76 | ||||
| 2025-08-13 | 13F | Northern Trust Corp | 1,069,463 | -0.06 | 24,084 | 7.74 | ||||
| 2025-07-17 | 13F | Greenleaf Trust | 37,035 | -15.35 | 834 | -8.65 | ||||
| 2025-08-07 | 13F | Acadian Asset Management Llc | 685 | 0 | ||||||
| 2025-06-26 | NP | SNTKX - Steward International Enhanced Index Fund Class A | 78,460 | 580.19 | 1,574 | 28.93 | ||||
| 2025-04-24 | 13F | Decker Retirement Planning Inc. | 0 | -100.00 | 0 | |||||
| 2025-07-31 | 13F | CVA Family Office, LLC | 168 | -1.18 | 4 | 0.00 | ||||
| 2025-07-24 | 13F | Callan Family Office, LLC | 66,285 | 129.48 | 1,493 | 147.43 |
Other Listings
| DE:OIXA | € 22.00 |