Mga Batayang Estadistika
| Pemilik Institusional | 284 total, 284 long only, 0 short only, 0 long/short - change of 0.35% MRQ |
| Alokasi Portofolio Rata-rata | 0.2280 % - change of -17.43% MRQ |
| Saham Institusional (Jangka Panjang) | 42,172,592 (ex 13D/G) - change of -2.22MM shares -5.00% MRQ |
| Nilai Institusional (Jangka Panjang) | $ 470,262 USD ($1000) |
Kepemilikan Institusional dan Pemegang Saham
Nuveen AMT-Free Municipal Credit Income Fund (US:NVG) memiliki 284 pemilik institusional dan pemegang saham yang telah mengajukan formulir 13D/G atau 13F kepada Komisi Bursa Efek (Securities Exchange Commission/SEC). Lembaga-lembaga ini memegang total 42,172,592 saham. Pemegang saham terbesar meliputi Rivernorth Capital Management, Llc, Morgan Stanley, Mackay Shields Llc, Wells Fargo & Company/mn, UBS Group AG, Guggenheim Capital Llc, Hennion & Walsh Asset Management, Inc., Bank Of America Corp /de/, XMPT - VanEck Vectors CEF Municipal Income ETF, and Van Eck Associates Corp .
Struktur kepemilikan institusional Nuveen AMT-Free Municipal Credit Income Fund (NYSE:NVG) menunjukkan posisi terkini di perusahaan oleh institusi dan dana, serta perubahan terbaru dalam ukuran posisi. Pemegang saham utama dapat mencakup investor individu, reksa dana, dana lindung nilai, atau institusi. Jadwal 13D menunjukkan bahwa investor memegang (atau pernah memegang) lebih dari 5% saham perusahaan dan bermaksud (atau pernah bermaksud) untuk secara aktif mengejar perubahan strategi bisnis. Jadwal 13G menunjukkan investasi pasif lebih dari 5%.
The share price as of September 5, 2025 is 11.98 / share. Previously, on September 9, 2024, the share price was 13.18 / share. This represents a decline of 9.10% over that period.

Skor Sentimen Dana
Skor Sentimen Dana (sebelumnya dikenal sebagai Skor Akumulasi Kepemilikan) menemukan saham-saham yang paling banyak dibeli oleh dana. Ini adalah hasil dari model kuantitatif multi-faktor yang canggih yang mengidentifikasi perusahaan dengan tingkat akumulasi institusional tertinggi. Model penilaian menggunakan kombinasi dari total peningkatan pemilik yang diungkapkan, perubahan dalam alokasi portofolio pada pemilik tersebut, dan metrik lainnya. Angka berkisar dari 0 hingga 100, dengan angka yang lebih tinggi menunjukkan tingkat akumulasi yang lebih tinggi dibandingkan dengan perusahaan sejenisnya, dan 50 adalah rata-ratanya.
Frekuensi Pembaruan: Setiap Hari
Lihat Ownership Explorer, yang menyediakan daftar perusahaan dengan peringkat tertinggi.
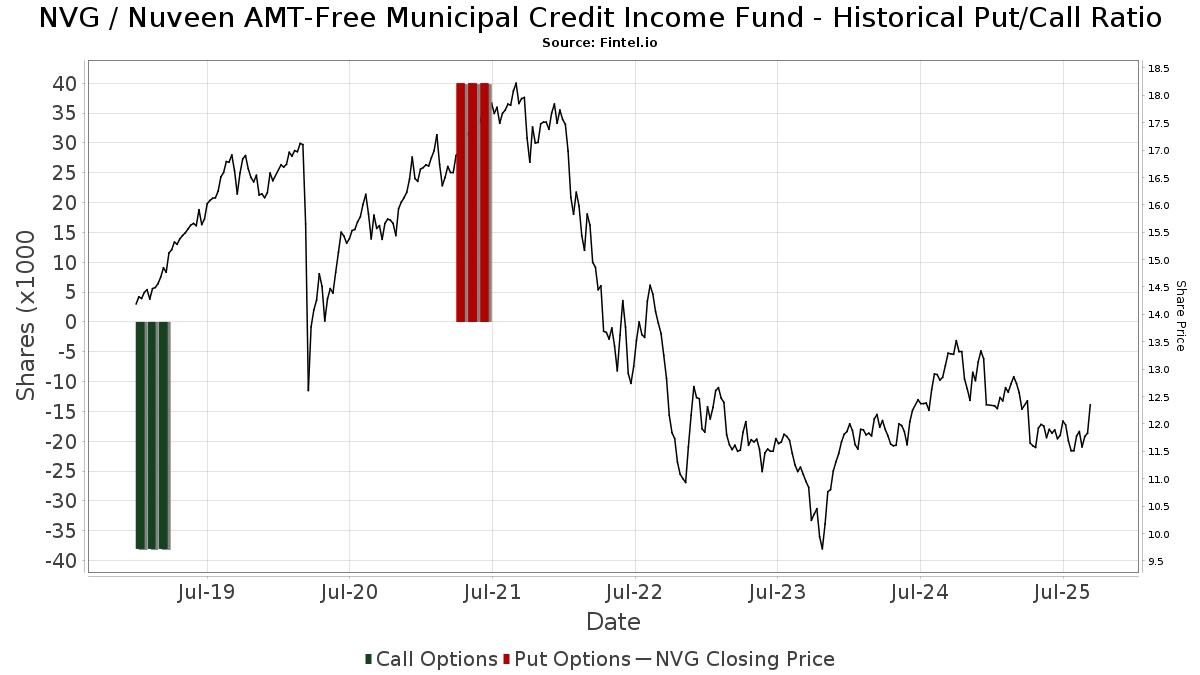
Rasio Put/Call Institusional
Selain melaporkan isu ekuitas dan utang standar, institusi dengan aset di bawah manajemen lebih dari 100 juta dolar AS juga harus mengungkapkan kepemilikan opsi put dan call mereka. Karena opsi put umumnya menunjukkan sentimen negatif, dan opsi call menunjukkan sentimen positif, kita dapat mengetahui sentimen institusional secara keseluruhan dengan memplot rasio put terhadap call. Grafik di sebelah kanan memplot rasio put/call historis untuk instrumen ini.
Menggunakan Rasio Put/Call sebagai indikator sentimen investor mengatasi salah satu kekurangan utama dari penggunaan total kepemilikan institusional, yaitu sejumlah besar aset yang dikelola diinvestasikan secara pasif untuk melacak indeks. Dana yang dikelola secara pasif biasanya tidak membeli opsi, sehingga indikator rasio put/call lebih akurat dalam melacak sentimen dana yang dikelola secara aktif.
Pengajuan 13F dan NPORT
Detail pada pengajuan 13F tersedia gratis. Detail pada pengajuan NP memerlukan keanggotaan premium. Baris berwarna hijau menunjukkan posisi baru. Baris berwarna merah menunjukkan posisi yang sudah ditutup. Klik tautan ini ikon untuk melihat riwayat transaksi selengkapnya.
Tingkatkan
untuk membuka data premium dan mengekspor ke Excel ![]() .
.
| Tanggal File | Sumber | Investor | Ketik | Presyo ng Avg (Silangan) |
Saham | Δ Saham (%) |
Dilaporkan Nilai ($1000) |
Nilai Δ (%) |
Alokasi Port (%) |
|
|---|---|---|---|---|---|---|---|---|---|---|
| 2025-08-28 | NP | RTAI - RAREVIEW TAX ADVANTAGED INCOME ETF | 54,734 | -48.84 | 653 | -50.76 | ||||
| 2025-07-15 | 13F | World Equity Group, Inc. | 16,200 | 8.65 | 193 | 4.89 | ||||
| 2025-08-14 | 13F | GWM Advisors LLC | 153,711 | 5.20 | 1,834 | 1.38 | ||||
| 2025-05-15 | 13F | Alpine Global Management, LLC | 0 | -100.00 | 0 | -100.00 | ||||
| 2025-07-30 | 13F | Avidian Wealth Solutions, LLC | 10,000 | 0.00 | 119 | -3.25 | ||||
| 2025-05-14 | 13F | Visionary Wealth Advisors | 0 | -100.00 | 0 | |||||
| 2025-08-14 | 13F | Royal Bank Of Canada | 337,648 | -20.10 | 4,028 | -23.00 | ||||
| 2025-08-12 | 13F | Wealth Dimensions Group, Ltd. | 18,295 | -24.70 | 218 | -27.33 | ||||
| 2025-07-16 | 13F | Kennedy Investment Group | 241,512 | -6.98 | 2,881 | -10.36 | ||||
| 2025-08-25 | NP | SNTIX - Sit Tax-Free Income Fund | 32,623 | 0.00 | 389 | -3.47 | ||||
| 2025-07-24 | 13F | IFP Advisors, Inc | 760 | 0.00 | 9 | 0.00 | ||||
| 2025-08-14 | 13F | Gould Capital, LLC | 172,692 | 2.08 | 2,060 | -1.62 | ||||
| 2025-08-14 | 13F | Integrated Wealth Concepts LLC | 40,935 | 0.33 | 488 | -3.37 | ||||
| 2025-07-17 | 13F/A | Capital Investment Advisors, LLC | 101,260 | -12.88 | 1,208 | -15.99 | ||||
| 2025-07-14 | 13F | Sowell Financial Services LLC | 34,918 | 0.00 | 417 | -3.70 | ||||
| 2025-07-23 | 13F | InTrack Investment Management Inc | 64,131 | -20.06 | 765 | -22.96 | ||||
| 2025-05-16 | 13F | Coppell Advisory Solutions LLC | 0 | -100.00 | 0 | |||||
| 2025-08-12 | 13F | Advisors Asset Management, Inc. | 520,702 | -0.55 | 6,212 | -4.18 | ||||
| 2025-08-07 | 13F | CENTRAL TRUST Co | 0 | -100.00 | 0 | |||||
| 2025-08-26 | 13F/A | Thrivent Financial For Lutherans | 180,180 | -6.92 | 2 | 0.00 | ||||
| 2025-07-07 | 13F | Wesbanco Bank Inc | 73,556 | 0.00 | 878 | -3.63 | ||||
| 2025-07-08 | 13F | Melone Private Wealth, LLC | 95,035 | 2.29 | 1,125 | -2.17 | ||||
| 2025-08-07 | 13F | Midwest Trust Co | 16,365 | 195 | ||||||
| 2025-07-17 | 13F | Sound Income Strategies, LLC | 1,133 | 0.00 | 14 | -7.14 | ||||
| 2025-07-25 | 13F | Concord Wealth Partners | 3,003 | 0.00 | 36 | -5.41 | ||||
| 2025-08-14 | 13F | UBS Group AG | 1,955,927 | 6.11 | 23,334 | 2.25 | ||||
| 2025-08-14 | 13F | Peapack Gladstone Financial Corp | 0 | -100.00 | 0 | |||||
| 2025-08-04 | 13F | Hantz Financial Services, Inc. | 105 | 1.94 | 0 | |||||
| 2025-07-18 | 13F | Bartlett & Co. Wealth Management Llc | 534 | 0.00 | 6 | 0.00 | ||||
| 2025-08-06 | 13F | Csenge Advisory Group | 12,450 | 148 | ||||||
| 2025-08-13 | 13F | Rinkey Investments | 41,400 | 0.00 | 494 | -3.71 | ||||
| 2025-08-14 | 13F | Mariner, LLC | 113,823 | 14.78 | 1,358 | 10.59 | ||||
| 2025-08-14 | 13F | Wealth Advisors of Tampa Bay, LLC | 115,252 | 0.00 | 1,375 | -3.65 | ||||
| 2025-08-28 | NP | RDFI - RAREVIEW DYNAMIC FIXED INCOME ETF | 44,204 | -50.78 | 527 | -52.57 | ||||
| 2025-08-15 | 13F | Equitable Holdings, Inc. | 25,044 | 19.82 | 299 | 15.50 | ||||
| 2025-07-31 | 13F | Whipplewood Advisors, LLC | 69,461 | 113,770.49 | 829 | -2.24 | ||||
| 2025-08-14 | 13F | CF Capital LLC | 160,949 | -10.00 | 1,919 | -9.14 | ||||
| 2025-07-15 | 13F | Main Street Group, LTD | 3,038 | 31.52 | 36 | 28.57 | ||||
| 2025-08-13 | 13F | Johnson Financial Group, Inc. | 0 | -100.00 | 0 | |||||
| 2025-07-21 | 13F | Future Financial Wealth Managment LLC | 11,800 | 0.00 | 141 | -4.11 | ||||
| 2025-08-14 | 13F | Vista Investment Management | 11,200 | 0.00 | 134 | -3.62 | ||||
| 2025-07-16 | 13F/A | CX Institutional | 19,500 | 0.00 | 0 | |||||
| 2025-08-14 | 13F | Bank Of America Corp /de/ | 1,275,220 | -4.59 | 15,213 | -8.06 | ||||
| 2025-08-12 | 13F | AlphaCore Capital LLC | 25,257 | -12.80 | 303 | -15.83 | ||||
| 2025-08-15 | 13F | Captrust Financial Advisors | 111,719 | 4.47 | 1,333 | 0.68 | ||||
| 2025-08-14 | 13F | Napa Wealth Management | 16,564 | -75.18 | 198 | -76.15 | ||||
| 2025-08-14 | 13F | Wiley Bros.-aintree Capital, Llc | 20,369 | 10.08 | 243 | 7.05 | ||||
| 2025-08-15 | 13F | Tower Research Capital LLC (TRC) | 20 | 0 | ||||||
| 2025-07-24 | 13F | Ronald Blue Trust, Inc. | 1,029 | 0.68 | 12 | 0.00 | ||||
| 2025-08-06 | 13F | Savant Capital, LLC | 10,020 | 0.10 | 120 | -3.25 | ||||
| 2025-07-08 | 13F | Parallel Advisors, LLC | 533 | 6 | ||||||
| 2025-08-13 | 13F | StoneX Group Inc. | 385,003 | 9.78 | 4,595 | 5.83 | ||||
| 2025-08-18 | 13F/A | Nomura Holdings Inc | 10,000 | 119 | ||||||
| 2025-07-25 | 13F | Community Bank, N.A. | 5,000 | 0.00 | 60 | -3.28 | ||||
| 2025-08-05 | 13F | American Institute for Advanced Investment Management, LLP | 10,211 | 0.00 | 122 | -3.97 | ||||
| 2025-08-07 | 13F | Ibex Wealth Advisors | 22,317 | -8.03 | 266 | -11.33 | ||||
| 2025-08-08 | 13F | Fiera Capital Corp | 150,262 | -1.28 | 1,793 | -4.88 | ||||
| 2025-08-11 | 13F | Morling Financial Advisors, LLC | 13,751 | 1.97 | 164 | -1.20 | ||||
| 2025-08-12 | 13F | Steward Partners Investment Advisory, Llc | 39,379 | -57.64 | 470 | -59.22 | ||||
| 2025-05-12 | 13F | Sandy Spring Bank | 1,475 | 0.48 | 18 | 5.88 | ||||
| 2025-07-17 | 13F | Janney Montgomery Scott LLC | 58,015 | -20.89 | 1 | |||||
| 2025-08-29 | NP | PIMCO Flexible Municipal Income Fund | 470,900 | 0.00 | 5,618 | -3.64 | ||||
| 2025-07-25 | NP | PMSAX - Global Multi-Strategy Fund Class A | 32,880 | 0.00 | 392 | -7.78 | ||||
| 2025-08-14 | 13F | Goldman Sachs Group Inc | 48,505 | 1.04 | 579 | -2.69 | ||||
| 2025-07-14 | 13F | Gries Financial Llc | 0 | -100.00 | 0 | |||||
| 2025-08-04 | 13F | Wealth Management Associates, Inc. | 13,776 | -2.05 | 164 | -5.75 | ||||
| 2025-07-09 | 13F | VisionPoint Advisory Group, LLC | 21,993 | 30.67 | 262 | 25.96 | ||||
| 2025-08-15 | 13F | Kestra Advisory Services, LLC | 253,368 | 72.54 | 3,023 | 66.32 | ||||
| 2025-08-07 | 13F | 1620 Investment Advisors, Inc. | 270 | 91.49 | 3 | -66.67 | ||||
| 2025-08-12 | 13F | Proequities, Inc. | 0 | 0 | ||||||
| 2025-08-01 | 13F | Envestnet Asset Management Inc | 23,363 | -4.19 | 279 | -7.64 | ||||
| 2025-04-29 | 13F | McGlone Suttner Wealth Management, Inc. | 0 | -100.00 | 0 | |||||
| 2025-04-18 | 13F | Prosperity Wealth Management, Inc. | 0 | -100.00 | 0 | |||||
| 2025-05-08 | 13F | Plante Moran Financial Advisors, LLC | 0 | -100.00 | 0 | |||||
| 2025-08-13 | 13F | Texas Capital Bank Wealth Management Services Inc | 26,805 | 0.00 | 320 | -3.63 | ||||
| 2025-08-14 | 13F | Jane Street Group, Llc | 44,245 | 528 | ||||||
| 2025-08-14 | 13F | German American Bancorp, Inc. | 14,933 | 178 | ||||||
| 2025-07-17 | 13F | LexAurum Advisors, LLC | 10,000 | 0.00 | 119 | -3.25 | ||||
| 2025-07-22 | 13F | Kercheville Advisors, LLC | 25,534 | 0.09 | 305 | -3.49 | ||||
| 2025-08-07 | 13F | Montag A & Associates Inc | 1,925 | 0.00 | 23 | 0.00 | ||||
| 2025-07-16 | 13F | American National Bank | 24,716 | 93.65 | 295 | 86.08 | ||||
| 2025-05-19 | 13F | Smith Asset Management Co., LLC | 93,713 | -1.64 | 1,160 | -0.68 | ||||
| 2025-07-22 | 13F | Powell Investment Advisors, LLC | 12,511 | 0.36 | 150 | -3.23 | ||||
| 2025-07-25 | 13F | Cwm, Llc | 26,222 | -20.54 | 0 | |||||
| 2025-08-14 | 13F | Hilltop Holdings Inc. | 11,023 | 0.00 | 132 | -3.68 | ||||
| 2025-07-08 | 13F | Nbc Securities, Inc. | 16,158 | -23.14 | 0 | |||||
| 2025-05-15 | 13F | Two Sigma Securities, Llc | 0 | -100.00 | 0 | |||||
| 2025-08-11 | 13F | Traub Capital Management LLC | 5,302 | 63 | ||||||
| 2025-08-14 | 13F | Robinson Capital Management, Llc | 440,998 | -41.17 | 5,261 | -43.30 | ||||
| 2025-07-22 | 13F | Chung Wu Investment Group, LLC | 6,000 | 72 | ||||||
| 2025-07-17 | 13F | Melfa Wealth Management, Llc | 183,082 | 0.11 | 2,184 | -3.49 | ||||
| 2025-07-31 | 13F | Cambridge Investment Research Advisors, Inc. | 143,290 | -12.36 | 2 | -50.00 | ||||
| 2025-08-13 | 13F | Invesco Ltd. | 182,142 | 6.28 | 2,173 | 2.40 | ||||
| 2025-08-08 | 13F | Hartland & Co., LLC | 25,849 | 0.44 | 308 | -3.14 | ||||
| 2025-08-13 | 13F | Lido Advisors, LLC | 109,625 | 6.82 | 1,316 | 2.90 | ||||
| 2025-08-12 | 13F | LPL Financial LLC | 758,483 | -11.30 | 9,049 | -14.53 | ||||
| 2025-08-15 | 13F | Morgan Stanley | 2,703,366 | 6.64 | 32,251 | 2.76 | ||||
| 2025-08-04 | 13F | Pinnacle Associates Ltd | 98,885 | 0.00 | 1,180 | -3.68 | ||||
| 2025-08-07 | 13F | Kestra Private Wealth Services, Llc | 18,306 | -7.26 | 218 | -10.66 | ||||
| 2025-08-14 | 13F | Ancora Advisors, LLC | 11,452 | -3.30 | 137 | -6.85 | ||||
| 2025-08-27 | NP | RMMBX - Aspiriant Risk-Managed Municipal Bond Fund | 21,460 | -0.48 | 256 | -3.76 | ||||
| 2025-08-28 | NP | RiverNorth Opportunistic Municipal Income Fund, Inc. | 155,677 | -4.73 | 1,857 | -8.16 | ||||
| 2025-08-27 | NP | ROBAX - Robinson Tax Advantaged Income Fund Class A Shares | 440,998 | -41.17 | 5,261 | -43.30 | ||||
| 2025-07-29 | 13F | Tradewinds Capital Management, LLC | 1,931 | 0.00 | 23 | 0.00 | ||||
| 2025-07-14 | 13F | Gridiron Partners, LLC | 232,728 | 0.00 | 2,776 | -3.64 | ||||
| 2025-07-28 | 13F | Axxcess Wealth Management, Llc | 37,131 | 0.09 | 443 | -3.70 | ||||
| 2025-08-01 | 13F | Bessemer Group Inc | 850 | -82.28 | 0 | |||||
| 2025-08-13 | 13F | First Trust Advisors Lp | 16,208 | -2.02 | 193 | -5.39 | ||||
| 2025-05-09 | 13F | Atria Wealth Solutions, Inc. | 0 | -100.00 | 0 | |||||
| 2025-07-21 | 13F | Hudson Valley Investment Advisors Inc /adv | 10,500 | 0.00 | 125 | -3.10 | ||||
| 2025-08-07 | 13F | PFG Advisors | 0 | -100.00 | 0 | |||||
| 2025-08-05 | 13F | Bank Of Montreal /can/ | 12,540 | 2.14 | 150 | -1.32 | ||||
| 2025-08-13 | 13F | Cresset Asset Management, LLC | 13,670 | -29.25 | 164 | -31.67 | ||||
| 2025-08-07 | 13F | Commerce Bank | 14,645 | 15.82 | 175 | 11.54 | ||||
| 2025-04-17 | 13F | Bayshore Asset Management, Llc | 0 | -100.00 | 0 | |||||
| 2025-08-13 | 13F | Transce3nd, LLC | 72 | 0.00 | 1 | |||||
| 2025-07-31 | 13F | CNB Bank | 176 | 0.00 | 2 | 0.00 | ||||
| 2025-07-22 | 13F | DAVENPORT & Co LLC | 21,347 | -0.77 | 255 | -4.51 | ||||
| 2025-07-29 | 13F | Burford Brothers, Inc. | 22,730 | 271 | ||||||
| 2025-07-29 | 13F | Activest Wealth Management | 350 | 0.00 | 4 | 0.00 | ||||
| 2025-07-31 | 13F | Pacitti Group Inc. | 42,125 | -7.77 | 503 | -11.15 | ||||
| 2025-07-14 | 13F | U.S. Capital Wealth Advisors, LLC | 16,433 | 196 | ||||||
| 2025-07-21 | 13F | Ameritas Advisory Services, LLC | 4,431 | 53 | ||||||
| 2025-08-14 | 13F | Benjamin Edwards Inc | 21,077 | 0.00 | 251 | -3.46 | ||||
| 2025-06-24 | NP | MMHVX - MainStay MacKay High Yield Municipal Bond Fund Investor Class | 827,673 | -0.48 | 9,866 | -5.93 | ||||
| 2025-07-10 | 13F | Wealth Enhancement Advisory Services, Llc | 79,427 | 4.08 | 956 | 1.17 | ||||
| 2025-08-14 | 13F | First Foundation Advisors | 0 | -100.00 | 0 | |||||
| 2025-08-06 | 13F | Commonwealth Equity Services, Llc | 449,781 | 4.25 | 5 | 0.00 | ||||
| 2025-08-05 | 13F | Bank of New York Mellon Corp | 10,780 | 6.57 | 129 | 2.40 | ||||
| 2025-08-18 | 13F | Geneos Wealth Management Inc. | 3,775 | 65.06 | 45 | 60.71 | ||||
| 2025-08-04 | 13F | Saxony Capital Management, LLC | 25,388 | 0.00 | 303 | -3.82 | ||||
| 2025-07-22 | 13F | Global Assets Advisory, LLC | 0 | -100.00 | 0 | |||||
| 2025-07-30 | 13F | D.a. Davidson & Co. | 31,273 | -10.65 | 373 | -13.86 | ||||
| 2025-07-29 | 13F | Oxbow Advisors, LLC | 43,535 | 0.00 | 519 | -3.53 | ||||
| 2025-04-15 | 13F | Noble Wealth Management PBC | 2,250 | 0.00 | 28 | 0.00 | ||||
| 2025-08-14 | 13F/A | Rockefeller Capital Management L.P. | 267,403 | 5.33 | 3,190 | 1.53 | ||||
| 2025-07-15 | 13F | North Star Investment Management Corp. | 1,523 | 0.00 | 18 | 0.00 | ||||
| 2025-08-14 | 13F | Van Eck Associates Corp | 1,047,013 | 0.35 | 12 | 0.00 | ||||
| 2025-08-12 | 13F | Park Square Financial Group, LLC | 1,700 | 0.00 | 20 | -4.76 | ||||
| 2025-08-26 | NP | WCERX - WCM Alternatives: Event-Driven Fund - Investor Class Shares | 67,123 | 0.00 | 801 | -3.61 | ||||
| 2025-07-11 | 13F | Busey Wealth Management | 14,967 | 0.00 | 179 | -3.78 | ||||
| 2025-08-04 | 13F | Arkadios Wealth Advisors | 88,542 | 24.88 | 1,056 | 20.41 | ||||
| 2025-08-14 | 13F | Westchester Capital Management, LLC | 123,412 | 0.00 | 1,472 | -3.60 | ||||
| 2025-08-14 | 13F | Hurley Capital, LLC | 3,169 | 38 | ||||||
| 2025-05-16 | 13F | Capital & Planning, Llc | 0 | -100.00 | 0 | |||||
| 2025-08-05 | 13F | Magnolia Capital Advisors Llc | 10,446 | 0.00 | 125 | -3.88 | ||||
| 2025-08-08 | 13F | Avantax Advisory Services, Inc. | 23,819 | -15.60 | 284 | -18.62 | ||||
| 2025-08-11 | 13F | Principal Securities, Inc. | 0 | -100.00 | 0 | |||||
| 2025-08-11 | 13F | Elequin Capital Lp | 0 | -100.00 | 0 | |||||
| 2025-08-08 | 13F | Kingsview Wealth Management, LLC | 73,693 | 77.70 | 879 | 71.35 | ||||
| 2025-07-24 | 13F | Mackay Shields Llc | 2,411,254 | -0.51 | 28,766 | -4.13 | ||||
| 2025-08-12 | 13F | Founders Financial Alliance, LLC | 52,211 | 1.44 | 623 | -2.35 | ||||
| 2025-08-14 | 13F | Wells Fargo & Company/mn | 1,986,149 | -4.93 | 23,695 | -8.39 | ||||
| 2025-08-18 | 13F | Hollencrest Capital Management | 40,672 | 0.00 | 485 | -3.58 | ||||
| 2025-07-25 | NP | MFLX - First Trust Municipal CEF Income Opportunity ETF This fund is a listed as child fund of First Trust Advisors Lp and if that institution has disclosed ownership in this security, then these positions will not be double counted when calculating total shares and total value | 9,457 | 0.00 | 113 | -8.20 | ||||
| 2025-07-22 | 13F | Fortitude Advisory Group L.L.C. | 18,287 | 0.00 | 218 | 2.83 | ||||
| 2025-07-22 | 13F | Compass Financial Group, INC/SD | 31,661 | -7.41 | 378 | -10.87 | ||||
| 2025-07-31 | 13F | Oppenheimer & Co Inc | 107,014 | 1.43 | 1,277 | -2.30 | ||||
| 2025-07-25 | 13F | Allspring Global Investments Holdings, LLC | 19,503 | -58.06 | 233 | -59.65 | ||||
| 2025-07-28 | 13F | Harbour Investments, Inc. | 49,370 | 14.28 | 589 | 10.11 | ||||
| 2025-07-09 | 13F | Pallas Capital Advisors LLC | 61,390 | 0.00 | 732 | -3.68 | ||||
| 2025-08-13 | 13F | Baird Financial Group, Inc. | 67,167 | 0.63 | 801 | -3.03 | ||||
| 2025-04-25 | 13F | Smallwood Wealth Investment Management, LLC | 2,301 | 28 | ||||||
| 2025-07-11 | 13F | Adirondack Trust Co | 1,550 | 0.00 | 18 | -5.26 | ||||
| 2025-05-14 | 13F | Landscape Capital Management, L.l.c. | 0 | -100.00 | 0 | |||||
| 2025-08-08 | 13F | Creative Planning | 147,445 | -8.62 | 1,759 | -11.92 | ||||
| 2025-08-28 | NP | RiverNorth Managed Duration Municipal Income Fund II, Inc. | 93,095 | -11.53 | 1,111 | -14.75 | ||||
| 2025-07-29 | 13F | Private Trust Co Na | 5,039 | -80.85 | 60 | -81.54 | ||||
| 2025-07-23 | 13F | Tyche Wealth Partners LLC | 120,263 | 0.21 | 1,435 | -3.43 | ||||
| 2025-07-08 | 13F | Webster Bank, N. A. | 12,588 | 0.00 | 150 | -3.23 | ||||
| 2025-07-28 | 13F | Duncker Streett & Co Inc | 22,069 | 263 | ||||||
| 2025-07-16 | 13F | MKT Advisors LLC | 10,350 | 0.00 | 124 | 2.48 | ||||
| 2025-07-21 | 13F | Portfolio Strategies, Inc. | 22,041 | -0.63 | 263 | -4.38 | ||||
| 2025-08-07 | 13F | Hennion & Walsh Asset Management, Inc. | 1,423,011 | -4.70 | 16,977 | -8.16 | ||||
| 2025-08-14 | 13F | Main Street Financial Solutions, LLC | 19,870 | 0.00 | 237 | -3.27 | ||||
| 2025-08-07 | 13F | Allworth Financial LP | 31,684 | 4,678.88 | 378 | 5,285.71 | ||||
| 2025-07-23 | 13F | Prime Capital Investment Advisors, LLC | 23,020 | -4.19 | 275 | -7.74 | ||||
| 2025-08-04 | 13F | Field & Main Bank | 866 | 0.00 | 10 | 0.00 | ||||
| 2025-08-11 | 13F | Rothschild Investment Llc | 13,379 | -89.40 | 160 | -89.82 | ||||
| 2025-04-09 | 13F | Milestone Asset Management, Llc | 0 | -100.00 | 0 | |||||
| 2025-08-11 | 13F | HighTower Advisors, LLC | 360,211 | 1.48 | 4,297 | -2.21 | ||||
| 2025-08-14 | 13F | Hrt Financial Lp | 24,473 | 0 | ||||||
| 2025-07-15 | 13F | Mather Group, Llc. | 0 | -100.00 | 0 | |||||
| 2025-08-11 | 13F | Annis Gardner Whiting Capital Advisors, LLC | 1,733 | 0.00 | 21 | -4.76 | ||||
| 2025-05-08 | 13F | XTX Topco Ltd | 0 | -100.00 | 0 | |||||
| 2025-07-23 | 13F | Tectonic Advisors Llc | 55,687 | -24.04 | 664 | -26.79 | ||||
| 2025-08-07 | 13F | Atala Financial Inc | 20,200 | -81.38 | 241 | -82.13 | ||||
| 2025-05-12 | 13F | Fmr Llc | 0 | -100.00 | 0 | |||||
| 2025-05-14 | 13F | Oarsman Capital, Inc. | 0 | -100.00 | 0 | |||||
| 2025-08-12 | 13F | CIBC Private Wealth Group, LLC | 4,000 | 0.00 | 48 | 4.44 | ||||
| 2025-08-14 | 13F | Comerica Bank | 26,061 | -0.10 | 311 | -3.73 | ||||
| 2025-07-25 | 13F | LRI Investments, LLC | 1,604 | 0.00 | 19 | 0.00 | ||||
| 2025-08-14 | 13F | CoreCap Advisors, LLC | 149,145 | 0.26 | 1,779 | -3.37 | ||||
| 2025-08-14 | 13F | Mercer Global Advisors Inc /adv | 32,267 | -5.95 | 385 | -9.43 | ||||
| 2025-07-23 | 13F | Element Wealth, LLC | 28,527 | 0.00 | 340 | -3.68 | ||||
| 2025-07-28 | 13F | Wealthspan Partners, Llc | 11,831 | 0.31 | 141 | -3.42 | ||||
| 2025-05-30 | NP | Rivernorth Opportunities Fund, Inc. | 243,557 | -26.14 | 3,015 | -25.41 | ||||
| 2025-07-29 | 13F | Sage Private Wealth Group, Llc | 11,473 | 0.00 | 137 | -4.23 | ||||
| 2025-07-29 | 13F | Salomon & Ludwin, LLC | 162 | 2 | ||||||
| 2025-08-27 | NP | JNL SERIES TRUST - JNL/Westchester Capital Event Driven Fund (A) | 11,295 | 0.00 | 135 | -3.60 | ||||
| 2025-04-21 | 13F | Kingswood Wealth Advisors, Llc | 0 | -100.00 | 0 | |||||
| 2025-08-04 | 13F | Daymark Wealth Partners, Llc | 16,000 | -20.32 | 191 | -23.39 | ||||
| 2025-08-14 | 13F | Karpus Management, Inc. | 235,800 | 496.96 | 2,813 | 475.26 | ||||
| 2025-07-29 | 13F | Stratos Wealth Partners, LTD. | 47,853 | -3.64 | 571 | -7.17 | ||||
| 2025-08-12 | 13F | MAI Capital Management | 2,037 | 0.39 | 24 | -4.00 | ||||
| 2025-05-29 | NP | MCTOX - Modern Capital Tactical Opportunities Fund Class A Shares | 18,447 | 228 | ||||||
| 2025-08-06 | 13F | Atlantic Union Bankshares Corp | 1,468 | 18 | ||||||
| 2025-07-17 | 13F | Sonora Investment Management Group, LLC | 43,279 | 0.00 | 516 | -3.55 | ||||
| 2025-07-16 | 13F | Dakota Wealth Management | 85,610 | 1,022 | ||||||
| 2025-07-24 | 13F | Us Bancorp \de\ | 5,465 | 0.00 | 65 | -2.99 | ||||
| 2025-08-13 | 13F | Plan Group Financial, LLC | 17,844 | 213 | ||||||
| 2025-07-18 | 13F | Truist Financial Corp | 64,215 | -31.67 | 766 | -34.14 | ||||
| 2025-07-30 | 13F | Cornerstone Advisory, LLC | 607,480 | 25.99 | 7,247 | 25.27 | ||||
| 2025-05-14 | 13F | Walleye Capital LLC | 0 | -100.00 | 0 | |||||
| 2025-08-14 | 13F | Broyhill Asset Management | 158,340 | -37.76 | 1,889 | -40.04 | ||||
| 2025-08-14 | 13F | Raymond James Financial Inc | 1,014,706 | -6.88 | 12,105 | -10.26 | ||||
| 2025-08-25 | 13F | Silverlake Wealth Management Llc | 70,179 | 2.86 | 837 | -0.83 | ||||
| 2025-08-13 | 13F | Haverford Trust Co | 16,133 | 0.00 | 192 | -3.52 | ||||
| 2025-07-29 | 13F | Koshinski Asset Management, Inc. | 28,059 | -11.67 | 335 | -15.01 | ||||
| 2025-05-29 | NP | RYMSX - Guggenheim Multi-Hedge Strategies Fund Class P | 52 | -94.38 | 1 | -100.00 | ||||
| 2025-07-29 | 13F | Signature Estate & Investment Advisors Llc | 50,613 | 0.00 | 604 | -3.67 | ||||
| 2025-08-13 | 13F | Level Four Advisory Services, Llc | 0 | -100.00 | 0 | |||||
| 2025-08-13 | 13F | Townsquare Capital Llc | 0 | -100.00 | 0 | |||||
| 2025-08-14 | 13F | Cohen & Steers, Inc. | 341,266 | -8.03 | 4 | 0.00 | ||||
| 2025-04-28 | 13F | Keybank National Association/oh | 0 | -100.00 | 0 | |||||
| 2025-08-06 | 13F | Prospera Financial Services Inc | 75,307 | 0.98 | 898 | -2.71 | ||||
| 2025-07-16 | 13F | TOWER TRUST & INVESTMENT Co | 974 | 0.00 | 12 | 0.00 | ||||
| 2025-08-12 | 13F | Left Brain Wealth Management, LLC | 42,550 | 36.16 | 508 | 31.35 | ||||
| 2025-08-14 | 13F | Susquehanna International Group, Llp | 43,426 | 518 | ||||||
| 2025-07-31 | 13F | CVA Family Office, LLC | 21 | 0.00 | 0 | |||||
| 2025-08-14 | 13F | Ameriprise Financial Inc | 385,314 | 3.44 | 4,597 | -0.30 | ||||
| 2025-08-11 | 13F | Outlook Wealth Advisors, LLC | 10,173 | 121 | ||||||
| 2025-07-18 | 13F | PFG Investments, LLC | 22,201 | -16.79 | 265 | -20.00 | ||||
| 2025-08-11 | 13F | FSA Wealth Management LLC | 5,700 | 0.00 | 68 | -2.86 | ||||
| 2025-08-28 | NP | RiverNorth Flexible Municipal Income Fund II, Inc. | 837,951 | -3.62 | 9,997 | -7.13 | ||||
| 2025-08-13 | 13F | Truvestments Capital Llc | 1,497 | 0.00 | 18 | -5.56 | ||||
| 2025-07-24 | 13F | Eastern Bank | 0 | -100.00 | 0 | |||||
| 2025-08-13 | 13F | Northwestern Mutual Wealth Management Co | 67,744 | -30.56 | 808 | -33.06 | ||||
| 2025-08-14 | 13F | Novus Advisors, Llc | 0 | -100.00 | 0 | |||||
| 2025-08-14 | 13F | Sentinus, LLC | 16,756 | 0.00 | 200 | -3.86 | ||||
| 2025-07-31 | 13F | Richards, Merrill & Peterson, Inc. | 0 | -100.00 | 0 | |||||
| 2025-05-30 | NP | RNCOX - RiverNorth Core Opportunity Fund Class R | 42,606 | -33.73 | 527 | -33.12 | ||||
| 2025-08-19 | 13F | Anchor Investment Management, LLC | 4,000 | 0.00 | 48 | -4.08 | ||||
| 2025-07-21 | 13F | Ameriflex Group, Inc. | 3,426 | 41 | ||||||
| 2025-08-01 | 13F | Motco | 9,257 | 0.00 | 108 | -6.14 | ||||
| 2025-08-01 | 13F | FSA Advisors, Inc. | 42,644 | 509 | ||||||
| 2025-08-07 | 13F | Evoke Wealth, Llc | 29,000 | 0.00 | 348 | -3.60 | ||||
| 2025-08-11 | 13F | Private Advisor Group, LLC | 109,060 | -2.25 | 1,301 | -5.79 | ||||
| 2025-08-12 | 13F | Pathstone Holdings, LLC | 0 | -100.00 | 0 | |||||
| 2025-05-07 | 13F | WMS Partners, LLC | 0 | -100.00 | 0 | |||||
| 2025-05-15 | 13F | Buckingham Strategic Partners | 0 | -100.00 | 0 | |||||
| 2025-08-13 | 13F | Congress Wealth Management LLC / DE / | 10,450 | 0.00 | 125 | -3.88 | ||||
| 2025-08-14 | 13F | CoreFirst Bank & Trust | 615 | 7 | ||||||
| 2025-08-14 | 13F | Sit Investment Associates Inc | 341,556 | -25.95 | 4 | -20.00 | ||||
| 2025-07-23 | 13F | First Merchants Corp | 12,880 | 0.00 | 154 | -3.77 | ||||
| 2025-08-12 | 13F | Insigneo Advisory Services, Llc | 15,105 | 5.90 | 180 | 2.27 | ||||
| 2025-08-08 | 13F | Cetera Investment Advisers | 172,743 | 12.87 | 2,061 | 8.76 | ||||
| 2025-07-14 | 13F | AdvisorNet Financial, Inc | 1,724 | 0.00 | 21 | -4.76 | ||||
| 2025-08-01 | 13F | Financial Counselors Inc | 0 | -100.00 | 0 | |||||
| 2025-08-08 | 13F | Richmond Brothers, Inc. | 38,589 | 0.00 | 460 | -3.56 | ||||
| 2025-08-14 | 13F | Archetype Wealth Partners | 23,320 | 0.00 | 0 | |||||
| 2025-08-28 | NP | Cohen & Steers Closed-end Opportunity Fund, Inc. | 197,978 | -13.08 | 2,362 | -16.25 | ||||
| 2025-07-24 | 13F | JNBA Financial Advisors | 1,843 | 0.00 | 22 | -4.55 | ||||
| 2025-07-11 | 13F | Congress Park Capital LLC | 425,000 | -5.56 | 5,070 | -8.99 | ||||
| 2025-07-21 | 13F | Patriot Financial Group Insurance Agency, LLC | 13,858 | 7.98 | 165 | 4.43 | ||||
| 2025-08-12 | 13F | J.w. Cole Advisors, Inc. | 241,885 | -5.24 | 2,886 | -8.70 | ||||
| 2025-07-11 | 13F/A | Umb Bank N A/mo | 7,395 | 0.00 | 88 | -3.30 | ||||
| 2025-08-08 | 13F | Pnc Financial Services Group, Inc. | 68,018 | 63.92 | 811 | 58.09 | ||||
| 2025-08-13 | 13F | Summit Financial, LLC | 64,131 | 39.22 | 769 | 34.91 | ||||
| 2025-08-08 | 13F | Foundations Investment Advisors, LLC | 12,468 | -0.21 | 149 | -3.90 | ||||
| 2025-07-17 | 13F | MBA Advisors LLC | 27,660 | 0.00 | 330 | -3.80 | ||||
| 2025-08-04 | 13F | Spire Wealth Management | 12,000 | 9.09 | 143 | 5.15 | ||||
| 2025-04-16 | 13F | Fortitude Family Office, LLC | 0 | -100.00 | 0 | |||||
| 2025-08-14 | 13F | Financial Engines Advisors L.L.C. | 11,196 | 0.00 | 134 | -3.60 | ||||
| 2025-08-28 | NP | RiverNorth Flexible Municipal Income Fund, Inc. | 212,902 | -3.34 | 2,540 | -6.86 | ||||
| 2025-04-15 | 13F | Fifth Third Bancorp | 0 | -100.00 | 0 | |||||
| 2025-05-29 | NP | RYDEX VARIABLE TRUST - Multi-Hedge Strategies Fund Variable Annuity | 68 | -88.40 | 1 | -100.00 | ||||
| 2025-07-17 | 13F | XML Financial, LLC | 17,000 | 25.93 | 203 | 20.96 | ||||
| 2025-09-04 | 13F/A | Advisor Group Holdings, Inc. | 379,088 | -42.63 | 4,523 | -44.72 | ||||
| 2025-05-09 | 13F | Pathway Financial Advisers, LLC | 0 | -100.00 | 0 | |||||
| 2025-07-28 | 13F | Allianz Asset Management GmbH | 470,900 | 0.00 | 5,618 | -3.64 | ||||
| 2025-08-28 | NP | RiverNorth Managed Duration Municipal Income Fund, Inc. | 718,510 | -3.61 | 8,572 | -7.11 | ||||
| 2025-07-25 | 13F | Concurrent Investment Advisors, LLC | 23,120 | 20.77 | 276 | 16.03 | ||||
| 2025-08-13 | 13F | Northern Trust Corp | 0 | -100.00 | 0 | |||||
| 2025-05-12 | 13F | Virtu Financial LLC | 0 | -100.00 | 0 | |||||
| 2025-05-08 | 13F | Menard Financial Group LLC | 0 | -100.00 | 0 | |||||
| 2025-08-05 | 13F | Palogic Value Management, L.P. | 224,241 | 4.81 | 2,675 | 1.02 | ||||
| 2025-04-28 | 13F | Pinnacle Financial Partners Inc | 2,510 | 0.00 | 31 | -9.09 | ||||
| 2025-07-09 | 13F | Heritage Wealth Architects, Inc. | 12,723 | 152 | ||||||
| 2025-07-28 | 13F | RFG Advisory, LLC | 51,133 | 5.89 | 610 | 2.18 | ||||
| 2025-07-22 | 13F | Coastal Investment Advisors, Inc. | 15,554 | 186 | ||||||
| 2025-07-31 | 13F | Brinker Capital Investments, LLC | 0 | -100.00 | 0 | -100.00 | ||||
| 2025-08-01 | 13F | Chilton Capital Management Llc | 768 | 0.00 | 9 | 0.00 | ||||
| 2025-05-12 | 13F | Independent Advisor Alliance | 0 | -100.00 | 0 | |||||
| 2025-07-14 | 13F | Chapin Davis, Inc. | 17,341 | 2.97 | 207 | -0.96 | ||||
| 2025-08-14 | 13F | Mml Investors Services, Llc | 23,711 | 0.58 | 0 | |||||
| 2025-07-29 | 13F | Stratos Wealth Advisors, LLC | 59,520 | 0.00 | 710 | -3.53 | ||||
| 2025-08-14 | 13F | Ieq Capital, Llc | 14,462 | 0.00 | 173 | -3.91 | ||||
| 2025-08-15 | 13F | CI Private Wealth, LLC | 32,723 | 390 | ||||||
| 2025-08-28 | NP | RNDLX - RiverNorth/DoubleLine Strategic Income Fund Class R | 1,044,090 | -11.51 | 12,456 | -14.73 | ||||
| 2025-07-09 | 13F | Bank of New Hampshire | 5,345 | 0.00 | 64 | -4.55 | ||||
| 2025-08-11 | 13F | NewEdge Wealth, LLC | 0 | -100.00 | 0 | |||||
| 2025-07-17 | 13F | Walker Asset Management, LLC | 27,225 | 0.00 | 325 | -3.86 | ||||
| 2025-06-24 | NP | MainStay MacKay Municipal Income Opportunities Fund | 76,249 | -0.48 | 909 | -6.00 | ||||
| 2025-04-29 | 13F | Financial Network Wealth Management LLC | 6,338 | 0 | ||||||
| 2025-08-14 | 13F | LaSalle St. Investment Advisors, LLC | 0 | -100.00 | 0 | |||||
| 2025-05-12 | 13F | Richard W. Paul & Associates, LLC | 0 | -100.00 | 0 | |||||
| 2025-08-12 | 13F | Bokf, Na | 0 | -100.00 | 0 | |||||
| 2025-08-13 | 13F | Guggenheim Capital Llc | 1,469,883 | 7.26 | 17,536 | 3.36 | ||||
| 2025-05-29 | 13F/A | Modern Wealth Management, LLC | 0 | -100.00 | 0 | -100.00 | ||||
| 2025-08-11 | 13F | Synergy Investment Management, LLC | 0 | -100.00 | 0 | |||||
| 2025-07-21 | 13F | Catalina Capital Group, LLC | 18,290 | 0.00 | 218 | -3.54 | ||||
| 2025-07-22 | 13F | Mascoma Wealth Management LLC | 799 | 0.00 | 10 | 0.00 | ||||
| 2025-08-12 | 13F | Jpmorgan Chase & Co | 317 | 52.40 | 4 | 50.00 | ||||
| 2025-07-11 | 13F | Farther Finance Advisors, LLC | 16,783 | 1,132.23 | 200 | 1,150.00 | ||||
| 2025-08-04 | 13F | Creekmur Asset Management LLC | 1 | 0.00 | 0 | |||||
| 2025-08-13 | 13F | McGowan Group Asset Management, Inc. | 407,364 | 4.18 | 4,860 | 0.37 | ||||
| 2025-04-21 | 13F | Nelson, Van Denburg & Campbell Wealth Management Group, LLC | 0 | -100.00 | 0 | |||||
| 2025-08-14 | 13F | Colony Group, LLC | 70,624 | -0.93 | 843 | -4.54 | ||||
| 2025-05-02 | 13F | Larson Financial Group LLC | 0 | -100.00 | 0 | -100.00 | ||||
| 2025-08-14 | 13F | Hirtle Callaghan & Co LLC | 402 | -3.60 | ||||||
| 2025-07-22 | 13F | Belpointe Asset Management LLC | 12,678 | 0.00 | 151 | -3.21 | ||||
| 2025-08-14 | 13F | Rivernorth Capital Management, Llc | 3,635,978 | -16.31 | 43,377 | -19.35 | ||||
| 2025-08-13 | 13F | Smith, Moore & Co. | 103,750 | 7.59 | 1,238 | 3.69 | ||||
| 2025-05-16 | 13F | Jones Financial Companies Lllp | 0 | -100.00 | 0 | |||||
| 2025-04-16 | 13F | Matauro, Llc | 0 | -100.00 | 0 | |||||
| 2025-07-17 | 13F | Lee Johnson Capital Management, Llc | 13,772 | 1.96 | 164 | -1.80 | ||||
| 2025-09-04 | 13F | SevenBridge Financial Group, LLC | 10,709 | 0.00 | 127 | -1.56 | ||||
| 2025-07-23 | 13F | Ameliora Wealth Management Ltd. | 100 | 0.00 | 1 | 0.00 | ||||
| 2025-07-22 | 13F | Wealthcare Advisory Partners LLC | 34,336 | 0.64 | 410 | -3.08 | ||||
| 2025-08-14 | 13F | Stifel Financial Corp | 433,333 | 0.87 | 5,170 | -2.80 | ||||
| 2025-08-07 | 13F/A | Tortoise Investment Management, LLC | 0 | -100.00 | 0 | -100.00 | ||||
| 2025-08-14 | 13F | Citadel Advisors Llc | 11,559 | 138 | ||||||
| 2025-06-25 | NP | XMPT - VanEck Vectors CEF Municipal Income ETF | 1,049,753 | -0.70 | 12,513 | -6.13 | ||||
| 2025-07-23 | 13F | Citizens National Bank Trust Department | 3,000 | 0.00 | 36 | -5.41 | ||||
| 2025-08-05 | 13F | Rareview Capital LLC | 105,783 | -48.17 | 1,262 | -50.08 | ||||
| 2025-08-05 | 13F | Mountain Hill Investment Partners Corp. | 11,503 | 0.00 | 137 | -3.52 | ||||
| 2025-08-11 | 13F | Delta Asset Management Llc/tn | 0 | -100.00 | 0 | |||||
| 2025-08-11 | 13F | Aptus Capital Advisors, LLC | 19,781 | 0.00 | 236 | -3.69 | ||||
| 2025-08-25 | NP | QWVQX - Clearwater Tax-Exempt Bond Fund | 117,942 | 0.00 | 1,407 | -3.63 | ||||
| 2025-07-30 | 13F | FNY Investment Advisers, LLC | 3,800 | 0.00 | 0 | |||||
| 2025-08-05 | 13F | Mathes Company, Inc. | 55,000 | -4.35 | 1 | |||||
| 2025-08-12 | 13F | Horizon Kinetics Asset Management Llc | 26,276 | 0.00 | 313 | -3.69 |