Mga Batayang Estadistika
| Pemilik Institusional | 96 total, 96 long only, 0 short only, 0 long/short - change of 0.00% MRQ |
| Alokasi Portofolio Rata-rata | 0.1495 % - change of 14.53% MRQ |
| Saham Institusional (Jangka Panjang) | 3,082,722 (ex 13D/G) - change of -0.60MM shares -16.27% MRQ |
| Nilai Institusional (Jangka Panjang) | $ 171,953 USD ($1000) |
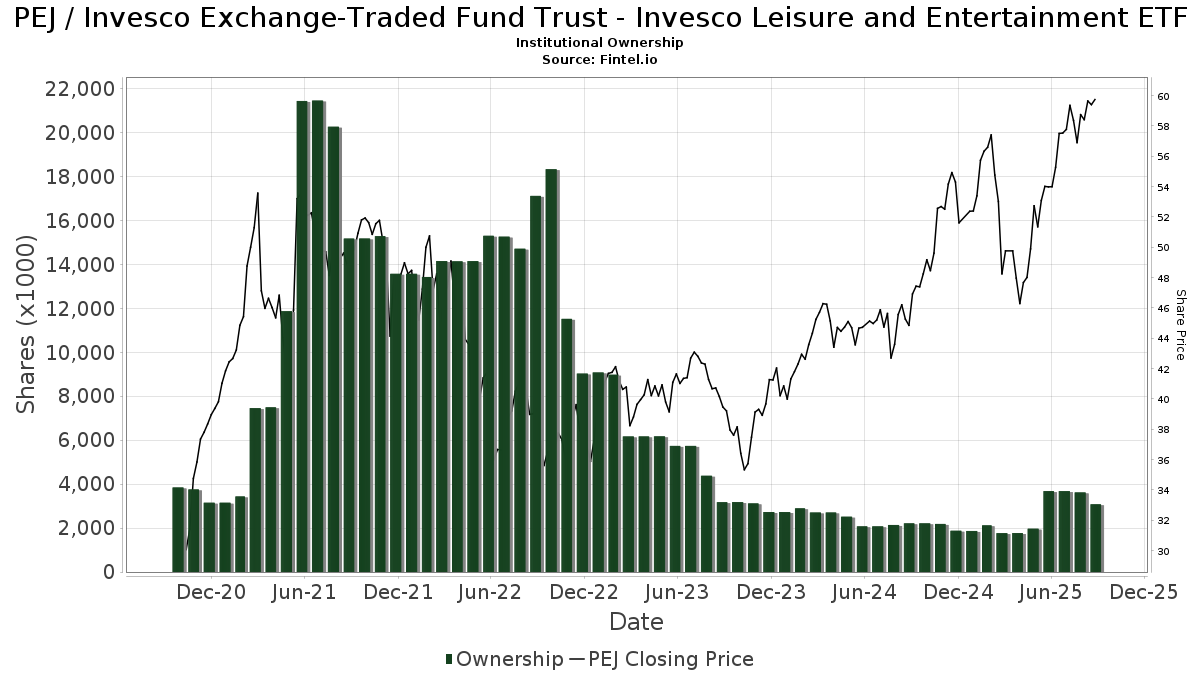
Kepemilikan Institusional dan Pemegang Saham
Invesco Exchange-Traded Fund Trust - Invesco Leisure and Entertainment ETF (US:PEJ) memiliki 96 pemilik institusional dan pemegang saham yang telah mengajukan formulir 13D/G atau 13F kepada Komisi Bursa Efek (Securities Exchange Commission/SEC). Lembaga-lembaga ini memegang total 3,082,722 saham. Pemegang saham terbesar meliputi HighTower Advisors, LLC, Morgan Stanley, Prudential Plc, Bank Of America Corp /de/, Raymond James Financial Inc, Kingsview Wealth Management, LLC, Wells Fargo & Company/mn, MSSS - Monarch Select Subsector Index ETF, LPL Financial LLC, and Goldman Sachs Group Inc .
Struktur kepemilikan institusional Invesco Exchange-Traded Fund Trust - Invesco Leisure and Entertainment ETF (ARCA:PEJ) menunjukkan posisi terkini di perusahaan oleh institusi dan dana, serta perubahan terbaru dalam ukuran posisi. Pemegang saham utama dapat mencakup investor individu, reksa dana, dana lindung nilai, atau institusi. Jadwal 13D menunjukkan bahwa investor memegang (atau pernah memegang) lebih dari 5% saham perusahaan dan bermaksud (atau pernah bermaksud) untuk secara aktif mengejar perubahan strategi bisnis. Jadwal 13G menunjukkan investasi pasif lebih dari 5%.
The share price as of September 5, 2025 is 59.49 / share. Previously, on September 9, 2024, the share price was 44.98 / share. This represents an increase of 32.26% over that period.
Skor Sentimen Dana
Skor Sentimen Dana (sebelumnya dikenal sebagai Skor Akumulasi Kepemilikan) menemukan saham-saham yang paling banyak dibeli oleh dana. Ini adalah hasil dari model kuantitatif multi-faktor yang canggih yang mengidentifikasi perusahaan dengan tingkat akumulasi institusional tertinggi. Model penilaian menggunakan kombinasi dari total peningkatan pemilik yang diungkapkan, perubahan dalam alokasi portofolio pada pemilik tersebut, dan metrik lainnya. Angka berkisar dari 0 hingga 100, dengan angka yang lebih tinggi menunjukkan tingkat akumulasi yang lebih tinggi dibandingkan dengan perusahaan sejenisnya, dan 50 adalah rata-ratanya.
Frekuensi Pembaruan: Setiap Hari
Lihat Ownership Explorer, yang menyediakan daftar perusahaan dengan peringkat tertinggi.
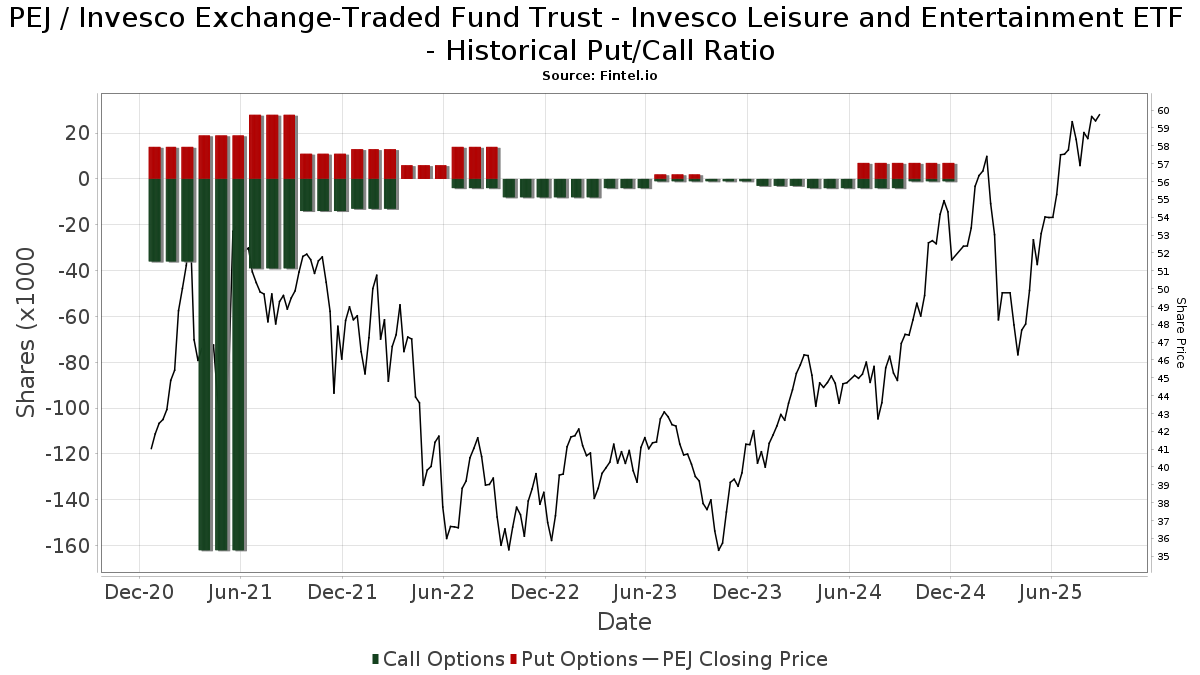
Rasio Put/Call Institusional
Selain melaporkan isu ekuitas dan utang standar, institusi dengan aset di bawah manajemen lebih dari 100 juta dolar AS juga harus mengungkapkan kepemilikan opsi put dan call mereka. Karena opsi put umumnya menunjukkan sentimen negatif, dan opsi call menunjukkan sentimen positif, kita dapat mengetahui sentimen institusional secara keseluruhan dengan memplot rasio put terhadap call. Grafik di sebelah kanan memplot rasio put/call historis untuk instrumen ini.
Menggunakan Rasio Put/Call sebagai indikator sentimen investor mengatasi salah satu kekurangan utama dari penggunaan total kepemilikan institusional, yaitu sejumlah besar aset yang dikelola diinvestasikan secara pasif untuk melacak indeks. Dana yang dikelola secara pasif biasanya tidak membeli opsi, sehingga indikator rasio put/call lebih akurat dalam melacak sentimen dana yang dikelola secara aktif.
Pengajuan 13F dan NPORT
Detail pada pengajuan 13F tersedia gratis. Detail pada pengajuan NP memerlukan keanggotaan premium. Baris berwarna hijau menunjukkan posisi baru. Baris berwarna merah menunjukkan posisi yang sudah ditutup. Klik tautan ini ikon untuk melihat riwayat transaksi selengkapnya.
Tingkatkan
untuk membuka data premium dan mengekspor ke Excel ![]() .
.
| Tanggal File | Sumber | Investor | Ketik | Presyo ng Avg (Silangan) |
Saham | Δ Saham (%) |
Dilaporkan Nilai ($1000) |
Nilai Δ (%) |
Alokasi Port (%) |
|
|---|---|---|---|---|---|---|---|---|---|---|
| 2025-08-08 | 13F | Cetera Investment Advisers | 7,622 | -12.09 | 434 | 2.85 | ||||
| 2025-08-14 | 13F | Bnp Paribas Arbitrage, Sa | 30,393 | -66.38 | 1,729 | -60.68 | ||||
| 2025-05-06 | 13F | Venturi Wealth Management, LLC | 0 | -100.00 | 0 | -100.00 | ||||
| 2025-08-01 | 13F | Bessemer Group Inc | 0 | -100.00 | 0 | |||||
| 2025-08-13 | 13F | Walleye Capital LLC | 3,519 | 200 | ||||||
| 2025-07-15 | 13F | Main Street Group, LTD | 3 | 0.00 | 0 | |||||
| 2025-08-14 | 13F | Bank Of America Corp /de/ | 200,410 | -28.31 | 11,403 | -16.15 | ||||
| 2025-08-14 | 13F | Federation des caisses Desjardins du Quebec | 1,000 | 0.00 | 57 | 16.67 | ||||
| 2025-05-06 | 13F | Advisors Preferred, LLC | 0 | -100.00 | 0 | |||||
| 2025-07-22 | 13F | Wealthcare Advisory Partners LLC | 5,111 | -3.13 | 291 | 13.28 | ||||
| 2025-08-14 | 13F | Wells Fargo & Company/mn | 175,833 | 8.69 | 10,005 | 27.12 | ||||
| 2025-05-05 | 13F | Diversify Advisory Services, LLC | 0 | -100.00 | 0 | -100.00 | ||||
| 2025-07-17 | 13F | Bluesphere Advisors, LLC | 0 | -100.00 | 0 | |||||
| 2025-08-05 | 13F | Harel Insurance Investments & Financial Services Ltd. | 1 | 0.00 | 0 | |||||
| 2025-08-14 | 13F | Comerica Bank | 1,100 | 0.00 | 63 | 16.98 | ||||
| 2025-08-04 | 13F | Flagship Harbor Advisors, Llc | 7,531 | -7.09 | 429 | 8.63 | ||||
| 2025-08-14 | 13F | Abound Financial, Llc | 0 | -100.00 | 0 | |||||
| 2025-08-11 | 13F | Annis Gardner Whiting Capital Advisors, LLC | 264 | 0.00 | 15 | 25.00 | ||||
| 2025-07-16 | 13F | ORG Partners LLC | 434 | 0.00 | 25 | 14.29 | ||||
| 2025-08-14 | 13F | Susquehanna International Group, Llp | 3,817 | -85.88 | 217 | -83.50 | ||||
| 2025-08-15 | 13F | Morgan Stanley | 479,301 | 4.28 | 27,272 | 21.97 | ||||
| 2025-08-11 | 13F | HighTower Advisors, LLC | 573,381 | 0.66 | 32,625 | 17.72 | ||||
| 2025-05-13 | 13F | Lighthouse Financial LLC | 0 | -100.00 | 0 | |||||
| 2025-05-12 | 13F | Financial Services Advisory Inc | 0 | -100.00 | 0 | |||||
| 2025-07-29 | 13F | Tradewinds Capital Management, LLC | 0 | -100.00 | 0 | |||||
| 2025-08-12 | 13F | Quadcap Wealth Management, LLC | 4,062 | -15.50 | 231 | -0.86 | ||||
| 2025-05-01 | 13F | Asset Dedication, LLC | 0 | -100.00 | 0 | |||||
| 2025-05-15 | 13F | Citadel Advisors Llc | Put | 0 | -100.00 | 0 | ||||
| 2025-05-15 | 13F | Citadel Advisors Llc | Call | 0 | -100.00 | 0 | ||||
| 2025-08-12 | 13F | Steward Partners Investment Advisory, Llc | 1,830 | 2.81 | 104 | 20.93 | ||||
| 2025-07-29 | NP | MSSS - Monarch Select Subsector Index ETF | 169,381 | -12.65 | 9,030 | -14.80 | ||||
| 2025-08-14 | 13F | Goldman Sachs Group Inc | 67,168 | -63.83 | 3,822 | -57.70 | ||||
| 2025-08-13 | 13F/A | StoneX Group Inc. | 0 | -100.00 | 0 | -100.00 | ||||
| 2025-08-05 | 13F | Smith Shellnut Wilson Llc /adv | 3,639 | 207 | ||||||
| 2025-05-15 | 13F | Citadel Advisors Llc | 0 | -100.00 | 0 | |||||
| 2025-07-25 | 13F | Cwm, Llc | 2,986 | -0.60 | 0 | |||||
| 2025-08-26 | NP | LCR - Leuthold Core ETF | 7,292 | 415 | ||||||
| 2025-07-24 | 13F | Thompson Investment Management, Inc. | 4 | 0.00 | 0 | |||||
| 2025-07-31 | 13F | CNB Bank | 415 | 0.00 | 24 | 15.00 | ||||
| 2025-08-11 | 13F | Private Advisor Group, LLC | 9,172 | -3.27 | 522 | 13.02 | ||||
| 2025-08-15 | 13F | Kestra Advisory Services, LLC | 14,095 | 58.55 | 802 | 85.65 | ||||
| 2025-08-12 | 13F | LPL Financial LLC | 153,328 | -23.37 | 8,724 | -10.38 | ||||
| 2025-05-16 | 13F/A | Kestra Investment Management, LLC | 0 | -100.00 | 0 | |||||
| 2025-05-14 | 13F | Van Hulzen Asset Management, LLC | 0 | -100.00 | 0 | |||||
| 2025-07-11 | 13F | Farther Finance Advisors, LLC | 238 | 0.00 | 14 | 18.18 | ||||
| 2025-07-30 | 13F | Whittier Trust Co | 23 | 0.00 | 1 | 0.00 | ||||
| 2025-07-31 | 13F | Cambridge Investment Research Advisors, Inc. | 17,513 | -14.51 | 1 | |||||
| 2025-08-01 | 13F | Envestnet Asset Management Inc | 23,735 | 108.60 | 1,351 | 144.12 | ||||
| 2025-08-12 | 13F | Howe & Rusling Inc | 111 | 6 | ||||||
| 2025-05-09 | 13F | Belvedere Trading LLC | Put | 0 | -100.00 | 0 | -100.00 | |||
| 2025-08-12 | 13F | Ameritas Investment Partners, Inc. | 280 | 0.00 | 16 | 15.38 | ||||
| 2025-07-24 | 13F | IFP Advisors, Inc | 1,687 | 0.00 | 96 | 15.85 | ||||
| 2025-08-04 | 13F | HBK Sorce Advisory LLC | 0 | -100.00 | 0 | |||||
| 2025-08-11 | 13F | Principal Securities, Inc. | 120 | -86.00 | 7 | -86.36 | ||||
| 2025-07-21 | 13F | Ameritas Advisory Services, LLC | 1,265 | 72 | ||||||
| 2025-08-12 | 13F | Global Retirement Partners, LLC | 321 | 0.00 | 18 | 12.50 | ||||
| 2025-08-14 | 13F | Quantinno Capital Management LP | 6,417 | -2.82 | 365 | 13.71 | ||||
| 2025-08-13 | 13F | Gateway Wealth Partners, LLC | 5,016 | -10.25 | 285 | 5.17 | ||||
| 2025-08-06 | 13F | Commonwealth Equity Services, Llc | 21,610 | -6.77 | 1 | 0.00 | ||||
| 2025-08-11 | 13F | Wealthspire Advisors, LLC | 5,618 | 0.00 | 320 | 16.85 | ||||
| 2025-08-13 | 13F | Northwestern Mutual Wealth Management Co | 10,672 | 0.00 | 607 | 16.96 | ||||
| 2025-05-06 | 13F | AE Wealth Management LLC | 0 | -100.00 | 0 | -100.00 | ||||
| 2025-08-05 | 13F | Wellington Shields & Co., LLC | 5,610 | 319 | ||||||
| 2025-08-08 | 13F | New England Capital Financial Advisors LLC | 94 | 0.00 | 5 | 25.00 | ||||
| 2025-08-06 | 13F | Prospera Financial Services Inc | 6,666 | -7.57 | 379 | 8.29 | ||||
| 2025-08-14 | 13F | MGB Wealth Management, LLC | 750 | 0.00 | 43 | 16.67 | ||||
| 2025-07-25 | 13F | Hazlett, Burt & Watson, Inc. | 2,640 | 0.00 | 0 | |||||
| 2025-08-08 | 13F | Pnc Financial Services Group, Inc. | 650 | -7.14 | 37 | 5.88 | ||||
| 2025-08-12 | 13F | Stelac Advisory Services LLC | 1,880 | 107 | ||||||
| 2025-08-14 | 13F | First International Bank of Israel Ltd. | 3,712 | 211 | ||||||
| 2025-08-14 | 13F | Royal Bank Of Canada | 21,016 | -74.09 | 1,195 | -69.72 | ||||
| 2025-07-08 | 13F | Parallel Advisors, LLC | 54 | 3 | ||||||
| 2025-09-04 | 13F/A | Advisor Group Holdings, Inc. | 41,931 | 3.28 | 2,383 | 20.61 | ||||
| 2025-05-14 | 13F | Jane Street Group, Llc | 0 | -100.00 | 0 | |||||
| 2025-07-16 | 13F | Minichmacgregor Wealth Management, Llc | 7,065 | -1.30 | 402 | 15.23 | ||||
| 2025-08-08 | 13F | Larson Financial Group LLC | 0 | -100.00 | 0 | |||||
| 2025-08-12 | 13F | Prudential Plc | 202,100 | 14.50 | 11,499 | 33.93 | ||||
| 2025-08-13 | 13F | Amundi | 0 | -100.00 | 0 | |||||
| 2025-07-21 | 13F | Mirae Asset Global Investments Co., Ltd. | 1,600 | 91 | ||||||
| 2025-08-14 | 13F/A | Barclays Plc | 2,160 | 0.00 | 0 | |||||
| 2025-08-05 | 13F | Simplex Trading, Llc | 0 | -100.00 | 0 | |||||
| 2025-08-12 | 13F | Founders Financial Alliance, LLC | 400 | 0.00 | 23 | 15.79 | ||||
| 2025-08-14 | 13F | GWM Advisors LLC | 780 | 0.00 | 44 | 18.92 | ||||
| 2025-05-15 | 13F | Millennium Management Llc | 0 | -100.00 | 0 | -100.00 | ||||
| 2025-07-15 | 13F | Kwmg, Llc | 37,841 | -1.18 | 2,153 | 15.63 | ||||
| 2025-07-31 | 13F | Guardian Asset Advisors, LLC | 4,492 | -2.73 | 255 | 13.84 | ||||
| 2025-08-13 | 13F | Custom Index Systems, Llc | 4,897 | 5.04 | 279 | 23.01 | ||||
| 2025-08-14 | 13F | Ameriprise Financial Inc | 17,410 | 18.92 | 991 | 39.04 | ||||
| 2025-07-14 | 13F | UMA Financial Services, Inc. | 1,966 | 0.00 | 112 | 16.84 | ||||
| 2025-07-29 | 13F | Private Trust Co Na | 55 | 0.00 | 3 | 50.00 | ||||
| 2025-05-19 | 13F | Heck Capital Advisors, LLC | 0 | 0 | ||||||
| 2025-08-13 | 13F | Navis Wealth Advisors, LLC | 7,627 | 0.00 | 434 | 16.71 | ||||
| 2025-04-21 | 13F | Nelson, Van Denburg & Campbell Wealth Management Group, LLC | 0 | -100.00 | 0 | |||||
| 2025-05-15 | 13F | Creative Planning | 0 | -100.00 | 0 | |||||
| 2025-08-13 | 13F | Summit Financial, LLC | 0 | -100.00 | 0 | |||||
| 2025-08-19 | 13F | Anchor Investment Management, LLC | 158 | 0.00 | 9 | 14.29 | ||||
| 2025-08-13 | 13F | Thomist Capital Management, LP | 24,600 | 1,396 | ||||||
| 2025-07-17 | 13F | Beacon Capital Management, LLC | 50 | 0.00 | 3 | 0.00 | ||||
| 2025-07-22 | 13F | Iron Horse Wealth Management, LLC | 0 | -100.00 | 0 | -100.00 | ||||
| 2025-08-13 | 13F | Leuthold Group, Llc | 7,846 | 446 | ||||||
| 2025-07-23 | 13F | Ironwood Financial, llc | 15,131 | 0.00 | 736 | 0.00 | ||||
| 2025-08-14 | 13F | Fmr Llc | 6,584 | 117.51 | 375 | 154.42 | ||||
| 2025-08-12 | 13F | Heritage Trust Co | 5,045 | 0.00 | 287 | 17.14 | ||||
| 2025-08-12 | 13F | Jpmorgan Chase & Co | 30,000 | -88.46 | 1,707 | -86.50 | ||||
| 2025-08-14 | 13F | UBS Group AG | 66,930 | -8.83 | 3,808 | 6.64 | ||||
| 2025-08-14 | 13F | CoreCap Advisors, LLC | 17 | 0.00 | 1 | |||||
| 2025-05-16 | 13F | Coppell Advisory Solutions LLC | 0 | -100.00 | 0 | -100.00 | ||||
| 2025-07-29 | 13F | Harbor Asset Planning, Inc. | 3 | 0 | ||||||
| 2025-08-12 | 13F | Proequities, Inc. | 0 | 0 | ||||||
| 2025-08-11 | 13F | Nations Financial Group Inc, /ia/ /adv | 4,133 | -2.39 | 235 | 14.63 | ||||
| 2025-08-14 | 13F | Boston Private Wealth Llc | 0 | -100.00 | 0 | |||||
| 2025-08-11 | 13F | Citigroup Inc | 2,429 | 138 | ||||||
| 2025-08-18 | 13F/A | National Bank Of Canada /fi/ | 2,268 | 0.00 | 129 | 17.27 | ||||
| 2025-07-31 | 13F | Nilsine Partners, LLC | 26,660 | 0.27 | 1,517 | 17.25 | ||||
| 2025-05-15 | 13F | Glenmede Trust Co Na | 18 | -92.59 | 1 | -100.00 | ||||
| 2025-07-28 | 13F | Harbour Investments, Inc. | 1,178 | -33.75 | 67 | -22.09 | ||||
| 2025-08-15 | 13F | Tower Research Capital LLC (TRC) | 0 | -100.00 | 0 | |||||
| 2025-07-07 | 13F | Thurston, Springer, Miller, Herd & Titak, Inc. | 416 | 0.00 | 24 | 15.00 | ||||
| 2025-08-08 | 13F | Kingsview Wealth Management, LLC | 182,877 | -19.14 | 10,406 | -5.43 | ||||
| 2025-08-14 | 13F | Integrated Wealth Concepts LLC | 29,891 | -4.40 | 1,701 | 11.77 | ||||
| 2025-05-02 | 13F | Wealthfront Advisers Llc | 0 | -100.00 | 0 | -100.00 | ||||
| 2025-08-06 | 13F | Golden State Wealth Management, LLC | 500 | 0.00 | 28 | 16.67 | ||||
| 2025-07-24 | 13F | Bernard Wealth Management Corp. | 750 | 0.00 | 43 | 16.67 | ||||
| 2025-08-13 | 13F | Jones Financial Companies Lllp | 6,310 | 26.78 | 358 | 47.93 | ||||
| 2025-07-17 | 13F | Western Financial Corp/CA | 6,018 | -17.05 | 342 | -2.84 | ||||
| 2025-08-06 | 13F | Black Swift Group, LLC | 55,120 | 3,136 | ||||||
| 2025-08-05 | 13F | Bank Of Montreal /can/ | 150 | 0.00 | 9 | 14.29 | ||||
| 2025-08-14 | 13F | Raymond James Financial Inc | 197,308 | -6.87 | 11,227 | 8.92 | ||||
| 2025-08-07 | 13F | Hennion & Walsh Asset Management, Inc. | 8,945 | 0.00 | 509 | 16.78 | ||||
| 2025-08-14 | 13F | Stifel Financial Corp | 10,273 | -6.84 | 585 | 8.96 | ||||
| 2025-08-13 | 13F | VestGen Advisors, LLC | 0 | -100.00 | 0 | |||||
| 2025-04-10 | 13F | EWG Elevate Inc. | 0 | -100.00 | 0 | |||||
| 2025-08-05 | 13F | Huntington National Bank | 8 | 14.29 |