Mga Batayang Estadistika
| Pemilik Institusional | 124 total, 121 long only, 1 short only, 2 long/short - change of -3.88% MRQ |
| Alokasi Portofolio Rata-rata | 0.1094 % - change of -2.21% MRQ |
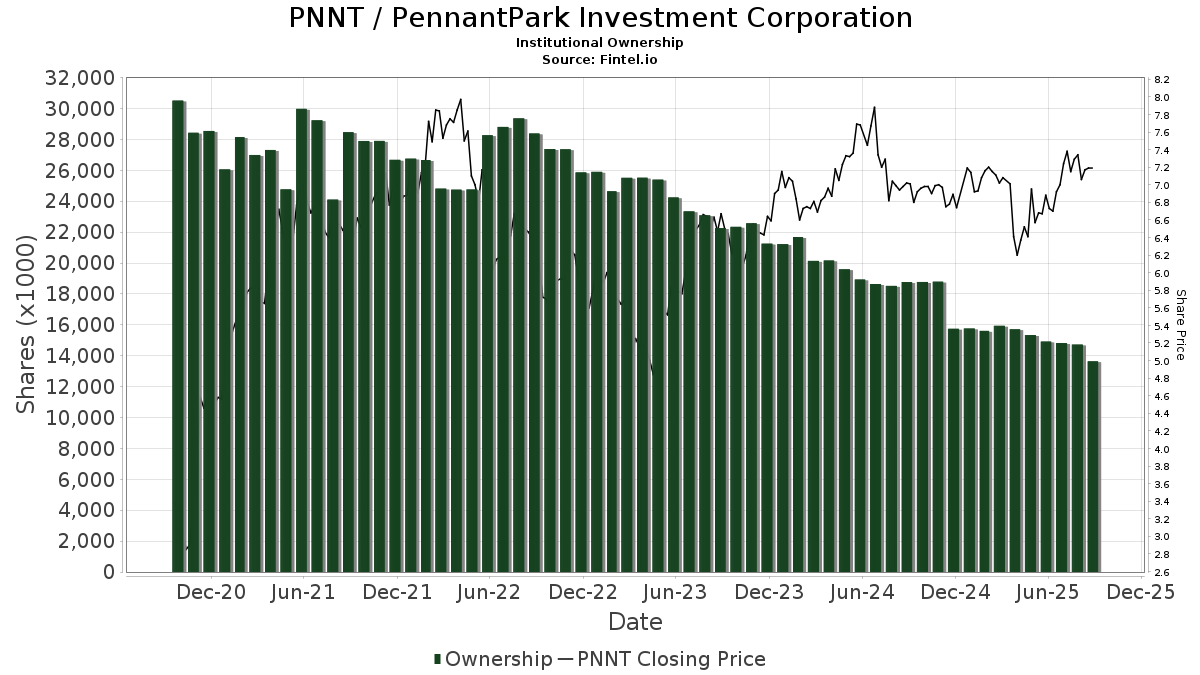
| Saham Institusional (Jangka Panjang) | 13,640,711 (ex 13D/G) - change of -1.28MM shares -8.57% MRQ |
| Nilai Institusional (Jangka Panjang) | $ 77,705 USD ($1000) |
Kepemilikan Institusional dan Pemegang Saham
PennantPark Investment Corporation (US:PNNT) memiliki 124 pemilik institusional dan pemegang saham yang telah mengajukan formulir 13D/G atau 13F kepada Komisi Bursa Efek (Securities Exchange Commission/SEC). Lembaga-lembaga ini memegang total 13,640,711 saham. Pemegang saham terbesar meliputi KBWD - Invesco KBW High Dividend Yield Financial ETF, Invesco Ltd., Lsv Asset Management, Two Sigma Advisers, Lp, Two Sigma Investments, Lp, Truvestments Capital Llc, Advisors Asset Management, Inc., BlackRock, Inc., Morgan Stanley, and Hennion & Walsh Asset Management, Inc. .
Struktur kepemilikan institusional PennantPark Investment Corporation (NYSE:PNNT) menunjukkan posisi terkini di perusahaan oleh institusi dan dana, serta perubahan terbaru dalam ukuran posisi. Pemegang saham utama dapat mencakup investor individu, reksa dana, dana lindung nilai, atau institusi. Jadwal 13D menunjukkan bahwa investor memegang (atau pernah memegang) lebih dari 5% saham perusahaan dan bermaksud (atau pernah bermaksud) untuk secara aktif mengejar perubahan strategi bisnis. Jadwal 13G menunjukkan investasi pasif lebih dari 5%.
The share price as of September 5, 2025 is 7.22 / share. Previously, on September 9, 2024, the share price was 6.99 / share. This represents an increase of 3.29% over that period.
Skor Sentimen Dana
Skor Sentimen Dana (sebelumnya dikenal sebagai Skor Akumulasi Kepemilikan) menemukan saham-saham yang paling banyak dibeli oleh dana. Ini adalah hasil dari model kuantitatif multi-faktor yang canggih yang mengidentifikasi perusahaan dengan tingkat akumulasi institusional tertinggi. Model penilaian menggunakan kombinasi dari total peningkatan pemilik yang diungkapkan, perubahan dalam alokasi portofolio pada pemilik tersebut, dan metrik lainnya. Angka berkisar dari 0 hingga 100, dengan angka yang lebih tinggi menunjukkan tingkat akumulasi yang lebih tinggi dibandingkan dengan perusahaan sejenisnya, dan 50 adalah rata-ratanya.
Frekuensi Pembaruan: Setiap Hari
Lihat Ownership Explorer, yang menyediakan daftar perusahaan dengan peringkat tertinggi.
Rasio Put/Call Institusional
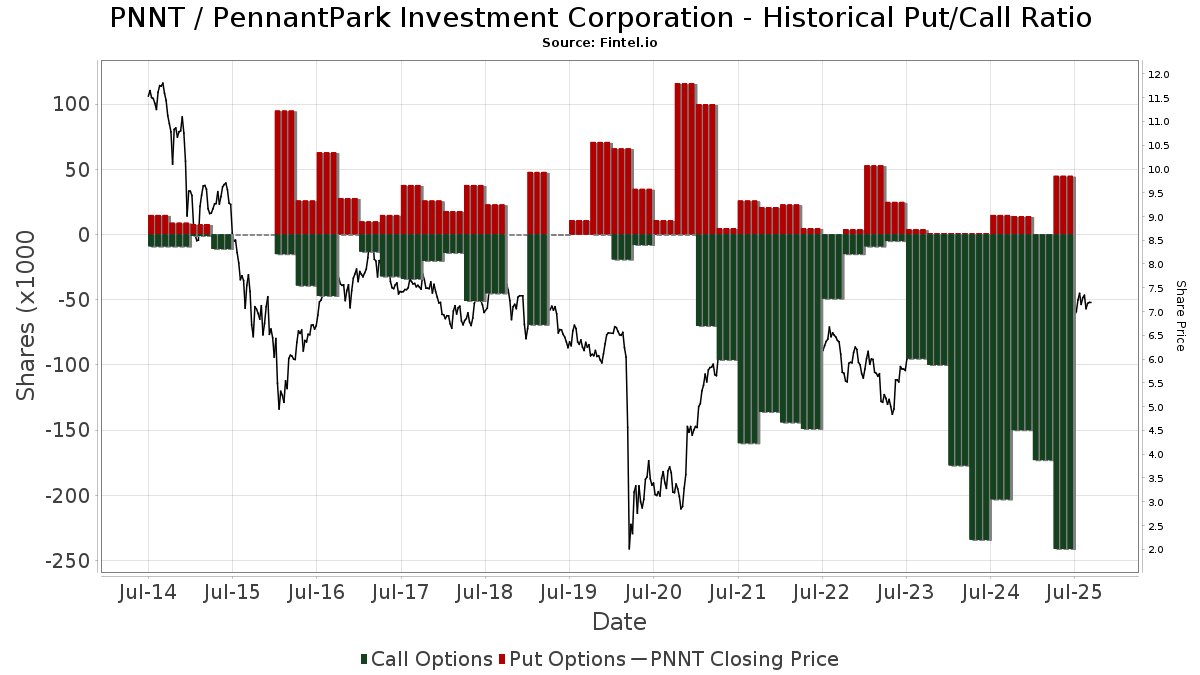
Selain melaporkan isu ekuitas dan utang standar, institusi dengan aset di bawah manajemen lebih dari 100 juta dolar AS juga harus mengungkapkan kepemilikan opsi put dan call mereka. Karena opsi put umumnya menunjukkan sentimen negatif, dan opsi call menunjukkan sentimen positif, kita dapat mengetahui sentimen institusional secara keseluruhan dengan memplot rasio put terhadap call. Grafik di sebelah kanan memplot rasio put/call historis untuk instrumen ini.
Menggunakan Rasio Put/Call sebagai indikator sentimen investor mengatasi salah satu kekurangan utama dari penggunaan total kepemilikan institusional, yaitu sejumlah besar aset yang dikelola diinvestasikan secara pasif untuk melacak indeks. Dana yang dikelola secara pasif biasanya tidak membeli opsi, sehingga indikator rasio put/call lebih akurat dalam melacak sentimen dana yang dikelola secara aktif.
Pengajuan 13F dan NPORT
Detail pada pengajuan 13F tersedia gratis. Detail pada pengajuan NP memerlukan keanggotaan premium. Baris berwarna hijau menunjukkan posisi baru. Baris berwarna merah menunjukkan posisi yang sudah ditutup. Klik tautan ini ikon untuk melihat riwayat transaksi selengkapnya.
Tingkatkan
untuk membuka data premium dan mengekspor ke Excel ![]() .
.
| Tanggal File | Sumber | Investor | Ketik | Presyo ng Avg (Silangan) |
Saham | Δ Saham (%) |
Dilaporkan Nilai ($1000) |
Nilai Δ (%) |
Alokasi Port (%) |
|
|---|---|---|---|---|---|---|---|---|---|---|
| 2025-07-01 | 13F | Confluence Investment Management Llc | 24,623 | -81.11 | 168 | -81.66 | ||||
| 2025-07-21 | 13F | West Financial Advisors, LLC | 350 | 3.55 | 2 | 0.00 | ||||
| 2025-05-05 | 13F | Lindbrook Capital, Llc | 208 | 85.71 | 1 | |||||
| 2025-08-14 | 13F | Sunbelt Securities, Inc. | 17,577 | -75.60 | 124 | -75.49 | ||||
| 2025-08-08 | 13F | Condor Capital Management | 14,151 | -93.14 | 97 | -93.37 | ||||
| 2025-05-14 | 13F | Virtus ETF Advisers LLC | 0 | -100.00 | 0 | |||||
| 2025-08-13 | 13F | PharVision Advisers, LLC | 0 | -100.00 | 0 | |||||
| 2025-05-14 | 13F | Bnp Paribas Arbitrage, Sa | 0 | -100.00 | 0 | |||||
| 2025-08-04 | 13F | Kovack Advisors, Inc. | 67,850 | 2.73 | 464 | 0.00 | ||||
| 2025-07-21 | 13F | Ameritas Advisory Services, LLC | 558 | 4 | ||||||
| 2025-08-05 | 13F | Key FInancial Inc | 375 | 0.00 | 3 | 0.00 | ||||
| 2025-08-12 | 13F | LPL Financial LLC | 51,312 | 190.88 | 351 | 182.26 | ||||
| 2025-07-14 | 13F | Edge Wealth Management LLC | 20,000 | 0.00 | 137 | -2.86 | ||||
| 2025-08-06 | 13F | Commonwealth Equity Services, Llc | 45,062 | -20.29 | 0 | |||||
| 2025-08-08 | 13F | Larson Financial Group LLC | 2,000 | 0.00 | 14 | -7.14 | ||||
| 2025-08-27 | NP | BBVSX - Bridge Builder Small/Mid Cap Value Fund | 163,500 | 0.00 | 1,118 | -2.70 | ||||
| 2025-07-16 | 13F | Essex Financial Services, Inc. | 40,696 | 0.00 | 278 | -2.80 | ||||
| 2025-08-11 | 13F | Pin Oak Investment Advisors Inc | 0 | 0 | ||||||
| 2025-08-13 | 13F | Garner Asset Management Corp | 79,118 | -18.35 | 541 | -20.56 | ||||
| 2025-05-15 | 13F | Citadel Advisors Llc | 0 | -100.00 | 0 | -100.00 | ||||
| 2025-07-31 | 13F | Caitong International Asset Management Co., Ltd | 834 | 456.00 | 6 | 400.00 | ||||
| 2025-04-28 | 13F | Strategic Financial Concepts, LLC | 0 | -100.00 | 0 | -100.00 | ||||
| 2025-08-08 | 13F | Advisors Capital Management, LLC | 83,176 | -15.72 | 569 | -18.04 | ||||
| 2025-07-30 | 13F | Denali Advisors Llc | 106,775 | -1.82 | 730 | -4.45 | ||||
| 2025-08-15 | 13F | Tower Research Capital LLC (TRC) | 0 | -100.00 | 0 | |||||
| 2025-08-07 | 13F | Allworth Financial LP | 9,254 | 7,742.37 | 63 | |||||
| 2025-08-08 | 13F | Creative Planning | 33,369 | 26.37 | 228 | 23.24 | ||||
| 2025-08-12 | 13F | Steward Partners Investment Advisory, Llc | 1,865 | 0.00 | 13 | -7.69 | ||||
| 2025-08-14 | 13F | Citadel Advisors Llc | Put | 0 | -100.00 | 0 | ||||
| 2025-04-17 | 13F | FNY Investment Advisers, LLC | 0 | -100.00 | 0 | |||||
| 2025-04-29 | 13F | Envestnet Asset Management Inc | 0 | -100.00 | 0 | |||||
| 2025-08-11 | 13F | EMC Capital Management | 13,321 | -58.10 | 0 | |||||
| 2025-08-12 | 13F | XTX Topco Ltd | 0 | -100.00 | 0 | |||||
| 2025-08-12 | 13F | Global Retirement Partners, LLC | 7,283 | -72.29 | 50 | -73.66 | ||||
| 2025-04-23 | NP | First Trust Specialty Finance & Financial Opportunities Fund This fund is a listed as child fund of First Trust Advisors Lp and if that institution has disclosed ownership in this security, then these positions will not be double counted when calculating total shares and total value | 106,000 | -58.59 | 771 | -55.57 | ||||
| 2025-04-29 | 13F | Raleigh Capital Management Inc. | 0 | -100.00 | 0 | |||||
| 2025-08-13 | 13F | Virtus Investment Advisers, Inc. | 147,296 | -12.77 | 1,008 | -15.16 | ||||
| 2025-08-14 | 13F | Jane Street Group, Llc | 0 | -100.00 | 0 | -100.00 | ||||
| 2025-08-12 | 13F | BlackRock, Inc. | 500,390 | 21.06 | 3,423 | 17.80 | ||||
| 2025-07-03 | 13F | Garde Capital, Inc. | 1,110 | 0.00 | 8 | 0.00 | ||||
| 2025-07-21 | 13F | Catalina Capital Group, LLC | 0 | -100.00 | 0 | |||||
| 2025-08-11 | 13F | Citigroup Inc | 1,439 | 0.00 | 10 | -10.00 | ||||
| 2025-05-02 | 13F/A | Mackenzie Financial Corp | 0 | -100.00 | 0 | |||||
| 2025-08-14 | 13F | Mariner, LLC | 12,630 | 86 | ||||||
| 2025-08-14 | 13F | Verition Fund Management LLC | 25,775 | 176 | ||||||
| 2025-08-11 | 13F | Hexagon Capital Partners LLC | 0 | -100.00 | 0 | |||||
| 2025-08-13 | 13F | Cresset Asset Management, LLC | 23,002 | 2.22 | 159 | 0.00 | ||||
| 2025-05-05 | 13F | IFP Advisors, Inc | 0 | -100.00 | 0 | |||||
| 2025-07-25 | 13F | Atria Wealth Solutions, Inc. | 0 | -100.00 | 0 | |||||
| 2025-08-04 | 13F | Arkadios Wealth Advisors | 30,061 | 0.00 | 206 | -2.84 | ||||
| 2025-08-13 | 13F | Quadrant Capital Group Llc | 0 | -100.00 | 0 | |||||
| 2025-05-12 | 13F | Virtu Financial LLC | 0 | -100.00 | 0 | |||||
| 2025-08-05 | 13F | Simplex Trading, Llc | Put | 400 | 0.00 | 0 | ||||
| 2025-08-13 | 13F | Northern Trust Corp | 46,204 | 90.85 | 316 | 85.88 | ||||
| 2025-08-05 | 13F | Simplex Trading, Llc | Call | 39,100 | 272.38 | 0 | ||||
| 2025-08-14 | 13F/A | Rockefeller Capital Management L.P. | 195,676 | 0.00 | 1,338 | -2.69 | ||||
| 2025-08-08 | 13F | Pnc Financial Services Group, Inc. | 2,635 | 0.00 | 18 | 0.00 | ||||
| 2025-08-14 | 13F | Brevan Howard Capital Management LP | 39,347 | 269 | ||||||
| 2025-08-14 | 13F | Royal Bank Of Canada | 65,208 | 62.39 | 446 | 58.16 | ||||
| 2025-08-13 | 13F | Baird Financial Group, Inc. | 13,725 | 0.00 | 94 | -3.12 | ||||
| 2025-05-29 | NP | JAFEX - Total Stock Market Index Trust NAV | 25 | -98.48 | 0 | -100.00 | ||||
| 2025-08-13 | 13F | Truvestments Capital Llc | 595,000 | -0.26 | 4,070 | -2.96 | ||||
| 2025-06-27 | NP | LBO - WHITEWOLF Publicly Listed Private Equity ETF | 5,739 | 14.28 | 37 | 5.71 | ||||
| 2025-08-11 | 13F | Principal Securities, Inc. | 500 | 3 | ||||||
| 2025-08-13 | 13F | Quantbot Technologies LP | 19,229 | 132 | ||||||
| 2025-04-18 | 13F | Cornerstone Wealth Management, LLC | 0 | -100.00 | 0 | -100.00 | ||||
| 2025-08-11 | 13F | Lsv Asset Management | 1,782,360 | -3.33 | 12 | 0.00 | ||||
| 2025-08-13 | 13F | Texas Capital Bank Wealth Management Services Inc | 152,033 | 0.00 | 1,040 | -2.72 | ||||
| 2025-08-14 | 13F | Aquatic Capital Management LLC | 24,616 | 168 | ||||||
| 2025-08-06 | 13F | Smh Capital Advisors Inc | 68,210 | 0.00 | 467 | -2.71 | ||||
| 2025-07-28 | 13F | Harbour Investments, Inc. | 160 | 0.00 | 1 | 0.00 | ||||
| 2025-08-08 | 13F | Alberta Investment Management Corp | 0 | -100.00 | 0 | |||||
| 2025-05-14 | 13F | Group One Trading, L.p. | Put | 0 | -100.00 | 0 | -100.00 | |||
| 2025-08-14 | 13F | Raymond James Financial Inc | 90,525 | -0.83 | 619 | -3.43 | ||||
| 2025-07-17 | 13F | Sound Income Strategies, LLC | 2,573 | 0.00 | 18 | -5.56 | ||||
| 2025-07-29 | 13F | International Assets Investment Management, Llc | 31,350 | 0.00 | 214 | -2.73 | ||||
| 2025-08-11 | 13F | NewEdge Wealth, LLC | 255,399 | -9.42 | 1,847 | -6.86 | ||||
| 2025-08-11 | 13F | HighTower Advisors, LLC | 23,373 | -35.55 | 160 | -37.40 | ||||
| 2025-07-16 | 13F | Beaumont Financial Advisors, LLC | 25,343 | 3.61 | 173 | 1.17 | ||||
| 2025-08-26 | 13F/A | Thrivent Financial For Lutherans | 48,285 | 0 | ||||||
| 2025-05-06 | 13F | Cetera Investment Advisers | 0 | -100.00 | 0 | |||||
| 2025-07-17 | 13F | Janney Montgomery Scott LLC | 132,518 | 1.13 | 1 | |||||
| 2025-08-14 | 13F | LaSalle St. Investment Advisors, LLC | 19,559 | -13.16 | 0 | |||||
| 2025-07-14 | 13F | Ridgewood Investments LLC | 1,000 | 0.00 | 7 | -14.29 | ||||
| 2025-08-14 | 13F | Bank Of America Corp /de/ | 93,985 | -4.84 | 643 | -7.49 | ||||
| 2025-08-14 | 13F | Wells Fargo & Company/mn | 47,914 | 28.84 | 328 | 25.29 | ||||
| 2025-07-17 | 13F | Sterneck Capital Management, LLC | 72,894 | 14.09 | 499 | 10.91 | ||||
| 2025-08-14 | 13F | Two Sigma Securities, Llc | 11,427 | 8.74 | 78 | 6.85 | ||||
| 2025-08-12 | 13F | MAI Capital Management | 235 | 2 | ||||||
| 2025-08-14 | 13F | Susquehanna International Group, Llp | 19,148 | -59.51 | 131 | -60.84 | ||||
| 2025-07-29 | NP | SLPAX - Siit Small Cap Fund - Class A | 43,000 | 0.00 | 286 | -8.33 | ||||
| 2025-07-11 | 13F | Farther Finance Advisors, LLC | 325 | 2.52 | 2 | 0.00 | ||||
| 2025-08-14 | 13F | Susquehanna International Group, Llp | Call | 112,100 | -24.00 | 767 | -26.06 | |||
| 2025-08-14 | 13F | Group One Trading, L.p. | Call | 54,200 | 2,752.63 | 371 | 2,746.15 | |||
| 2025-08-14 | 13F | Susquehanna International Group, Llp | Put | 24,400 | 167 | |||||
| 2025-08-05 | 13F | Dunhill Financial, LLC | 7,927 | 54 | ||||||
| 2025-08-12 | 13F | Trexquant Investment LP | 0 | -100.00 | 0 | |||||
| 2025-06-25 | NP | VPC - Virtus Private Credit Strategy ETF | 154,242 | 5.04 | 1,006 | -3.74 | ||||
| 2025-07-16 | 13F | Signaturefd, Llc | 37,539 | 3.10 | 257 | 0.39 | ||||
| 2025-06-26 | NP | LSVQX - LSV Small Cap Value Fund Institutional Class Shares | 195,900 | 0.00 | 1,277 | -8.26 | ||||
| 2025-07-22 | 13F | Grimes & Company, Inc. | 38,788 | -24.87 | 265 | -26.80 | ||||
| 2025-07-29 | 13F | Regions Financial Corp | 20,000 | 0.00 | 137 | -2.86 | ||||
| 2025-08-14 | 13F | Stifel Financial Corp | 18,708 | -16.33 | 128 | -19.11 | ||||
| 2025-08-14 | 13F | Citadel Advisors Llc | Call | 36,300 | 168.89 | 248 | 163.83 | |||
| 2025-07-18 | 13F | Trust Co Of Vermont | 1,050 | 7 | ||||||
| 2025-07-21 | 13F | Ameriflex Group, Inc. | 0 | -100.00 | 0 | |||||
| 2025-08-12 | 13F | CIBC Private Wealth Group, LLC | 6,600 | 0.00 | 45 | 15.38 | ||||
| 2025-08-12 | 13F | Proequities, Inc. | Put | 0 | 0 | |||||
| 2025-08-14 | 13F | Quarry LP | 0 | -100.00 | 0 | |||||
| 2025-05-15 | 13F | Millennium Management Llc | 0 | -100.00 | 0 | -100.00 | ||||
| 2025-07-30 | 13F | Brookstone Capital Management | 10,415 | 3.61 | 71 | 1.43 | ||||
| 2025-08-07 | 13F | Hennion & Walsh Asset Management, Inc. | 462,709 | -25.88 | 3,165 | -27.89 | ||||
| 2025-08-12 | 13F | Proequities, Inc. | Call | 0 | 0 | |||||
| 2025-08-13 | 13F | EverSource Wealth Advisors, LLC | 3,695 | 100.60 | 25 | 108.33 | ||||
| 2025-08-12 | 13F | Proequities, Inc. | 0 | 0 | ||||||
| 2025-08-14 | 13F | Abbot Financial Management, Inc. | 74,511 | 0.01 | 510 | -2.68 | ||||
| 2025-08-14 | 13F | Two Sigma Advisers, Lp | 1,276,218 | -5.02 | 8,729 | -7.59 | ||||
| 2025-08-15 | 13F | Morgan Stanley | 477,967 | -2.51 | 3,269 | -5.14 | ||||
| 2025-07-14 | 13F | Crew Capital Management, Ltd. | 0 | -100.00 | 0 | |||||
| 2025-06-12 | 13F/A | Deutsche Bank Ag\ | 0 | -100.00 | 0 | |||||
| 2025-08-28 | NP | SMVIX - Simt Small Cap Value Fund Class I | 8,318 | -71.58 | 57 | -72.68 | ||||
| 2025-08-14 | 13F | Qube Research & Technologies Ltd | 0 | -100.00 | 0 | |||||
| 2025-08-14 | 13F | BI Asset Management Fondsmaeglerselskab A/S | 89,022 | 0.00 | 1 | |||||
| 2025-05-14 | 13F | Congress Wealth Management LLC / DE / | 0 | -100.00 | 0 | |||||
| 2025-08-12 | 13F | Advisors Asset Management, Inc. | 526,754 | -13.67 | 3,603 | -16.02 | ||||
| 2025-08-14 | 13F | UBS Group AG | 154,394 | 48.08 | 1,056 | 44.26 | ||||
| 2025-08-13 | 13F | Marshall Wace, Llp | 0 | -100.00 | 0 | |||||
| 2025-04-22 | 13F | TrueMark Investments, LLC | 0 | -100.00 | 0 | |||||
| 2025-08-14 | 13F | Evergreen Capital Management Llc | 21,167 | -20.94 | 146 | -23.16 | ||||
| 2025-04-04 | 13F | Webster Bank, N. A. | 0 | -100.00 | 0 | |||||
| 2025-07-24 | 13F | Us Bancorp \de\ | 40 | 0.00 | 0 | |||||
| 2025-07-28 | NP | KBWD - Invesco KBW High Dividend Yield Financial ETF This fund is a listed as child fund of Invesco Ltd. and if that institution has disclosed ownership in this security, then these positions will not be double counted when calculating total shares and total value | 1,836,639 | 0.00 | 12,232 | -8.39 | ||||
| 2025-08-13 | 13F | Lido Advisors, LLC | 246,312 | 0.00 | 1,704 | -2.68 | ||||
| 2025-08-08 | 13F | Cedar Wealth Management, LLC | 3,940 | 0.00 | 27 | -3.70 | ||||
| 2025-08-12 | 13F | Jpmorgan Chase & Co | 200 | -96.64 | 1 | -97.56 | ||||
| 2025-08-12 | 13F | Founders Financial Alliance, LLC | 62,127 | -2.15 | 425 | -4.93 | ||||
| 2025-07-31 | 13F | Cambridge Investment Research Advisors, Inc. | 37,894 | 5.61 | 0 | |||||
| 2025-05-23 | 13F | SWAN Capital LLC | 0 | -100.00 | 0 | |||||
| 2025-09-04 | 13F/A | Advisor Group Holdings, Inc. | 75,046 | -2.31 | 513 | -5.00 | ||||
| 2025-08-13 | 13F | Invesco Ltd. | 1,836,639 | 0.00 | 12,563 | -2.70 | ||||
| 2025-08-05 | 13F | Huntington National Bank | 1 | 0.00 | 0 | |||||
| 2025-05-02 | 13F | Legacy Capital Wealth Partners, LLC | 0 | -100.00 | 0 | |||||
| 2025-08-01 | 13F | Rossby Financial, LCC | 1,500 | 0.00 | 10 | 11.11 | ||||
| 2025-08-28 | NP | TRIFX - Catalyst/SMH Total Return Income Fund Class A | 68,210 | 0.00 | 467 | -2.71 | ||||
| 2025-08-04 | 13F | Roble, Belko & Company, Inc | 124 | 3.33 | 0 | |||||
| 2025-08-14 | 13F | Hrt Financial Lp | 21,250 | 0 | ||||||
| 2025-08-04 | 13F | Spire Wealth Management | 1,134 | 8 | ||||||
| 2025-08-14 | 13F | Jane Street Group, Llc | Put | 20,300 | 139 | |||||
| 2025-08-12 | 13F | Close Asset Management Ltd | 23,800 | -38.66 | 0 | |||||
| 2025-08-12 | 13F | Legal & General Group Plc | 430,816 | -1.53 | 2,942 | -4.26 | ||||
| 2025-08-06 | 13F | First Horizon Advisors, Inc. | 5,179 | 35 | ||||||
| 2025-08-15 | 13F | Caxton Associates Llp | 48,210 | 0.00 | 330 | -2.66 | ||||
| 2025-08-25 | NP | TMVAX - RBC Microcap Value Fund A Shares | 24,100 | 0.00 | 165 | -2.96 | ||||
| 2025-07-14 | 13F | Gries Financial Llc | 43,935 | 0.00 | 301 | -2.60 | ||||
| 2025-08-04 | 13F | Integrity Alliance, Llc. | 11,935 | 0.81 | 82 | -2.41 | ||||
| 2025-07-14 | 13F | UMA Financial Services, Inc. | 175 | 1 | ||||||
| 2025-08-08 | 13F | Foundations Investment Advisors, LLC | 29,465 | 0.03 | 202 | -2.90 | ||||
| 2025-08-06 | 13F | Ethos Financial Group, LLC | 28,212 | 0.00 | 193 | -3.03 | ||||
| 2025-08-13 | 13F | Northwestern Mutual Wealth Management Co | 7,275 | 0.00 | 50 | -3.92 | ||||
| 2025-08-14 | 13F | Two Sigma Investments, Lp | 928,171 | -4.01 | 6,349 | -6.61 | ||||
| 2025-08-15 | 13F | Great West Life Assurance Co /can/ | 67,685 | 6.55 | 0 | |||||
| 2025-08-11 | 13F | Universal- Beteiligungs- und Servicegesellschaft mbH | 348,800 | 0.00 | 2,386 | -2.73 | ||||
| 2025-07-22 | 13F | Sage Investment Counsel LLC | 17,000 | -15.00 | 116 | -17.14 | ||||
| 2025-07-16 | 13F | Meridian Investment Counsel Inc. | 45,200 | -2.16 | 309 | -4.63 | ||||
| 2025-08-08 | 13F | Fortis Group Advisors, LLC | 523 | 0.00 | 4 | 0.00 | ||||
| 2025-07-08 | 13F | Parallel Advisors, LLC | 11,199 | -5.04 | 77 | -7.32 | ||||
| 2025-07-31 | 13F | Catalyst Capital Advisors LLC | 68,210 | 0.00 | 467 | -2.71 |