Mga Batayang Estadistika
| Pemilik Institusional | 131 total, 125 long only, 1 short only, 5 long/short - change of -4.38% MRQ |
| Alokasi Portofolio Rata-rata | 0.1337 % - change of -10.37% MRQ |
| Saham Institusional (Jangka Panjang) | 7,690,398 (ex 13D/G) - change of 1.91MM shares 33.13% MRQ |
| Nilai Institusional (Jangka Panjang) | $ 642,136 USD ($1000) |
Kepemilikan Institusional dan Pemegang Saham
VanEck ETF Trust - VanEck Pharmaceutical ETF (US:PPH) memiliki 131 pemilik institusional dan pemegang saham yang telah mengajukan formulir 13D/G atau 13F kepada Komisi Bursa Efek (Securities Exchange Commission/SEC). Lembaga-lembaga ini memegang total 7,690,398 saham. Pemegang saham terbesar meliputi Goldman Sachs Group Inc, Morgan Stanley, Healthcare Of Ontario Pension Plan Trust Fund, Wells Fargo & Company/mn, Clal Insurance Enterprises Holdings Ltd, Jane Street Group, Llc, Avalon Trust Co, J.Safra Asset Management Corp, Jpmorgan Chase & Co, and Susquehanna International Group, Llp .
Struktur kepemilikan institusional VanEck ETF Trust - VanEck Pharmaceutical ETF (NasdaqGM:PPH) menunjukkan posisi terkini di perusahaan oleh institusi dan dana, serta perubahan terbaru dalam ukuran posisi. Pemegang saham utama dapat mencakup investor individu, reksa dana, dana lindung nilai, atau institusi. Jadwal 13D menunjukkan bahwa investor memegang (atau pernah memegang) lebih dari 5% saham perusahaan dan bermaksud (atau pernah bermaksud) untuk secara aktif mengejar perubahan strategi bisnis. Jadwal 13G menunjukkan investasi pasif lebih dari 5%.
The share price as of September 5, 2025 is 89.03 / share. Previously, on September 6, 2024, the share price was 96.66 / share. This represents a decline of 7.89% over that period.

Skor Sentimen Dana
Skor Sentimen Dana (sebelumnya dikenal sebagai Skor Akumulasi Kepemilikan) menemukan saham-saham yang paling banyak dibeli oleh dana. Ini adalah hasil dari model kuantitatif multi-faktor yang canggih yang mengidentifikasi perusahaan dengan tingkat akumulasi institusional tertinggi. Model penilaian menggunakan kombinasi dari total peningkatan pemilik yang diungkapkan, perubahan dalam alokasi portofolio pada pemilik tersebut, dan metrik lainnya. Angka berkisar dari 0 hingga 100, dengan angka yang lebih tinggi menunjukkan tingkat akumulasi yang lebih tinggi dibandingkan dengan perusahaan sejenisnya, dan 50 adalah rata-ratanya.
Frekuensi Pembaruan: Setiap Hari
Lihat Ownership Explorer, yang menyediakan daftar perusahaan dengan peringkat tertinggi.
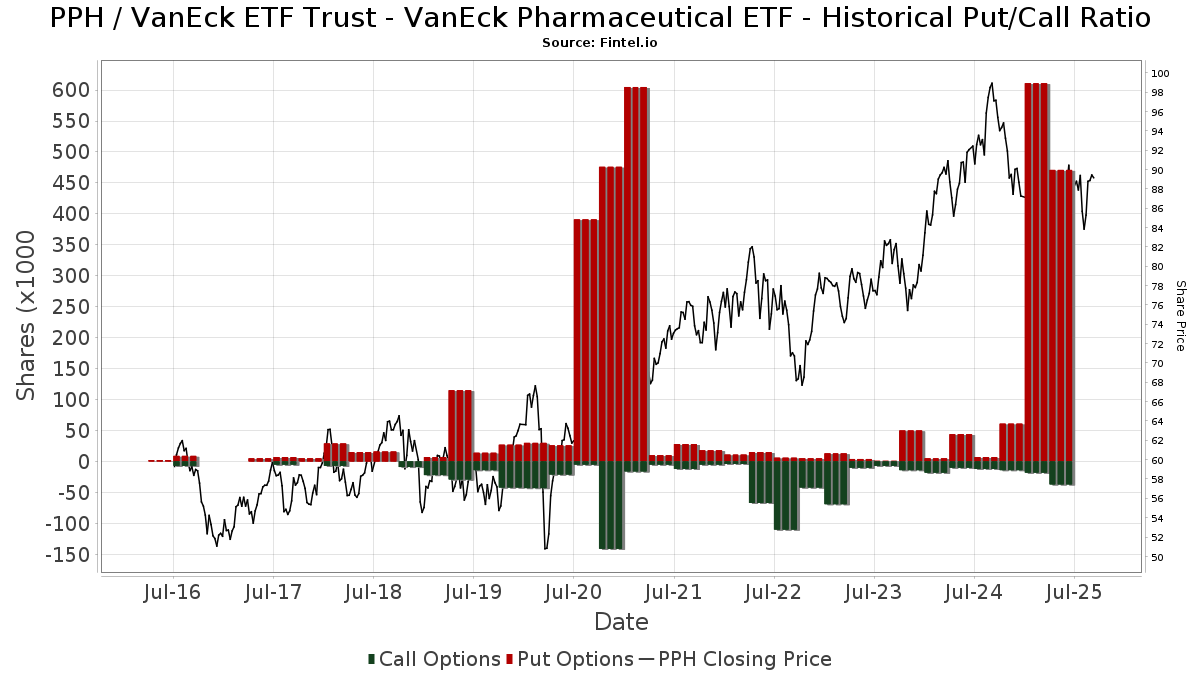
Rasio Put/Call Institusional
Selain melaporkan isu ekuitas dan utang standar, institusi dengan aset di bawah manajemen lebih dari 100 juta dolar AS juga harus mengungkapkan kepemilikan opsi put dan call mereka. Karena opsi put umumnya menunjukkan sentimen negatif, dan opsi call menunjukkan sentimen positif, kita dapat mengetahui sentimen institusional secara keseluruhan dengan memplot rasio put terhadap call. Grafik di sebelah kanan memplot rasio put/call historis untuk instrumen ini.
Menggunakan Rasio Put/Call sebagai indikator sentimen investor mengatasi salah satu kekurangan utama dari penggunaan total kepemilikan institusional, yaitu sejumlah besar aset yang dikelola diinvestasikan secara pasif untuk melacak indeks. Dana yang dikelola secara pasif biasanya tidak membeli opsi, sehingga indikator rasio put/call lebih akurat dalam melacak sentimen dana yang dikelola secara aktif.
Pengajuan 13F dan NPORT
Detail pada pengajuan 13F tersedia gratis. Detail pada pengajuan NP memerlukan keanggotaan premium. Baris berwarna hijau menunjukkan posisi baru. Baris berwarna merah menunjukkan posisi yang sudah ditutup. Klik tautan ini ikon untuk melihat riwayat transaksi selengkapnya.
Tingkatkan
untuk membuka data premium dan mengekspor ke Excel ![]() .
.
| Tanggal File | Sumber | Investor | Ketik | Presyo ng Avg (Silangan) |
Saham | Δ Saham (%) |
Dilaporkan Nilai ($1000) |
Nilai Δ (%) |
Alokasi Port (%) |
|
|---|---|---|---|---|---|---|---|---|---|---|
| 2025-08-13 | 13F | Beacon Pointe Advisors, LLC | 2,428 | 0.00 | 214 | -3.62 | ||||
| 2025-08-12 | 13F | Jpmorgan Chase & Co | 255,837 | 2,852.19 | 22,503 | 2,752.09 | ||||
| 2025-08-13 | 13F | Level Four Advisory Services, Llc | 37,495 | 3.11 | 3,298 | -0.45 | ||||
| 2025-08-08 | 13F | SBI Securities Co., Ltd. | 284 | -16.22 | 25 | -20.00 | ||||
| 2025-08-12 | 13F | Steward Partners Investment Advisory, Llc | 16,161 | 0.00 | 1,422 | -3.46 | ||||
| 2025-07-28 | 13F | Mutual Advisors, LLC | 0 | -100.00 | 0 | |||||
| 2025-05-08 | 13F | Private Advisory Group LLC | 0 | -100.00 | 0 | -100.00 | ||||
| 2025-07-22 | 13F | IMC-Chicago, LLC | 0 | -100.00 | 0 | |||||
| 2025-07-15 | 13F | North Star Investment Management Corp. | 1,109 | 0.09 | 98 | -3.96 | ||||
| 2025-08-07 | 13F | Allworth Financial LP | 385 | 10.32 | 34 | 10.00 | ||||
| 2025-05-20 | 13F/A | Colony Group, LLC | 0 | -100.00 | 0 | -100.00 | ||||
| 2025-08-13 | 13F | Jones Financial Companies Lllp | 3,240 | 13.68 | 283 | 9.69 | ||||
| 2025-05-14 | 13F | Oarsman Capital, Inc. | 0 | -100.00 | 0 | -100.00 | ||||
| 2025-07-29 | 13F | Stratos Wealth Advisors, LLC | 4,066 | -0.76 | 358 | -4.29 | ||||
| 2025-08-11 | 13F | Aptus Capital Advisors, LLC | 524 | 0.58 | 46 | -2.13 | ||||
| 2025-08-14 | 13F | DeepCurrents Investment Group LLC | Put | 0 | -100.00 | 0 | ||||
| 2025-07-31 | 13F | Conservest Capital Advisors, Inc. | 5,059 | 0.16 | 445 | -3.48 | ||||
| 2025-08-05 | 13F | Bank Of Montreal /can/ | 11,398 | -26.88 | 1,003 | -29.44 | ||||
| 2025-08-14 | 13F | Two Sigma Investments, Lp | 0 | -100.00 | 0 | |||||
| 2025-08-12 | 13F | MAI Capital Management | 938 | -6.11 | 82 | -9.89 | ||||
| 2025-08-14 | 13F | D. E. Shaw & Co., Inc. | 30,254 | 2,661 | ||||||
| 2025-08-14 | 13F | Stifel Financial Corp | 11,456 | -0.05 | 1,008 | -3.54 | ||||
| 2025-07-22 | 13F | Bank Hapoalim Bm | 3,948 | -2.35 | 0 | |||||
| 2025-08-05 | 13F | Dunhill Financial, LLC | 2,833 | 249 | ||||||
| 2025-08-08 | 13F | Cetera Investment Advisers | 36,017 | 4.01 | 3,168 | 0.41 | ||||
| 2025-08-13 | 13F | Capital Analysts, Inc. | 232 | 0.00 | 0 | |||||
| 2025-08-19 | 13F | Anchor Investment Management, LLC | 58 | 0.00 | 5 | 0.00 | ||||
| 2025-04-29 | 13F | Hm Payson & Co | 99 | 0.00 | 9 | 12.50 | ||||
| 2025-07-25 | 13F | Cwm, Llc | 375 | 167.86 | 0 | |||||
| 2025-08-14 | 13F | Goldman Sachs Group Inc | 2,762,770 | 138.13 | 243,013 | 129.85 | ||||
| 2025-07-14 | 13F | Buska Wealth Management, LLC | 3,297 | -18.11 | 290 | -20.77 | ||||
| 2025-08-04 | 13F | Creative Financial Designs Inc /adv | 2,129 | 18.15 | 187 | 14.02 | ||||
| 2025-04-23 | 13F | Spirepoint Private Client, Llc | 0 | -100.00 | 0 | |||||
| 2025-07-28 | 13F | Harbour Investments, Inc. | 4,450 | 9.71 | 391 | 5.96 | ||||
| 2025-08-11 | 13F | Independent Advisor Alliance | 51,519 | 11.24 | 4,532 | 7.37 | ||||
| 2025-08-14 | 13F | UBS Group AG | 163,718 | -26.26 | 14,401 | -28.82 | ||||
| 2025-07-16 | 13F | Twelve Points Wealth Management LLC | 0 | -100.00 | 0 | |||||
| 2025-08-13 | 13F | Renaissance Technologies Llc | 14,400 | 1,267 | ||||||
| 2025-05-12 | 13F | Pura Vida Investments, Llc | Put | 0 | -100.00 | 0 | ||||
| 2025-08-14 | 13F | Jane Street Group, Llc | Put | 98,100 | 174.79 | 8,629 | 165.23 | |||
| 2025-08-14 | 13F | Jane Street Group, Llc | Call | 2,600 | -10.34 | 229 | -13.64 | |||
| 2025-08-04 | 13F | Canton Hathaway, LLC | 10,000 | 0.00 | 1 | |||||
| 2025-08-14 | 13F | Jane Street Group, Llc | 299,380 | 927.84 | 26,333 | 892.20 | ||||
| 2025-03-12 | 13F | Centaurus Financial, Inc. | 0 | -100.00 | 0 | |||||
| 2025-08-15 | 13F | Tower Research Capital LLC (TRC) | 34,624 | 346,140.00 | 3,046 | |||||
| 2025-07-23 | 13F | Elm3 Financial Group, LLC | 2,439 | -22.08 | 215 | -24.91 | ||||
| 2025-07-28 | 13F | Copia Wealth Management | 5,429 | -11.90 | 478 | -14.97 | ||||
| 2025-08-08 | 13F | Avalon Trust Co | 280,477 | -1.13 | 24,671 | -4.57 | ||||
| 2025-07-08 | 13F | Arlington Trust Co LLC | 85 | 0.00 | 7 | 0.00 | ||||
| 2025-08-12 | 13F | Inscription Capital, LLC | 0 | -100.00 | 0 | |||||
| 2025-05-13 | 13F | SFI Advisors, LLC | 0 | -100.00 | 0 | |||||
| 2025-08-12 | 13F | Park Square Financial Group, LLC | 600 | 0.00 | 53 | -3.70 | ||||
| 2025-08-11 | 13F | Banque Cantonale Vaudoise | 629 | 0.00 | 0 | |||||
| 2025-08-14 | 13F | Wells Fargo & Company/mn | 402,987 | 35,447 | ||||||
| 2025-08-12 | 13F | Accredited Wealth Management, LLC | 100 | 0.00 | 9 | -11.11 | ||||
| 2025-08-12 | 13F | Proequities, Inc. | 0 | 0 | ||||||
| 2025-07-16 | 13F | Signaturefd, Llc | 0 | -100.00 | 0 | |||||
| 2025-08-06 | 13F | Kcm Investment Advisors Llc | 2,893 | -1.03 | 254 | -4.51 | ||||
| 2025-07-28 | 13F | J.Safra Asset Management Corp | 271,620 | 1.71 | 23,759 | -2.38 | ||||
| 2025-08-13 | 13F | Continuum Advisory, LLC | 0 | -100.00 | 0 | |||||
| 2025-08-06 | 13F | AE Wealth Management LLC | 1,004 | -4.02 | 88 | -7.37 | ||||
| 2025-08-11 | 13F | Principal Securities, Inc. | 353 | 38.98 | 31 | 47.62 | ||||
| 2025-07-31 | 13F | Oppenheimer & Co Inc | 11,111 | 2.10 | 977 | -1.41 | ||||
| 2025-08-14 | 13F | Bank Of America Corp /de/ | 59,637 | -66.51 | 5,246 | -67.68 | ||||
| 2025-08-14 | 13F | Wells Fargo & Company/mn | Put | 8,200 | 721 | |||||
| 2025-08-13 | 13F | Fisher Asset Management, LLC | 15,001 | -98.83 | 1,319 | -98.87 | ||||
| 2025-08-14 | 13F | Two Sigma Securities, Llc | 4,480 | 40.09 | 394 | 35.40 | ||||
| 2025-05-30 | NP | ERNZ - TrueShares Active Yield ETF | 5,579 | 508 | ||||||
| 2025-08-14 | 13F | Raymond James Financial Inc | 22,417 | 11.78 | 1,972 | 7.88 | ||||
| 2025-08-14 | 13F | Hrt Financial Lp | 0 | -100.00 | 0 | |||||
| 2025-08-14 | 13F | Aspen Grove Capital, LLC | 25,844 | 0.58 | 2,273 | -2.90 | ||||
| 2025-08-07 | 13F | Montag A & Associates Inc | 660 | 0.00 | 58 | -3.33 | ||||
| 2025-08-12 | 13F | Jefferies Financial Group Inc. | 3,262 | 287 | ||||||
| 2025-09-04 | 13F/A | Advisor Group Holdings, Inc. | 22,125 | 82.35 | 1,946 | 75.95 | ||||
| 2025-07-29 | 13F | TrueMark Investments, LLC | 0 | -100.00 | 0 | |||||
| 2025-08-11 | 13F | Citigroup Inc | 66,024 | 5,807 | ||||||
| 2025-07-23 | 13F | Fluent Financial, LLC | 0 | -100.00 | 0 | |||||
| 2025-07-11 | 13F | Farther Finance Advisors, LLC | 434 | -20.37 | 38 | -20.83 | ||||
| 2025-08-14 | 13F | GWM Advisors LLC | 102 | -98.85 | 9 | -99.01 | ||||
| 2025-08-06 | 13F | Miller Investment Management, LP | 181,536 | -4.27 | 15,968 | -7.60 | ||||
| 2025-07-23 | 13F | Prime Capital Investment Advisors, LLC | 96,870 | -26.43 | 8,521 | -28.99 | ||||
| 2025-08-05 | 13F | Telos Capital Management, Inc. | 4,516 | 2.08 | 397 | -1.49 | ||||
| 2025-04-24 | 13F | Nadler Financial Group, Inc. | 0 | -100.00 | 0 | |||||
| 2025-05-15 | 13F | Old Mission Capital Llc | 0 | -100.00 | 0 | -100.00 | ||||
| 2025-07-21 | 13F | Ntv Asset Management Llc | 7,957 | -13.25 | 700 | -16.29 | ||||
| 2025-05-15 | 13F | Marshall Wace, Llp | 0 | -100.00 | 0 | |||||
| 2025-08-14 | 13F | Sunbelt Securities, Inc. | 1,000 | 86 | ||||||
| 2025-07-07 | 13F | Nova Wealth Management, Inc. | 3,097 | -21.26 | 272 | -24.02 | ||||
| 2025-07-24 | 13F | Us Bancorp \de\ | 414 | -48.64 | 36 | -50.68 | ||||
| 2025-08-14 | 13F | Headlands Technologies LLC | 0 | -100.00 | 0 | -100.00 | ||||
| 2025-04-16 | 13F | Wealth Enhancement Advisory Services, Llc | Put | 0 | -100.00 | 0 | ||||
| 2025-08-14 | 13F | CoreFirst Bank & Trust | 200 | 18 | ||||||
| 2025-08-04 | 13F | Assetmark, Inc | 16 | -76.12 | 1 | -83.33 | ||||
| 2025-08-08 | 13F | Hartland & Co., LLC | 500 | 44 | ||||||
| 2025-04-16 | 13F | Hoey Investments, Inc | 0 | -100.00 | 0 | |||||
| 2025-08-11 | 13F | Blue Bell Private Wealth Management, Llc | 0 | -100.00 | 0 | |||||
| 2025-08-25 | 13F/A | Neuberger Berman Group LLC | 3,593 | 0.00 | 316 | -3.36 | ||||
| 2025-08-15 | 13F | Morgan Stanley | 538,398 | 489.05 | 47,358 | 468.58 | ||||
| 2025-07-09 | 13F | Dynamic Advisor Solutions LLC | 0 | -100.00 | 0 | |||||
| 2025-07-15 | 13F | Capital Investment Advisors, LLC | 0 | -100.00 | 0 | |||||
| 2025-07-31 | 13F | Cambridge Investment Research Advisors, Inc. | 3,153 | -6.96 | 0 | |||||
| 2025-08-12 | 13F | LPL Financial LLC | 48,228 | -0.53 | 4,242 | -3.98 | ||||
| 2025-08-15 | 13F | Equitable Holdings, Inc. | 14,241 | 1.61 | 1,253 | -1.96 | ||||
| 2025-08-11 | 13F | Tidemark, LLC | 486 | 8.00 | 43 | 2.44 | ||||
| 2025-08-14 | 13F | CIBC World Markets Inc. | 4,075 | -8.39 | 358 | -11.60 | ||||
| 2025-07-14 | 13F | U.S. Capital Wealth Advisors, LLC | 2,750 | 5.77 | 242 | 2.12 | ||||
| 2025-07-17 | 13F | Janney Montgomery Scott LLC | 4,805 | -1.03 | 0 | |||||
| 2025-07-30 | 13F | Phoenix Holdings Ltd. | 61,276 | 13.77 | 5,390 | 7.97 | ||||
| 2025-08-11 | 13F | HHM Wealth Advisors, LLC | 1,350 | 0.00 | 119 | -4.07 | ||||
| 2025-08-11 | 13F | TD Waterhouse Canada Inc. | 170 | 0.00 | 15 | 0.00 | ||||
| 2025-08-14 | 13F | DecisionPoint Financial, LLC | 1,000 | 0.00 | 88 | -3.30 | ||||
| 2025-08-12 | 13F | Tradition Wealth Management, LLC | 6,064 | -6.19 | 533 | -9.51 | ||||
| 2025-04-17 | 13F | Grimes & Company, Inc. | 0 | -100.00 | 0 | |||||
| 2025-07-22 | 13F | Gsa Capital Partners Llp | 2,510 | -11.96 | 0 | |||||
| 2025-08-13 | 13F | Leuthold Group, Llc | 0 | -100.00 | 0 | |||||
| 2025-04-28 | 13F | Lansing Street Advisors | 0 | -100.00 | 0 | -100.00 | ||||
| 2025-07-28 | 13F | Mowery & Schoenfeld Wealth Management, LLC | 13 | 0.00 | 1 | 0.00 | ||||
| 2025-08-12 | 13F | Verity & Verity, LLC | 131,320 | 11,551 | ||||||
| 2025-04-18 | 13F | Edge Financial Advisors LLC | 0 | -100.00 | 0 | |||||
| 2025-08-26 | 13F/A | Thrivent Financial For Lutherans | 20,681 | 2 | ||||||
| 2025-07-24 | 13F | Blair William & Co/il | 12,295 | 34.30 | 1,081 | 29.62 | ||||
| 2025-08-12 | 13F | Trexquant Investment LP | 3,151 | 277 | ||||||
| 2025-05-05 | 13F | Mivtachim The Workers Social Insurance Fund Ltd. (Under Special Management) | 0 | -100.00 | 0 | -100.00 | ||||
| 2025-07-28 | 13F | Axxcess Wealth Management, Llc | 9,114 | 4.78 | 802 | 1.14 | ||||
| 2025-08-05 | 13F | GPS Wealth Strategies Group, LLC | 459 | 0.00 | 40 | -2.44 | ||||
| 2025-05-07 | 13F | Investment Management Corp /va/ /adv | 0 | -100.00 | 0 | |||||
| 2025-07-16 | 13F | AAFMAA Wealth Management & Trust LLC | 39,081 | -6.85 | 3,438 | -10.10 | ||||
| 2025-04-21 | 13F | SILVER OAK SECURITIES, Inc | 0 | -100.00 | 0 | |||||
| 2025-08-14 | 13F | Ameriprise Financial Inc | 3,364 | -1.38 | 296 | -4.84 | ||||
| 2025-07-23 | 13F | Vontobel Holding Ltd. | 3,800 | 0.00 | 334 | -3.47 | ||||
| 2025-08-01 | 13F | Envestnet Asset Management Inc | 4,275 | -14.45 | 376 | -17.36 | ||||
| 2025-08-27 | 13F/A | Brinker Capital Investments, LLC | 33,513 | -5.57 | 2,948 | -8.87 | ||||
| 2025-08-08 | 13F | Hudock, Inc. | 9,217 | 811 | ||||||
| 2025-08-13 | 13F | Healthcare Of Ontario Pension Plan Trust Fund | 512,000 | 0.00 | 45,036 | -3.48 | ||||
| 2025-05-06 | 13F | WT Wealth Management | 51,692 | -8.82 | 4,711 | -3.70 | ||||
| 2025-08-14 | 13F | Verition Fund Management LLC | 4,044 | -20.06 | 356 | -22.99 | ||||
| 2025-07-09 | 13F | Sapient Capital Llc | 2,588 | 0.00 | 228 | -3.40 | ||||
| 2025-08-06 | 13F | Commonwealth Equity Services, Llc | 13,287 | -28.66 | 1 | 0.00 | ||||
| 2025-08-13 | 13F | Quadrature Capital Ltd | 0 | -100.00 | 0 | |||||
| 2025-08-14 | 13F | Royal Bank Of Canada | 35,163 | -47.98 | 3,093 | -49.79 | ||||
| 2025-08-12 | 13F | Global Retirement Partners, LLC | 270 | -7.85 | 24 | -8.00 | ||||
| 2025-08-14 | 13F | Fmr Llc | 1,461 | -2.60 | 129 | -5.88 | ||||
| 2025-08-14 | 13F | Federation des caisses Desjardins du Quebec | 400 | 0.00 | 35 | -2.78 | ||||
| 2025-08-13 | 13F | Flow Traders U.s. Llc | 0 | -100.00 | 0 | |||||
| 2025-08-14 | 13F | Mml Investors Services, Llc | 2,511 | 2.11 | 0 | |||||
| 2025-08-13 | 13F | StoneX Group Inc. | 0 | -100.00 | 0 | -100.00 | ||||
| 2025-08-14 | 13F | J. Goldman & Co LP | Put | 131,800 | -29.44 | 11,593 | -31.90 | |||
| 2025-08-04 | 13F | Arkadios Wealth Advisors | 7,780 | 684 | ||||||
| 2025-07-22 | 13F | Belpointe Asset Management LLC | 5,704 | -1.60 | 502 | -5.11 | ||||
| 2025-05-02 | 13F | Apollon Wealth Management, LLC | 0 | -100.00 | 0 | |||||
| 2025-08-14 | 13F | Citadel Advisors Llc | Put | 13,000 | -77.89 | 1,143 | -78.67 | |||
| 2025-08-14 | 13F | Susquehanna International Group, Llp | Put | 214,400 | -34.81 | 18,859 | -37.08 | |||
| 2025-08-05 | 13F | Westside Investment Management, Inc. | 2,351 | 208 | ||||||
| 2025-08-14 | 13F | Susquehanna International Group, Llp | 53,664 | 105.52 | 4,720 | 98.40 | ||||
| 2025-08-14 | 13F | Susquehanna International Group, Llp | Call | 23,300 | 77.86 | 2,049 | 71.75 | |||
| 2025-07-31 | 13F | Burke & Herbert Bank & Trust Co | 8,865 | 0.00 | 780 | -3.47 | ||||
| 2025-08-14 | 13F | Citadel Advisors Llc | Call | 6,100 | 165.22 | 537 | 156.46 | |||
| 2025-07-16 | 13F | Investment Partners Asset Management, Inc. | 4,219 | -0.28 | 371 | -3.64 | ||||
| 2025-08-14 | 13F | Citadel Advisors Llc | 31,277 | -24.47 | 2,751 | -27.09 | ||||
| 2025-07-24 | 13F | CarsonAllaria Wealth Management, Ltd. | 0 | -100.00 | 0 | |||||
| 2025-07-24 | 13F | IFP Advisors, Inc | 285 | 0.00 | 25 | -3.85 | ||||
| 2025-08-13 | 13F | D L Carlson Investment Group Inc | 0 | -100.00 | 0 | |||||
| 2025-07-21 | 13F | Warner Financial, Inc | 4,636 | 0.61 | 0 | |||||
| 2025-08-08 | 13F | Pnc Financial Services Group, Inc. | 250 | 0.00 | 22 | -4.55 | ||||
| 2025-07-29 | 13F | Activest Wealth Management | 74 | 0.00 | 7 | 0.00 | ||||
| 2025-08-14 | 13F | Comerica Bank | 430 | -21.39 | 38 | -24.49 | ||||
| 2025-08-13 | 13F | Barclays Plc | 0 | -100.00 | 0 | |||||
| 2025-04-16 | 13F | Wealth Enhancement Advisory Services, Llc | 0 | -100.00 | 0 | |||||
| 2025-08-14 | 13F | Camden Capital, LLC | 2,807 | 0.57 | 247 | -3.15 | ||||
| 2025-08-27 | 13F/A | Squarepoint Ops LLC | Call | 5,700 | 501 | |||||
| 2025-05-29 | NP | LCR - Leuthold Core ETF | 4,006 | 365 | ||||||
| 2025-08-13 | 13F | Financial Freedom, LLC | 9,006 | 0.17 | 792 | -3.30 | ||||
| 2025-08-27 | 13F/A | Squarepoint Ops LLC | Put | 5,700 | 501 | |||||
| 2025-03-28 | 13F/A | Berkeley, Inc | 0 | -100.00 | 0 | |||||
| 2025-07-10 | 13F | Global Financial Private Client, LLC | 0 | -100.00 | 0 | |||||
| 2025-08-14 | 13F | Bnp Paribas Arbitrage, Sa | 108,629 | 0.00 | 9,555 | -3.48 | ||||
| 2025-05-15 | 13F | Blue Chip Partners, Inc. | 0 | -100.00 | 0 | |||||
| 2025-04-25 | 13F | Almanack Investment Partners, LLC. | 0 | -100.00 | 0 | |||||
| 2025-08-13 | 13F | Northwestern Mutual Wealth Management Co | 12,790 | 76.73 | 1,125 | 70.71 | ||||
| 2025-08-18 | 13F/A | National Bank Of Canada /fi/ | 513 | 0.00 | 45 | -2.17 | ||||
| 2025-08-14 | 13F | Qube Research & Technologies Ltd | 16,190 | 13,856.90 | 1,424 | 14,140.00 | ||||
| 2025-08-12 | 13F | Clal Insurance Enterprises Holdings Ltd | 325,000 | 29 | ||||||
| 2025-05-15 | 13F | Millennium Management Llc | 0 | -100.00 | 0 | -100.00 | ||||
| 2025-07-08 | 13F | Adamsbrown Wealth Consultants Llc | 195,976 | 12.05 | 17,238 | 8.16 | ||||
| 2025-08-06 | 13F | Nvwm, Llc | 38 | 3 | ||||||
| 2025-07-25 | 13F | Atria Wealth Solutions, Inc. | 2,739 | 0.00 | 241 | -3.61 | ||||
| 2025-05-15 | 13F/A | Orion Portfolio Solutions, LLC | 35,490 | 18.78 | 3,234 | 25.45 | ||||
| 2025-07-18 | 13F | SOA Wealth Advisors, LLC. | 0 | -100.00 | 0 |