Mga Batayang Estadistika
| Pemilik Institusional | 187 total, 187 long only, 0 short only, 0 long/short - change of -4.59% MRQ |
| Alokasi Portofolio Rata-rata | 0.2028 % - change of -21.07% MRQ |
| Saham Institusional (Jangka Panjang) | 18,992,275 (ex 13D/G) - change of -3.07MM shares -13.91% MRQ |
| Nilai Institusional (Jangka Panjang) | $ 780,734 USD ($1000) |
Kepemilikan Institusional dan Pemegang Saham
Invesco Exchange-Traded Fund Trust II - Invesco S&P SmallCap 600 Revenue ETF (US:RWJ) memiliki 187 pemilik institusional dan pemegang saham yang telah mengajukan formulir 13D/G atau 13F kepada Komisi Bursa Efek (Securities Exchange Commission/SEC). Lembaga-lembaga ini memegang total 18,992,275 saham. Pemegang saham terbesar meliputi LPL Financial LLC, Morgan Stanley, Ameriprise Financial Inc, Fusion Family Wealth LLC, Bank Of America Corp /de/, UBS Group AG, Raymond James Financial Inc, Commonwealth Equity Services, Llc, Advisor Group Holdings, Inc., and Wells Fargo & Company/mn .
Struktur kepemilikan institusional Invesco Exchange-Traded Fund Trust II - Invesco S&P SmallCap 600 Revenue ETF (ARCA:RWJ) menunjukkan posisi terkini di perusahaan oleh institusi dan dana, serta perubahan terbaru dalam ukuran posisi. Pemegang saham utama dapat mencakup investor individu, reksa dana, dana lindung nilai, atau institusi. Jadwal 13D menunjukkan bahwa investor memegang (atau pernah memegang) lebih dari 5% saham perusahaan dan bermaksud (atau pernah bermaksud) untuk secara aktif mengejar perubahan strategi bisnis. Jadwal 13G menunjukkan investasi pasif lebih dari 5%.
The share price as of September 3, 2025 is 47.49 / share. Previously, on September 4, 2024, the share price was 43.61 / share. This represents an increase of 8.90% over that period.

Skor Sentimen Dana
Skor Sentimen Dana (sebelumnya dikenal sebagai Skor Akumulasi Kepemilikan) menemukan saham-saham yang paling banyak dibeli oleh dana. Ini adalah hasil dari model kuantitatif multi-faktor yang canggih yang mengidentifikasi perusahaan dengan tingkat akumulasi institusional tertinggi. Model penilaian menggunakan kombinasi dari total peningkatan pemilik yang diungkapkan, perubahan dalam alokasi portofolio pada pemilik tersebut, dan metrik lainnya. Angka berkisar dari 0 hingga 100, dengan angka yang lebih tinggi menunjukkan tingkat akumulasi yang lebih tinggi dibandingkan dengan perusahaan sejenisnya, dan 50 adalah rata-ratanya.
Frekuensi Pembaruan: Setiap Hari
Lihat Ownership Explorer, yang menyediakan daftar perusahaan dengan peringkat tertinggi.
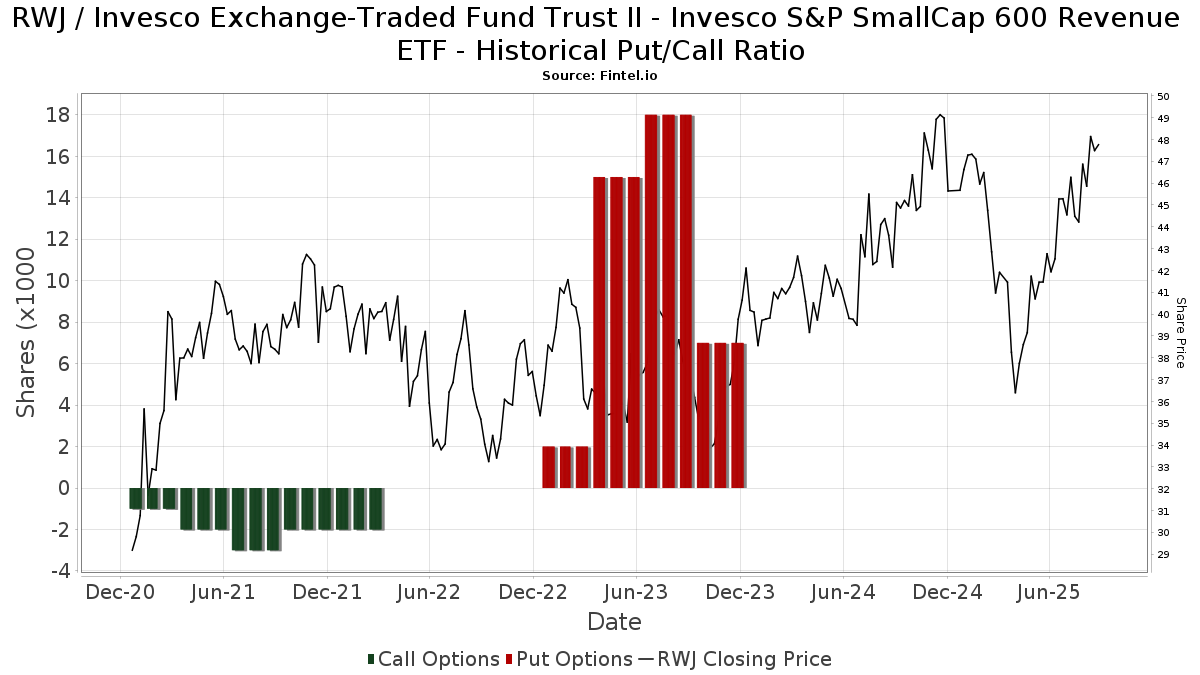
Rasio Put/Call Institusional
Selain melaporkan isu ekuitas dan utang standar, institusi dengan aset di bawah manajemen lebih dari 100 juta dolar AS juga harus mengungkapkan kepemilikan opsi put dan call mereka. Karena opsi put umumnya menunjukkan sentimen negatif, dan opsi call menunjukkan sentimen positif, kita dapat mengetahui sentimen institusional secara keseluruhan dengan memplot rasio put terhadap call. Grafik di sebelah kanan memplot rasio put/call historis untuk instrumen ini.
Menggunakan Rasio Put/Call sebagai indikator sentimen investor mengatasi salah satu kekurangan utama dari penggunaan total kepemilikan institusional, yaitu sejumlah besar aset yang dikelola diinvestasikan secara pasif untuk melacak indeks. Dana yang dikelola secara pasif biasanya tidak membeli opsi, sehingga indikator rasio put/call lebih akurat dalam melacak sentimen dana yang dikelola secara aktif.
Pengajuan 13F dan NPORT
Detail pada pengajuan 13F tersedia gratis. Detail pada pengajuan NP memerlukan keanggotaan premium. Baris berwarna hijau menunjukkan posisi baru. Baris berwarna merah menunjukkan posisi yang sudah ditutup. Klik tautan ini ikon untuk melihat riwayat transaksi selengkapnya.
Tingkatkan
untuk membuka data premium dan mengekspor ke Excel ![]() .
.
| Tanggal File | Sumber | Investor | Ketik | Presyo ng Avg (Silangan) |
Saham | Δ Saham (%) |
Dilaporkan Nilai ($1000) |
Nilai Δ (%) |
Alokasi Port (%) |
|
|---|---|---|---|---|---|---|---|---|---|---|
| 2025-08-13 | 13F | Advisor Group Holdings, Inc. | 511,091 | -13.46 | 23,371 | -2.81 | ||||
| 2025-07-28 | 13F | Harbour Investments, Inc. | 106,522 | -23.22 | 4,611 | -18.33 | ||||
| 2025-08-14 | 13F | Ausdal Financial Partners, Inc. | 30,891 | 4.42 | 1,337 | 11.05 | ||||
| 2025-07-17 | 13F | Janney Montgomery Scott LLC | 34,148 | -1.31 | 1 | 0.00 | ||||
| 2025-07-18 | 13F | Consolidated Planning Corp | 312,598 | -3.61 | 13,532 | 2.53 | ||||
| 2025-07-21 | 13F | Ameritas Advisory Services, LLC | 2,217 | 96 | ||||||
| 2025-07-21 | 13F | Ameriflex Group, Inc. | 0 | -100.00 | 0 | |||||
| 2025-08-14 | 13F | Wiley Bros.-aintree Capital, Llc | 121,751 | -4.77 | 5,271 | 6.29 | ||||
| 2025-08-14 | 13F | Advisor OS, LLC | 7,500 | 325 | ||||||
| 2025-05-13 | 13F | Brooklyn FI, LLC | 0 | -100.00 | 0 | -100.00 | ||||
| 2025-08-08 | 13F | Fiera Capital Corp | 7,851 | 0.00 | 340 | 6.27 | ||||
| 2025-07-25 | 13F | NorthRock Partners, LLC | 732 | -58.92 | 32 | -56.94 | ||||
| 2025-08-06 | 13F | Moors & Cabot, Inc. | 15,561 | -10.15 | 674 | -4.40 | ||||
| 2025-08-13 | 13F | Valued Retirements, Inc. | 62,493 | 1.33 | 2,705 | 7.77 | ||||
| 2025-05-12 | 13F | Founders Financial Securities Llc | 0 | -100.00 | 0 | |||||
| 2025-04-11 | 13F | LPF Advisors LLC | 9,871 | -17.98 | 402 | -27.09 | ||||
| 2025-08-07 | 13F | Kestra Private Wealth Services, Llc | 4,644 | 201 | ||||||
| 2025-07-08 | 13F | Zrc Wealth Management, Llc | 1,929 | 0.00 | 84 | 6.41 | ||||
| 2025-08-14 | 13F | Warren Averett Asset Management, LLC | 4,754 | 206 | ||||||
| 2025-08-06 | 13F | Vantage Financial Partners, LLC | 33,391 | 10.61 | 1,446 | 17.67 | ||||
| 2025-08-11 | 13F | Aptus Capital Advisors, LLC | 2,283 | 0.22 | 99 | 6.52 | ||||
| 2025-08-14 | 13F | EP Wealth Advisors, Inc. | 11,291 | 5.98 | 489 | 12.70 | ||||
| 2025-07-30 | 13F | Fusion Family Wealth LLC | 1,444,721 | 1.36 | 62,542 | 7.81 | ||||
| 2025-08-15 | 13F | Morgan Stanley | 2,054,911 | 0.72 | 88,957 | 7.13 | ||||
| 2025-04-11 | 13F | Unique Wealth, Llc | 0 | -100.00 | 0 | |||||
| 2025-04-21 | 13F | ORG Partners LLC | 0 | -100.00 | 0 | |||||
| 2025-07-23 | 13F | Prime Capital Investment Advisors, LLC | 33,887 | 1.13 | 1,467 | 7.56 | ||||
| 2025-08-14 | 13F | Susquehanna International Group, Llp | 76,111 | 846.18 | 3,295 | 907.34 | ||||
| 2025-07-10 | 13F | Sovran Advisors, LLC | 44,815 | -22.69 | 2,019 | -5.96 | ||||
| 2025-07-25 | 13F | Cwm, Llc | 812 | 223.51 | 0 | |||||
| 2025-08-12 | 13F | Aviso Financial Inc. | 600 | 26 | ||||||
| 2025-08-12 | 13F | Fortis Capital Management LLC | 35,047 | -8.77 | 1,517 | -2.94 | ||||
| 2025-07-15 | 13F | CHB Investment Group, LLC | 23,982 | -0.91 | 1 | |||||
| 2025-07-10 | 13F | Marshall Financial Group LLC | 12,089 | 0.01 | 540 | 9.78 | ||||
| 2025-08-14 | 13F | Comerica Bank | 4,867 | -4.47 | 211 | 1.45 | ||||
| 2025-07-17 | 13F | Montis Financial, LLC | 7,092 | -18.23 | 307 | -12.78 | ||||
| 2025-08-11 | 13F | Tidemark, LLC | 802 | -65.73 | 35 | -64.21 | ||||
| 2025-08-13 | 13F/A | StoneX Group Inc. | 6,695 | 0.01 | 803 | -2.55 | ||||
| 2025-07-11 | 13F | SILVER OAK SECURITIES, Inc | 9,588 | 0.00 | 415 | 6.41 | ||||
| 2025-08-12 | 13F | Coldstream Capital Management Inc | 0 | -100.00 | 0 | |||||
| 2025-08-15 | 13F | Captrust Financial Advisors | 8,867 | 58.54 | 384 | 68.72 | ||||
| 2025-08-13 | 13F | Cerity Partners LLC | 19,583 | 0.01 | 848 | 6.41 | ||||
| 2025-08-14 | 13F/A | Rockefeller Capital Management L.P. | 35,853 | 0.63 | 1,552 | 7.03 | ||||
| 2025-07-25 | 13F | Retirement Planning Group, Llc / Ny | 11,638 | 2.86 | 504 | 9.35 | ||||
| 2025-07-31 | 13F | CVA Family Office, LLC | 124 | 0.00 | 5 | 0.00 | ||||
| 2025-07-24 | 13F | IFP Advisors, Inc | 101,912 | 12.62 | 4,412 | 19.77 | ||||
| 2025-08-12 | 13F | Jpmorgan Chase & Co | 34,605 | -3.33 | 1,498 | 2.88 | ||||
| 2025-08-13 | 13F | Capital Analysts, Inc. | 922 | 0.00 | 0 | |||||
| 2025-07-30 | 13F | Nottingham Advisors, Inc. | 26,680 | 0.00 | 1,155 | 6.36 | ||||
| 2025-07-25 | 13F | Atria Wealth Solutions, Inc. | 6,673 | -47.87 | 289 | -44.62 | ||||
| 2025-08-07 | 13F | Guidance Capital, Inc | 29,989 | 7.78 | 1,286 | 16.08 | ||||
| 2025-08-12 | 13F | J.w. Cole Advisors, Inc. | 5,877 | -17.48 | 254 | -12.11 | ||||
| 2025-07-10 | 13F | Tompkins Financial Corp | 456 | -16.48 | 20 | -13.64 | ||||
| 2025-07-22 | 13F | Valley National Advisers Inc | 0 | -100.00 | 0 | |||||
| 2025-08-12 | 13F | Calton & Associates, Inc. | 0 | -100.00 | 0 | |||||
| 2025-08-12 | 13F | OneAscent Financial Services LLC | 6,514 | -44.12 | 0 | |||||
| 2025-08-08 | 13F | Opinicus Capital, Inc. | 38,162 | 4.05 | 1,652 | 10.72 | ||||
| 2025-07-10 | 13F | Kmg Fiduciary Partners, Llc | 8,606 | -59.76 | 373 | -57.24 | ||||
| 2025-08-08 | 13F | Avantax Advisory Services, Inc. | 75,213 | 9.35 | 3,256 | 16.29 | ||||
| 2025-08-14 | 13F | Integrity Wealth Advisors, Inc. | 12,862 | 10.28 | 557 | 17.30 | ||||
| 2025-04-28 | 13F | Strategic Financial Concepts, LLC | 0 | -100.00 | 0 | -100.00 | ||||
| 2025-08-08 | 13F | Pnc Financial Services Group, Inc. | 111 | 0.00 | 5 | 0.00 | ||||
| 2025-07-16 | 13F | Kendall Capital Management | 0 | -100.00 | 0 | |||||
| 2025-08-05 | 13F | Tsfg, Llc | 11,080 | 0.46 | 0 | |||||
| 2025-08-13 | 13F | Brown Advisory Inc | 14,001 | 9.37 | 606 | 16.31 | ||||
| 2025-08-01 | 13F | Gwn Securities Inc. | 0 | -100.00 | 0 | |||||
| 2025-08-12 | 13F | Insigneo Advisory Services, Llc | 6,820 | -3.66 | 295 | 2.43 | ||||
| 2025-07-11 | 13F | Farther Finance Advisors, LLC | 159 | 0.00 | 7 | 0.00 | ||||
| 2025-08-14 | 13F | Wells Fargo & Company/mn | 448,260 | -26.44 | 19,405 | -21.75 | ||||
| 2025-08-11 | 13F | Citigroup Inc | 201 | 0.50 | 9 | 0.00 | ||||
| 2025-05-13 | 13F | Thrivent Financial For Lutherans | 0 | -100.00 | 0 | |||||
| 2025-08-11 | 13F | Principal Securities, Inc. | 5,297 | -74.66 | 229 | -76.05 | ||||
| 2025-08-14 | 13F | Jane Street Group, Llc | 42,655 | -0.97 | 1,847 | 5.31 | ||||
| 2025-08-13 | 13F | Jones Financial Companies Lllp | 85,378 | 32.50 | 3,707 | 41.43 | ||||
| 2025-08-18 | 13F | Geneos Wealth Management Inc. | 16,169 | 4.84 | 700 | 11.48 | ||||
| 2025-08-11 | 13F | Nations Financial Group Inc, /ia/ /adv | 13,674 | -0.19 | 592 | 6.10 | ||||
| 2025-08-12 | 13F | Titleist Asset Management, Llc | 4,997 | -61.23 | 216 | -58.78 | ||||
| 2025-07-16 | 13F | Meridian Financial, LLC | 4,910 | 213 | ||||||
| 2025-07-31 | 13F | WFA Asset Management Corp | 256,564 | -18.72 | 10,281 | -23.93 | ||||
| 2025-07-08 | 13F | Nbc Securities, Inc. | 268 | 0.00 | 0 | |||||
| 2025-08-14 | 13F | Mpwm Advisory Solutions, Llc | 0 | -100.00 | 0 | |||||
| 2025-07-28 | 13F | Copia Wealth Management | 9,452 | 5.49 | 409 | 12.36 | ||||
| 2025-05-12 | 13F | Independent Advisor Alliance | 0 | -100.00 | 0 | |||||
| 2025-08-14 | 13F | Pine Harbor Wealth Management, LLC | 6,909 | 0.00 | 299 | 6.41 | ||||
| 2025-08-12 | 13F | Ameritas Investment Partners, Inc. | 18,804 | 13.43 | 814 | 20.77 | ||||
| 2025-08-27 | 13F/A | Brinker Capital Investments, LLC | 19,243 | 19.80 | 833 | 27.57 | ||||
| 2025-08-04 | 13F | Flagship Harbor Advisors, Llc | 0 | -100.00 | 0 | |||||
| 2025-08-14 | 13F | Two Sigma Securities, Llc | 7,206 | 312 | ||||||
| 2025-08-08 | 13F | Foundations Investment Advisors, LLC | 168,224 | 10.28 | 7,282 | 17.30 | ||||
| 2025-04-29 | 13F | Hm Payson & Co | 1,254 | 0.00 | 51 | -10.53 | ||||
| 2025-05-15 | 13F | Ashton Thomas Securities, Llc | 0 | -100.00 | 0 | |||||
| 2025-07-21 | 13F | DHJJ Financial Advisors, Ltd. | 108 | 0.00 | 5 | 0.00 | ||||
| 2025-08-08 | 13F | Ogorek Anthony Joseph /ny/ /adv | 420 | 0.24 | 0 | |||||
| 2025-08-11 | 13F | Private Advisor Group, LLC | 285,829 | -33.90 | 12,374 | -29.70 | ||||
| 2025-08-14 | 13F | UBS Group AG | 809,267 | 51.31 | 35,033 | 60.95 | ||||
| 2025-08-08 | 13F | Gts Securities Llc | 18,805 | -21.84 | 814 | -16.85 | ||||
| 2025-07-29 | 13F | Private Trust Co Na | 3,094 | -10.66 | 134 | -5.00 | ||||
| 2025-08-12 | 13F | Fairscale Capital, LLC | 36 | 0.00 | 2 | 0.00 | ||||
| 2025-05-05 | 13F | Lindbrook Capital, Llc | 3,000 | 0.00 | 122 | -10.95 | ||||
| 2025-08-01 | 13F | Bessemer Group Inc | 7,065 | -1.40 | 0 | |||||
| 2025-08-21 | 13F | Aveo Capital Partners, LLC | 0 | -100.00 | 0 | |||||
| 2025-08-15 | 13F | Equitable Holdings, Inc. | 7,847 | 22.42 | 340 | 30.38 | ||||
| 2025-08-14 | 13F | Sunbelt Securities, Inc. | 0 | -100.00 | 0 | |||||
| 2025-07-29 | 13F | Signature Estate & Investment Advisors Llc | 4,704 | 204 | ||||||
| 2025-08-14 | 13F | Goldman Sachs Group Inc | 60,002 | 0.00 | 2,597 | 6.35 | ||||
| 2025-05-12 | 13F | Sandy Spring Bank | 1,864 | 0.00 | 76 | -11.76 | ||||
| 2025-08-07 | 13F | Legacy Financial Advisors, Inc. | 29,217 | 7.44 | 1,265 | 14.29 | ||||
| 2025-07-22 | 13F | Belpointe Asset Management LLC | 27,895 | 33.19 | 1,208 | 41.67 | ||||
| 2025-05-15 | 13F/A | Orion Portfolio Solutions, LLC | 16,063 | -9.60 | 654 | -19.68 | ||||
| 2025-08-11 | 13F | Western Wealth Management, LLC | 31,289 | 1.58 | 1,355 | 8.06 | ||||
| 2025-08-08 | 13F | Creative Planning | 29,181 | -4.02 | 1,263 | 2.10 | ||||
| 2025-08-14 | 13F | Citadel Advisors Llc | 104,019 | 161.35 | 4,503 | 178.07 | ||||
| 2025-07-16 | 13F | Swisher Financial Concepts, Inc. | 18,484 | -30.30 | 800 | -25.86 | ||||
| 2025-07-21 | 13F | Patriot Financial Group Insurance Agency, LLC | 33,049 | 11.64 | 1,431 | 18.77 | ||||
| 2025-08-04 | 13F | Spire Wealth Management | 0 | -100.00 | 0 | |||||
| 2025-08-19 | 13F | Anchor Investment Management, LLC | 777 | 0.00 | 34 | 6.45 | ||||
| 2025-08-12 | 13F | MWA Asset Management | 6,731 | -24.20 | 291 | -19.39 | ||||
| 2025-08-14 | 13F | Raymond James Financial Inc | 646,992 | -57.87 | 28,008 | -55.19 | ||||
| 2025-07-14 | 13F | S.A. Mason LLC | 8,425 | 0.00 | 365 | 6.43 | ||||
| 2025-07-30 | 13F | Onyx Bridge Wealth Group LLC | 24,150 | -31.98 | 1,045 | -27.68 | ||||
| 2025-08-06 | 13F | Commonwealth Equity Services, Llc | 633,845 | 0.72 | 27 | 8.00 | ||||
| 2025-08-14 | 13F | Bnp Paribas Arbitrage, Sa | 204 | 385.71 | 9 | 700.00 | ||||
| 2025-07-10 | 13F | Wealth Enhancement Advisory Services, Llc | 207,340 | 11.03 | 9,405 | 23.74 | ||||
| 2025-08-06 | 13F | AE Wealth Management LLC | 567 | 16.91 | 25 | 26.32 | ||||
| 2025-08-14 | 13F | Mml Investors Services, Llc | 74,073 | -19.52 | 3 | 0.00 | ||||
| 2025-07-18 | 13F | Bartlett & Co. Wealth Management Llc | 21 | 0.00 | 1 | |||||
| 2025-07-18 | 13F | Truist Financial Corp | 22,287 | 1.03 | 965 | 7.47 | ||||
| 2025-07-15 | 13F | Main Street Group, LTD | 46,503 | 30.50 | 2,013 | 38.83 | ||||
| 2025-08-12 | 13F | Proequities, Inc. | 0 | 0 | ||||||
| 2025-07-30 | 13F | Pacific Sun Financial Corp | 40,164 | -0.33 | 1,739 | 5.98 | ||||
| 2025-08-04 | 13F | Pensionmark Financial Group, Llc | 8,790 | -75.65 | 381 | -74.13 | ||||
| 2025-08-14 | 13F | Fmr Llc | 5,771 | 6.55 | 250 | 13.18 | ||||
| 2025-07-17 | 13F | Cyr Financial Inc. | 115,557 | 9.83 | 5,002 | 16.81 | ||||
| 2025-07-14 | 13F | Sowell Financial Services LLC | 17,993 | 0.40 | 779 | 6.72 | ||||
| 2025-08-07 | 13F | Allworth Financial LP | 671 | 235.50 | 29 | 314.29 | ||||
| 2025-08-12 | 13F | AlphaCore Capital LLC | 210 | 9 | ||||||
| 2025-05-12 | 13F | C2P Capital Advisory Group, LLC d.b.a. Prosperity Capital Advisors | 0 | -100.00 | 0 | -100.00 | ||||
| 2025-08-05 | 13F | Sigma Planning Corp | 29,601 | -9.68 | 1,281 | -3.90 | ||||
| 2025-08-14 | 13F | GWM Advisors LLC | 38,555 | 14.89 | 1,669 | 22.27 | ||||
| 2025-08-13 | 13F | Renaissance Technologies Llc | 0 | -100.00 | 0 | |||||
| 2025-08-11 | 13F | Covestor Ltd | 66 | -50.00 | 0 | |||||
| 2025-08-13 | 13F | IAG Wealth Partners, LLC | 345 | 0.00 | 15 | 0.00 | ||||
| 2025-08-14 | 13F | Royal Bank Of Canada | 177,673 | 44.56 | 7,691 | 53.76 | ||||
| 2025-07-30 | 13F | Liberty One Investment Management, Llc | 49,549 | 5.21 | 2,145 | 11.90 | ||||
| 2025-07-30 | 13F | Crewe Advisors LLC | 0 | -100.00 | 0 | |||||
| 2025-07-14 | 13F | Cathy Pareto & Associates, Inc | 20,503 | -21.82 | 888 | -16.87 | ||||
| 2025-08-12 | 13F | Steward Partners Investment Advisory, Llc | 52,502 | 0.19 | 2,273 | 6.57 | ||||
| 2025-08-04 | 13F | Atria Investments Llc | 38,883 | -42.78 | 1,683 | -39.13 | ||||
| 2025-08-08 | 13F | Thoroughbred Financial Services, Llc | 28,280 | -55.57 | 1 | -50.00 | ||||
| 2025-08-14 | 13F | Great Valley Advisor Group, Inc. | 25,526 | -8.63 | 1,105 | -2.81 | ||||
| 2025-07-31 | 13F | Whipplewood Advisors, LLC | 3,270 | -88.58 | 142 | -71.63 | ||||
| 2025-08-14 | 13F | CoreCap Advisors, LLC | 47,251 | 16.54 | 2,045 | 23.94 | ||||
| 2025-08-25 | NP | KOOL - North Shore Equity Rotation ETF | 15,750 | -48.35 | 682 | -45.12 | ||||
| 2025-07-18 | 13F | Parsons Capital Management Inc/ri | 5,850 | 0.00 | 253 | 6.30 | ||||
| 2025-05-06 | 13F | Forbes J M & Co Llp | 0 | -100.00 | 0 | |||||
| 2025-08-12 | 13F | Financial Advocates Investment Management | 39,392 | -3.27 | 1,705 | 2.90 | ||||
| 2025-07-28 | 13F | Kiker Wealth Management, LLC | 589 | -67.73 | 25 | -66.22 | ||||
| 2025-07-07 | 13F | Investors Research Corp | 78 | 0.00 | 3 | 0.00 | ||||
| 2025-07-07 | 13F | Whitaker-Myers Wealth Managers, LTD. | 4,992 | 1.34 | 216 | 8.00 | ||||
| 2025-07-14 | 13F | Park Avenue Securities Llc | 5,591 | 0 | ||||||
| 2025-08-05 | 13F | Obermeyer Wood Investment Counsel, Lllp | 18,921 | 0.06 | 819 | 6.50 | ||||
| 2025-08-14 | 13F | Ancora Advisors, LLC | 288,126 | -7.96 | 12,473 | -2.10 | ||||
| 2025-07-29 | 13F | Stratos Wealth Partners, LTD. | 38,542 | -1.19 | 1,669 | 5.10 | ||||
| 2025-08-12 | 13F | Gladstone Institutional Advisory LLC | 30,875 | 7.36 | 1,337 | 14.19 | ||||
| 2025-08-14 | 13F | Colony Group, LLC | 419,499 | 6.44 | 18,160 | 13.22 | ||||
| 2025-06-02 | 13F/A | Modern Wealth Management, LLC | 6,767 | -19.39 | 275 | -28.39 | ||||
| 2025-08-12 | 13F | LPL Financial LLC | 2,706,243 | -14.49 | 117,153 | -9.05 | ||||
| 2025-07-31 | 13F | Cambridge Investment Research Advisors, Inc. | 123,935 | -27.45 | 5 | -16.67 | ||||
| 2025-08-13 | 13F | Russell Investments Group, Ltd. | 210 | -47.37 | 9 | -43.75 | ||||
| 2025-08-14 | 13F | Hrt Financial Lp | 24,567 | 1 | ||||||
| 2025-08-13 | 13F | Northwestern Mutual Wealth Management Co | 396,365 | 13.21 | 17,159 | 20.42 | ||||
| 2025-08-14 | 13F | Potentia Wealth | 0 | -100.00 | 0 | |||||
| 2025-07-14 | 13F | UMA Financial Services, Inc. | 6 | 0.00 | 0 | |||||
| 2025-08-13 | 13F | MONECO Advisors, LLC | 76,246 | -4.22 | 3,301 | 1.88 | ||||
| 2025-08-14 | 13F | Arete Wealth Advisors, LLC | 0 | -100.00 | 0 | |||||
| 2025-07-31 | 13F | Glass Jacobson Investment Advisors llc | 0 | -100.00 | 0 | |||||
| 2025-08-05 | 13F | Bank Of Montreal /can/ | 6,825 | 8.75 | 295 | 15.69 | ||||
| 2025-08-15 | 13F | Kestra Advisory Services, LLC | 34,195 | -12.48 | 1,480 | -6.92 | ||||
| 2025-08-04 | 13F | IFG Advisory, LLC | 23,080 | -65.28 | 999 | -63.07 | ||||
| 2025-08-14 | 13F | Bank Of America Corp /de/ | 1,190,231 | 5.53 | 51,525 | 12.25 | ||||
| 2025-08-14 | 13F | Two Sigma Investments, Lp | 0 | -100.00 | 0 | |||||
| 2025-08-14 | 13F | Stifel Financial Corp | 20,845 | -3.65 | 902 | 2.50 | ||||
| 2025-08-13 | 13F | Proactive Wealth Strategies LLC | 6,230 | -0.61 | 0 | |||||
| 2025-05-06 | 13F | Assetmark, Inc | 0 | -100.00 | 0 | |||||
| 2025-08-14 | 13F | Mariner, LLC | 76,515 | -1.34 | 3,312 | 4.94 | ||||
| 2025-08-13 | 13F | Rsm Us Wealth Management Llc | 0 | -100.00 | 0 | |||||
| 2025-08-13 | 13F | Alerus Financial Na | 310 | 13 | ||||||
| 2025-07-22 | 13F | Miracle Mile Advisors, LLC | 5,253 | 3.94 | 227 | 10.73 | ||||
| 2025-07-07 | 13F | Nova Wealth Management, Inc. | 2,100 | 481.72 | 91 | 542.86 | ||||
| 2025-08-05 | 13F | Key FInancial Inc | 6,686 | 289 | ||||||
| 2025-08-14 | 13F | Ameriprise Financial Inc | 1,792,940 | -33.91 | 77,673 | -29.65 | ||||
| 2025-08-08 | 13F | Cetera Investment Advisers | 184,564 | 4.25 | 7,990 | 10.88 | ||||
| 2025-08-12 | 13F | Global Retirement Partners, LLC | 19,428 | 2.18 | 841 | -3.33 | ||||
| 2025-07-24 | 13F | Edge Financial Advisors LLC | 28,648 | 10.06 | 1,246 | 17.56 | ||||
| 2025-08-04 | 13F | Creative Financial Designs Inc /adv | 1,948 | 0.00 | 84 | 6.33 | ||||
| 2025-08-08 | 13F | Citizens Financial Group Inc/ri | 21,450 | -3.17 | 929 | 3.00 | ||||
| 2025-05-12 | 13F | Maia Wealth LLC | 0 | -100.00 | 0 | |||||
| 2025-07-10 | 13F | SK Wealth Management, LLC | 121,756 | -22.40 | 5,513 | -3.69 | ||||
| 2025-08-11 | 13F | HighTower Advisors, LLC | 19,207 | -27.91 | 831 | -23.34 | ||||
| 2025-05-09 | 13F | Kickstand Ventures, Llc. | 0 | -100.00 | 0 | |||||
| 2025-08-19 | 13F | National Asset Management, Inc. | 0 | -100.00 | 0 | |||||
| 2025-05-22 | 13F | Wbi Investments, Inc. | 0 | -100.00 | 0 | |||||
| 2025-07-15 | 13F | World Equity Group, Inc. | 6,602 | -8.42 | 286 | -2.73 | ||||
| 2025-07-30 | 13F | Lionsbridge Wealth Management LLC | 0 | -100.00 | 0 | |||||
| 2025-08-14 | 13F | Byrne Financial Freedom, Llc | 19,841 | -4.15 | 859 | 1.90 | ||||
| 2025-08-14 | 13F | Mercer Global Advisors Inc /adv | 5,540 | -42.44 | 240 | -38.87 | ||||
| 2025-08-01 | 13F | Envestnet Asset Management Inc | 131,049 | -7.95 | 5,673 | -2.09 | ||||
| 2025-07-23 | 13F | Hall Capital Management Co Inc | 6,700 | 0.00 | 290 | 6.62 | ||||
| 2025-07-16 | 13F | New Insight Wealth Advisors | 11,686 | -14.75 | 506 | -9.34 | ||||
| 2025-08-01 | 13F | James Investment Research Inc | 45,001 | -10.54 | 1,948 | -4.84 | ||||
| 2025-07-31 | 13F | Curio Wealth, Llc | 5 | 400.00 | 0 | |||||
| 2025-07-30 | 13F | Klingman & Associates, LLC | 28,569 | 0.00 | 1,237 | 6.37 | ||||
| 2025-08-01 | 13F | First Command Advisory Services, Inc. | 3,567 | 0.00 | 154 | 6.21 | ||||
| 2025-04-29 | 13F | Investor's Fiduciary Advisor Network, LLC | 0 | -100.00 | 0 | |||||
| 2025-08-15 | 13F | Cornerstone Financial Group, LLC /NE/ | 7,312 | 0.26 | 317 | 3.27 | ||||
| 2025-07-09 | 13F | Bowman & Co S.C. | 23,173 | 0.05 | 1,003 | 6.48 | ||||
| 2025-07-09 | 13F | Fermata Advisors, LLC | 5,533 | -89.89 | 240 | -89.27 | ||||
| 2025-07-24 | 13F | Us Bancorp \de\ | 24,306 | -41.38 | 1,052 | -37.64 | ||||
| 2025-08-14 | 13F | Hilltop Holdings Inc. | 18,935 | 0.25 | 820 | 6.64 | ||||
| 2025-08-06 | 13F | Financial Advisory Corp /ut/ /adv | 12,795 | 2.04 | 1 | |||||
| 2025-08-14 | 13F | D. E. Shaw & Co., Inc. | 0 | -100.00 | 0 | |||||
| 2025-08-05 | 13F | Claro Advisors LLC | 15,687 | -1.22 | 679 | 5.11 | ||||
| 2025-08-12 | 13F | MAI Capital Management | 392,822 | 4.48 | 17,005 | 11.13 | ||||
| 2025-08-05 | 13F | GPS Wealth Strategies Group, LLC | 375 | 0.00 | 16 | 6.67 | ||||
| 2025-08-12 | 13F | O'shaughnessy Asset Management, Llc | 0 | -100.00 | 0 |