Mga Batayang Estadistika
| Pemilik Institusional | 269 total, 266 long only, 0 short only, 3 long/short - change of 5.08% MRQ |
| Alokasi Portofolio Rata-rata | 0.3223 % - change of -6.11% MRQ |
| Saham Institusional (Jangka Panjang) | 52,151,765 (ex 13D/G) - change of 1.12MM shares 2.19% MRQ |
| Nilai Institusional (Jangka Panjang) | $ 1,203,095 USD ($1000) |
Kepemilikan Institusional dan Pemegang Saham
Sixth Street Specialty Lending, Inc. (US:TSLX) memiliki 269 pemilik institusional dan pemegang saham yang telah mengajukan formulir 13D/G atau 13F kepada Komisi Bursa Efek (Securities Exchange Commission/SEC). Lembaga-lembaga ini memegang total 52,151,765 saham. Pemegang saham terbesar meliputi Strs Ohio, Sixth Street Partners Management Company, L.P., Progeny 3, Inc., Sound Income Strategies, LLC, Burgundy Asset Management Ltd., Van Eck Associates Corp, BIZD - VanEck Vectors BDC Income ETF, Morgan Stanley, Allen Investment Management LLC, and Ares Management Llc .
Struktur kepemilikan institusional Sixth Street Specialty Lending, Inc. (NYSE:TSLX) menunjukkan posisi terkini di perusahaan oleh institusi dan dana, serta perubahan terbaru dalam ukuran posisi. Pemegang saham utama dapat mencakup investor individu, reksa dana, dana lindung nilai, atau institusi. Jadwal 13D menunjukkan bahwa investor memegang (atau pernah memegang) lebih dari 5% saham perusahaan dan bermaksud (atau pernah bermaksud) untuk secara aktif mengejar perubahan strategi bisnis. Jadwal 13G menunjukkan investasi pasif lebih dari 5%.
The share price as of September 5, 2025 is 24.58 / share. Previously, on September 6, 2024, the share price was 21.20 / share. This represents an increase of 15.94% over that period.

Skor Sentimen Dana
Skor Sentimen Dana (sebelumnya dikenal sebagai Skor Akumulasi Kepemilikan) menemukan saham-saham yang paling banyak dibeli oleh dana. Ini adalah hasil dari model kuantitatif multi-faktor yang canggih yang mengidentifikasi perusahaan dengan tingkat akumulasi institusional tertinggi. Model penilaian menggunakan kombinasi dari total peningkatan pemilik yang diungkapkan, perubahan dalam alokasi portofolio pada pemilik tersebut, dan metrik lainnya. Angka berkisar dari 0 hingga 100, dengan angka yang lebih tinggi menunjukkan tingkat akumulasi yang lebih tinggi dibandingkan dengan perusahaan sejenisnya, dan 50 adalah rata-ratanya.
Frekuensi Pembaruan: Setiap Hari
Lihat Ownership Explorer, yang menyediakan daftar perusahaan dengan peringkat tertinggi.
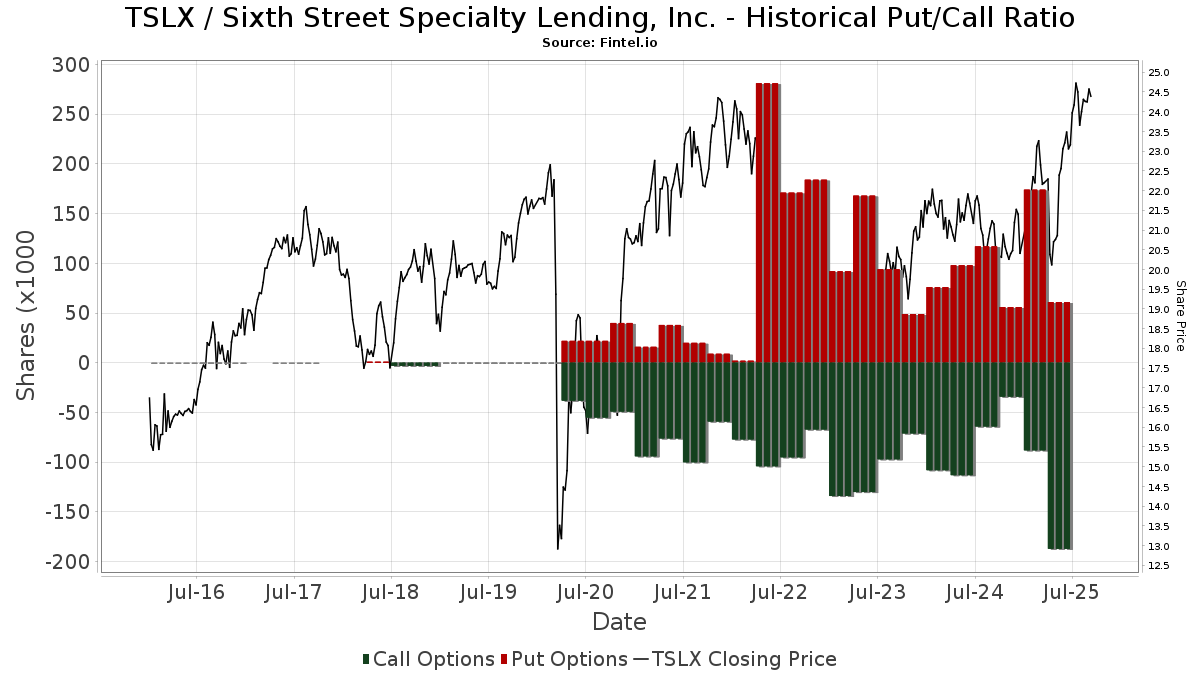
Rasio Put/Call Institusional
Selain melaporkan isu ekuitas dan utang standar, institusi dengan aset di bawah manajemen lebih dari 100 juta dolar AS juga harus mengungkapkan kepemilikan opsi put dan call mereka. Karena opsi put umumnya menunjukkan sentimen negatif, dan opsi call menunjukkan sentimen positif, kita dapat mengetahui sentimen institusional secara keseluruhan dengan memplot rasio put terhadap call. Grafik di sebelah kanan memplot rasio put/call historis untuk instrumen ini.
Menggunakan Rasio Put/Call sebagai indikator sentimen investor mengatasi salah satu kekurangan utama dari penggunaan total kepemilikan institusional, yaitu sejumlah besar aset yang dikelola diinvestasikan secara pasif untuk melacak indeks. Dana yang dikelola secara pasif biasanya tidak membeli opsi, sehingga indikator rasio put/call lebih akurat dalam melacak sentimen dana yang dikelola secara aktif.
Pengajuan 13F dan NPORT
Detail pada pengajuan 13F tersedia gratis. Detail pada pengajuan NP memerlukan keanggotaan premium. Baris berwarna hijau menunjukkan posisi baru. Baris berwarna merah menunjukkan posisi yang sudah ditutup. Klik tautan ini ikon untuk melihat riwayat transaksi selengkapnya.
Tingkatkan
untuk membuka data premium dan mengekspor ke Excel ![]() .
.
| Tanggal File | Sumber | Investor | Ketik | Presyo ng Avg (Silangan) |
Saham | Δ Saham (%) |
Dilaporkan Nilai ($1000) |
Nilai Δ (%) |
Alokasi Port (%) |
|
|---|---|---|---|---|---|---|---|---|---|---|
| 2025-08-11 | 13F | EMC Capital Management | 6,120 | -9.29 | 0 | |||||
| 2025-08-01 | 13F | Rossby Financial, LCC | 2,983 | 0.10 | 71 | 14.52 | ||||
| 2025-08-28 | NP | SVOAX - Simt Us Managed Volatility Fund Class F | 38,650 | -38.99 | 920 | -35.07 | ||||
| 2025-05-05 | 13F | Transce3nd, LLC | 0 | -100.00 | 0 | |||||
| 2025-08-04 | 13F | Muzinich & Co., Inc. | 608,616 | 35.21 | 14,491 | 43.85 | ||||
| 2025-08-14 | 13F | Two Sigma Investments, Lp | 512,747 | 17.61 | 12,209 | 25.13 | ||||
| 2025-08-15 | 13F | Northeast Financial Consultants Inc | 26,000 | 0.00 | 619 | 6.54 | ||||
| 2025-08-07 | 13F | ProShare Advisors LLC | 19,159 | -3.69 | 456 | 2.47 | ||||
| 2025-08-14 | 13F | Prelude Capital Management, Llc | 98,843 | 0.00 | 2,353 | 6.37 | ||||
| 2025-08-05 | 13F | Huntington National Bank | 1,001 | 0.00 | 24 | 4.55 | ||||
| 2025-08-13 | 13F | Northern Trust Corp | 84,292 | 52.37 | 2,007 | 62.04 | ||||
| 2025-07-17 | 13F | HB Wealth Management, LLC | 76,206 | -4.27 | 1,814 | 1.85 | ||||
| 2025-08-27 | 13F/A | Squarepoint Ops LLC | 16,052 | 24.86 | 382 | 33.10 | ||||
| 2025-08-08 | 13F | Foundations Investment Advisors, LLC | 42,122 | 1,003 | ||||||
| 2025-08-14 | 13F | UBS Group AG | 1,186,011 | 35.43 | 28,239 | 44.09 | ||||
| 2025-07-16 | 13F | Signaturefd, Llc | 4,659 | -8.70 | 111 | -3.51 | ||||
| 2025-05-01 | 13F | Country Club Bank /gfn | 0 | -100.00 | 0 | |||||
| 2025-05-14 | 13F | Virtus ETF Advisers LLC | 0 | -100.00 | 0 | |||||
| 2025-07-23 | 13F | Hager Investment Management Services, Llc | 55 | 1.85 | 1 | 0.00 | ||||
| 2025-08-06 | 13F | Round Rock Advisors, LLC | 281,184 | 2.44 | 6,695 | 8.99 | ||||
| 2025-08-07 | 13F | Rathbone Brothers plc | 0 | -100.00 | 0 | |||||
| 2025-07-23 | 13F | Ellsworth Advisors, LLC | 29,815 | 710 | ||||||
| 2025-08-15 | 13F | Tower Research Capital LLC (TRC) | 1,770 | -31.37 | 42 | -26.32 | ||||
| 2025-06-18 | NP | Putnam ETF Trust - Putnam BDC ETF - | 479,138 | 21.72 | 9,947 | 12.91 | ||||
| 2025-07-01 | 13F | Confluence Investment Management Llc | 288,066 | 14.58 | 6,859 | 21.90 | ||||
| 2025-07-18 | 13F | Trust Co Of Vermont | 1,584 | -13.63 | 38 | -9.76 | ||||
| 2025-08-13 | 13F | 1832 Asset Management L.P. | 395,347 | 12.96 | 9,413 | 20.17 | ||||
| 2025-08-14 | 13F | Alyeska Investment Group, L.P. | 189,491 | 4,512 | ||||||
| 2025-08-14 | 13F | Mariner, LLC | 38,629 | 13.16 | 920 | 20.45 | ||||
| 2025-08-14 | 13F | FJ Capital Management LLC | 0 | -100.00 | 0 | |||||
| 2025-07-29 | NP | SVYAX - SIIT U.S. Managed Volatility Fund - Class A | 104,200 | 0.00 | 2,427 | -0.94 | ||||
| 2025-08-07 | 13F | Allworth Financial LP | 334 | 1,570.00 | 8 | |||||
| 2025-08-14 | 13F | GWM Advisors LLC | 1,672 | 0.00 | 40 | 5.41 | ||||
| 2025-08-11 | 13F | Annis Gardner Whiting Capital Advisors, LLC | 5,235 | 0.00 | 125 | 5.98 | ||||
| 2025-08-15 | 13F | Morgan Stanley | 1,872,708 | 0.15 | 44,589 | 6.55 | ||||
| 2025-08-14 | 13F | Citadel Advisors Llc | Put | 17,300 | -24.78 | 412 | -20.04 | |||
| 2025-08-14 | 13F | Wetherby Asset Management Inc | 11,514 | 274 | ||||||
| 2025-07-11 | 13F | Farther Finance Advisors, LLC | 667 | 0.00 | 16 | 7.14 | ||||
| 2025-08-14 | 13F | Qube Research & Technologies Ltd | 50,774 | -76.82 | 1,209 | -75.36 | ||||
| 2025-08-14 | 13F | Citadel Advisors Llc | Call | 46,900 | 838.00 | 1,117 | 905.41 | |||
| 2025-07-10 | 13F | Security National Bank | 3,361 | 5.96 | 80 | 14.29 | ||||
| 2025-07-22 | 13F | Romano Brothers And Company | 25,200 | 46.51 | 601 | 56.51 | ||||
| 2025-08-11 | 13F | Greykasell Wealth Strategies, Inc. | 497 | -39.76 | 12 | -38.89 | ||||
| 2025-07-28 | NP | FXED - Sound Enhanced Fixed Income ETF | 52,635 | 1.12 | 1,226 | 0.16 | ||||
| 2025-07-29 | 13F | Private Trust Co Na | 600 | 0.00 | 14 | 7.69 | ||||
| 2025-08-14 | 13F | Citadel Advisors Llc | 74,279 | 176.23 | 1,769 | 194.18 | ||||
| 2025-08-12 | 13F | Virtu Financial LLC | 0 | -100.00 | 0 | |||||
| 2025-07-16 | 13F | Register Financial Advisors LLC | 7,665 | 0.24 | 183 | 6.43 | ||||
| 2025-08-08 | 13F | Pnc Financial Services Group, Inc. | 7,341 | 0.00 | 175 | 6.10 | ||||
| 2025-08-25 | 13F/A | Neuberger Berman Group LLC | 595,029 | -1.60 | 14,168 | 4.68 | ||||
| 2025-07-28 | 13F | Melia Wealth LLC | 614,916 | 3.56 | 14,641 | 10.18 | ||||
| 2025-08-13 | 13F | Lansforsakringar Fondforvaltning AB (publ) | 0 | -100.00 | 0 | |||||
| 2025-08-01 | 13F | Pasadena Private Wealth, LLC | 10,090 | -9.66 | 240 | -3.61 | ||||
| 2025-05-14 | 13F | Campbell & CO Investment Adviser LLC | 0 | -100.00 | 0 | |||||
| 2025-07-24 | 13F | Standard Life Aberdeen plc | 123,237 | -5.70 | 2,936 | 0.75 | ||||
| 2025-07-25 | 13F | Atria Wealth Solutions, Inc. | 8,570 | 204 | ||||||
| 2025-08-13 | 13F | Marshall Wace, Llp | 75,811 | 186.63 | 1,805 | 205.41 | ||||
| 2025-08-14 | 13F | Balyasny Asset Management Llc | 17,540 | 418 | ||||||
| 2025-08-11 | 13F | Lsv Asset Management | 1,055,562 | -10.33 | 25 | -3.85 | ||||
| 2025-08-12 | 13F | Franklin Resources Inc | 485,418 | 9.97 | 11,558 | 17.00 | ||||
| 2025-08-14 | 13F | Benjamin Edwards Inc | 211,976 | 3.40 | 5,047 | 10.00 | ||||
| 2025-08-20 | NP | LSPAX - LoCorr Spectrum Income Fund Class A | 29,829 | -48.40 | 710 | -45.09 | ||||
| 2025-08-14 | 13F | London & Capital Asset Management Ltd | 19,400 | 0.00 | 462 | 6.22 | ||||
| 2025-07-15 | 13F | Family Wealth Partners, Llc | 16,297 | 81.54 | 388 | 94.00 | ||||
| 2025-07-21 | 13F | Future Financial Wealth Managment LLC | 4,200 | 0.00 | 100 | 7.53 | ||||
| 2025-08-13 | 13F | Invesco Ltd. | 30,628 | 7.98 | 729 | 14.98 | ||||
| 2025-04-22 | 13F | Synergy Financial Management, LLC | 0 | -100.00 | 0 | |||||
| 2025-07-14 | 13F | GAMMA Investing LLC | 37 | 0.00 | 1 | |||||
| 2025-08-14 | 13F | DRW Securities, LLC | 25,122 | 598 | ||||||
| 2025-08-14 | 13F | Toroso Investments, LLC | 53,219 | 2.24 | 1,267 | 8.85 | ||||
| 2025-08-13 | 13F | Legacy Capital Wealth Partners, LLC | 61,987 | -3.10 | 1,476 | 3.07 | ||||
| 2025-08-13 | 13F | Texas Capital Bank Wealth Management Services Inc | 148,017 | 5.87 | 3,524 | 12.66 | ||||
| 2025-08-14 | 13F | Mercer Global Advisors Inc /adv | 8,733 | 208 | ||||||
| 2025-07-29 | 13F | Stableford Capital Ii Llc | 8,500 | 208 | ||||||
| 2025-08-04 | 13F | IFG Advisory, LLC | 20,608 | 14.31 | 491 | 21.59 | ||||
| 2025-08-13 | 13F | Advisory Research Inc | 10,564 | -1.55 | 252 | 4.58 | ||||
| 2025-08-13 | 13F | Wambolt & Associates, LLC | 146,586 | -8.68 | 3,487 | -3.14 | ||||
| 2025-07-18 | 13F | Generali Investments CEE, investicni spolecnost, a.s. | 24,084 | 4.50 | 573 | 11.26 | ||||
| 2025-07-25 | NP | First Trust Specialty Finance & Financial Opportunities Fund This fund is a listed as child fund of First Trust Advisors Lp and if that institution has disclosed ownership in this security, then these positions will not be double counted when calculating total shares and total value | 222,000 | 12.69 | 5,170 | 11.64 | ||||
| 2025-08-07 | 13F | Acadian Asset Management Llc | 1,297 | -9.55 | 0 | |||||
| 2025-06-30 | NP | PSP - Invesco Global Listed Private Equity ETF This fund is a listed as child fund of Invesco Ltd. and if that institution has disclosed ownership in this security, then these positions will not be double counted when calculating total shares and total value | 26,905 | -22.31 | 559 | -28.00 | ||||
| 2025-07-25 | 13F | Community Bank, N.A. | 1,000 | 0.00 | 24 | 4.55 | ||||
| 2025-08-14 | 13F | Wells Fargo & Company/mn | 1,241,039 | 3.07 | 29,549 | 9.66 | ||||
| 2025-08-26 | NP | NORTHERN FUNDS - NORTHERN SMALL CAP CORE FUND Class K | 10,068 | -5.54 | 240 | 0.42 | ||||
| 2025-08-11 | 13F | Universal- Beteiligungs- und Servicegesellschaft mbH | 150,543 | 0.00 | 3,584 | 6.41 | ||||
| 2025-07-15 | 13F | SJS Investment Consulting Inc. | 43 | 1 | ||||||
| 2025-08-13 | 13F | Brown Advisory Inc | 38,999 | -14.98 | 929 | -9.55 | ||||
| 2025-07-16 | 13F | Essex Financial Services, Inc. | 41,047 | 4.57 | 977 | 11.28 | ||||
| 2025-07-29 | NP | PPADX - GMO U.S. Opportunistic Value Fund Class III | 21,838 | 509 | ||||||
| 2025-07-08 | 13F | Parallel Advisors, LLC | 18,012 | -13.02 | 429 | -7.56 | ||||
| 2025-08-01 | 13F | Envestnet Asset Management Inc | 538,400 | 8.83 | 12,819 | 15.79 | ||||
| 2025-07-25 | 13F | Concurrent Investment Advisors, LLC | 11,138 | 265 | ||||||
| 2025-07-21 | 13F | Mirae Asset Global Investments Co., Ltd. | 15,050 | 66.87 | 358 | 78.11 | ||||
| 2025-08-08 | 13F | Tortoise Investment Management, LLC | Call | 500 | 0 | |||||
| 2025-07-28 | 13F | Frazier Financial Advisors, LLC | 4,814 | 0.00 | 115 | 6.54 | ||||
| 2025-08-14 | 13F | Stifel Financial Corp | 663,112 | -4.02 | 15,789 | 2.11 | ||||
| 2025-05-30 | NP | ERNZ - TrueShares Active Yield ETF | 13,535 | -93.77 | 303 | -93.47 | ||||
| 2025-08-13 | 13F | Delphi Financial Group, Inc. | 20,041 | -55.57 | 477 | -52.73 | ||||
| 2025-08-14 | 13F | Verition Fund Management LLC | 14,825 | 353 | ||||||
| 2025-06-26 | NP | LSVQX - LSV Small Cap Value Fund Institutional Class Shares | 90,000 | 0.00 | 1,868 | -7.25 | ||||
| 2025-08-14 | 13F | Federation des caisses Desjardins du Quebec | 4,000 | 0.00 | 95 | 6.74 | ||||
| 2025-08-14 | 13F | BI Asset Management Fondsmaeglerselskab A/S | 1,919 | 0.00 | 0 | |||||
| 2025-08-12 | 13F | Advisors Asset Management, Inc. | 206,077 | 16.24 | 4,907 | 23.67 | ||||
| 2025-08-14 | 13F | Two Sigma Advisers, Lp | 678,886 | -7.62 | 16,164 | -1.71 | ||||
| 2025-08-05 | 13F | Bank Of Montreal /can/ | 324,196 | 7,719 | ||||||
| 2025-08-13 | 13F | Russell Investments Group, Ltd. | 94 | -57.27 | 2 | -50.00 | ||||
| 2025-08-14 | 13F | Clayton Partners LLC | 137,140 | -9.62 | 3,265 | -3.83 | ||||
| 2025-07-01 | 13F | Harbor Investment Advisory, Llc | 219 | 2.34 | 5 | 25.00 | ||||
| 2025-05-15 | 13F | Centiva Capital, LP | 0 | -100.00 | 0 | -100.00 | ||||
| 2025-06-25 | NP | VPC - Virtus Private Credit Strategy ETF | 36,498 | -16.64 | 758 | -22.68 | ||||
| 2025-08-14 | 13F | Raymond James Financial Inc | 828,529 | -0.33 | 19,727 | 6.04 | ||||
| 2025-08-14 | 13F | Barnett & Company, Inc. | 36,750 | 22.30 | 875 | 30.21 | ||||
| 2025-08-11 | 13F | Private Advisor Group, LLC | 21,868 | 1.38 | 521 | 7.88 | ||||
| 2025-08-18 | 13F | Wolverine Trading, Llc | Put | 0 | -100.00 | 0 | ||||
| 2025-07-17 | 13F | LexAurum Advisors, LLC | 8,454 | 201 | ||||||
| 2025-08-05 | 13F | Simplex Trading, Llc | 0 | -100.00 | 0 | |||||
| 2025-07-16 | 13F | Eagle Global Advisors Llc | 14,150 | 0.00 | 337 | 6.33 | ||||
| 2025-07-11 | 13F | Mallini Complete Financial Planning LLC | 15,226 | 16.87 | 362 | 24.40 | ||||
| 2025-08-04 | 13F | Savvy Advisors, Inc. | 35,138 | 15.92 | 837 | 23.30 | ||||
| 2025-07-28 | 13F | Harbour Investments, Inc. | 178 | 0.00 | 4 | 33.33 | ||||
| 2025-07-16 | 13F | Magnus Financial Group LLC | 12,526 | -13.05 | 298 | -7.45 | ||||
| 2025-07-18 | 13F | Union Bancaire Privee, UBP SA | 19,319 | 5.09 | 65,559 | 15,851.09 | ||||
| 2025-08-14 | 13F | Susquehanna International Group, Llp | 14,726 | -60.82 | 351 | -58.38 | ||||
| 2025-08-12 | 13F | Argent Trust Co | 144,734 | 36.10 | 3,446 | 44.85 | ||||
| 2025-08-12 | 13F | CIBC Private Wealth Group, LLC | 2,144 | 0.00 | 51 | 24.39 | ||||
| 2025-08-14 | 13F | AllSquare Wealth Management LLC | 500 | 0.00 | 12 | 0.00 | ||||
| 2025-08-05 | 13F | Simplex Trading, Llc | Put | 100 | 0.00 | 0 | ||||
| 2025-08-14 | 13F | Susquehanna International Group, Llp | Call | 107,300 | 29.75 | 2,555 | 38.05 | |||
| 2025-08-05 | 13F | Simplex Trading, Llc | Call | 9,300 | 3,000.00 | 0 | ||||
| 2025-08-14 | 13F | FIL Ltd | 0 | -100.00 | 0 | |||||
| 2025-08-14 | 13F | Susquehanna International Group, Llp | Put | 44,000 | -64.80 | 1,048 | -62.57 | |||
| 2025-08-14 | 13F | Hrt Financial Lp | 190,316 | 185.61 | 5 | 300.00 | ||||
| 2025-07-30 | 13F | Principle Wealth Partners Llc | 11,701 | -11.02 | 279 | -5.44 | ||||
| 2025-08-11 | 13F | Nomura Asset Management Co Ltd | 6,588 | 157 | ||||||
| 2025-08-11 | 13F | Delta Asset Management Llc/tn | 250 | 0.00 | 6 | 0.00 | ||||
| 2025-07-29 | 13F | TrueMark Investments, LLC | 0 | -100.00 | 0 | |||||
| 2025-04-28 | 13F | Redmont Wealth Advisors Llc | 4,341 | 97 | ||||||
| 2025-08-14 | 13F | Millennium Management Llc | 0 | -100.00 | 0 | |||||
| 2025-08-14 | 13F | Bramshill Investments, LLC | 32,652 | -47.47 | 777 | -44.14 | ||||
| 2025-08-12 | 13F | Steward Partners Investment Advisory, Llc | 19,502 | 1.22 | 464 | 7.66 | ||||
| 2025-05-15 | 13F | Nebula Research & Development LLC | 0 | -100.00 | 0 | |||||
| 2025-08-12 | 13F | Trexquant Investment LP | 168,058 | 11.57 | 4,001 | 18.69 | ||||
| 2025-08-12 | 13F | BlackRock, Inc. | 696,005 | 16.84 | 16,572 | 24.30 | ||||
| 2025-08-07 | 13F | Allen Investment Management LLC | 1,557,126 | 8.52 | 37,075 | 15.45 | ||||
| 2025-08-14 | 13F | Parkwood LLC | 184,819 | 0.00 | 4 | 0.00 | ||||
| 2025-08-14 | 13F | Group One Trading, L.p. | Call | 11,100 | 264 | |||||
| 2025-08-06 | 13F | AE Wealth Management LLC | 9,361 | -13.84 | 223 | -8.64 | ||||
| 2025-06-26 | NP | LSVMX - LSV U.S. MANAGED VOLATILITY FUND Institutional Class Shares | 4,700 | 0.00 | 98 | -7.62 | ||||
| 2025-07-30 | NP | BIGTX - The Texas Fund Class I | 5,220 | 89.82 | 122 | 105.08 | ||||
| 2025-08-12 | 13F | Global Retirement Partners, LLC | 2,825 | -80.22 | 67 | -77.96 | ||||
| 2025-08-06 | 13F | Commonwealth Equity Services, Llc | 142,414 | 12.01 | 3 | 50.00 | ||||
| 2025-04-29 | 13F | Riggs Asset Managment Co. Inc. | 0 | -100.00 | 0 | |||||
| 2025-08-14 | 13F | Van Eck Associates Corp | 2,143,789 | -3.78 | 51 | 4.08 | ||||
| 2025-08-01 | 13F | First National Trust Co | 214,770 | 0.00 | 5,114 | 6.39 | ||||
| 2025-08-13 | 13F | Grantham, Mayo, Van Otterloo & Co. LLC | 67,700 | -7.02 | 1,612 | -1.10 | ||||
| 2025-07-18 | 13F | Bartlett & Co. Wealth Management Llc | 700 | 0.00 | 17 | 6.67 | ||||
| 2025-08-14 | 13F | Bank Of America Corp /de/ | 575,432 | -8.50 | 13,701 | -2.66 | ||||
| 2025-08-14 | 13F | Glenview Trust Co | 9,700 | 231 | ||||||
| 2025-07-24 | 13F | Wealthstar Advisors, Llc | 129,482 | -0.40 | 3,083 | 5.95 | ||||
| 2025-08-13 | 13F | Callodine Capital Management, LP | 1,064,824 | -0.02 | 25,353 | 6.36 | ||||
| 2025-07-29 | NP | GBFFX - GMO Benchmark-Free Fund Class III | 2,970 | 69 | ||||||
| 2025-08-13 | 13F | Lido Advisors, LLC | 52,996 | -23.25 | 1,262 | -18.38 | ||||
| 2025-08-14 | 13F | Diversify Advisory Services, LLC | 32,519 | 787 | ||||||
| 2025-08-15 | 13F | Provenance Wealth Advisors, LLC | 100 | 0.00 | 2 | 0.00 | ||||
| 2025-07-21 | 13F | Ameriflex Group, Inc. | 0 | -100.00 | 0 | |||||
| 2025-07-25 | 13F | We Are One Seven, LLC | 427,840 | 3.05 | 10,187 | 9.63 | ||||
| 2025-08-14 | 13F | Glen Eagle Advisors, LLC | 100 | 0.00 | 2 | 0.00 | ||||
| 2025-08-14 | 13F | Sargent Investment Group, LLC | 28,400 | 0.00 | 682 | 7.24 | ||||
| 2025-08-14 | 13F | Comerica Bank | 9,280 | 12.42 | 221 | 19.57 | ||||
| 2025-08-07 | 13F | Hennion & Walsh Asset Management, Inc. | 63,911 | -38.55 | 1,522 | -34.64 | ||||
| 2025-08-15 | 13F | CI Private Wealth, LLC | 113,162 | 181.73 | 2,694 | 200.00 | ||||
| 2025-09-04 | 13F/A | Advisor Group Holdings, Inc. | 40,339 | -4.92 | 961 | 1.16 | ||||
| 2025-07-17 | 13F | Sound Income Strategies, LLC | 2,406,296 | 1.91 | 57,294 | 8.42 | ||||
| 2025-07-14 | 13F | AdvisorNet Financial, Inc | 2,000 | 11.11 | 48 | 17.50 | ||||
| 2025-07-25 | 13F | Cwm, Llc | 64,376 | 7,857.48 | 2 | |||||
| 2025-07-07 | 13F | First Community Trust Na | 1,040 | 0.00 | 25 | 4.35 | ||||
| 2025-07-22 | 13F | Valley National Advisers Inc | 500 | 0 | ||||||
| 2025-07-24 | 13F | IFP Advisors, Inc | 70,817 | -42.45 | 1,686 | -38.76 | ||||
| 2025-08-11 | 13F | HighTower Advisors, LLC | 47,667 | 9.70 | 1,135 | 16.67 | ||||
| 2025-07-30 | 13F | Cullen/frost Bankers, Inc. | 0 | -100.00 | 0 | |||||
| 2025-05-15 | 13F | Quarry LP | 0 | -100.00 | 0 | |||||
| 2025-07-31 | 13F | Sumitomo Mitsui Trust Holdings, Inc. | 527,107 | 21.01 | 12,550 | 28.74 | ||||
| 2025-07-10 | 13F | Worth Asset Management, LLC | 14,322 | 0.10 | 341 | 6.56 | ||||
| 2025-08-14 | 13F | Principal Street Partners, LLC | 14,570 | -4.65 | 347 | 1.47 | ||||
| 2025-08-14 | 13F | Bnp Paribas Arbitrage, Sa | 93,065 | 16.48 | 2,216 | 23.88 | ||||
| 2025-07-28 | NP | PEX - ProShares Global Listed Private Equity ETF | 20,431 | 1.50 | 476 | 0.42 | ||||
| 2025-08-05 | 13F | Bank of New York Mellon Corp | 12,595 | 5.85 | 300 | 12.41 | ||||
| 2025-08-15 | 13F | Kestra Advisory Services, LLC | 39,024 | -17.62 | 929 | -12.36 | ||||
| 2025-08-12 | 13F | Heritage Trust Co | 15,580 | 371 | ||||||
| 2025-08-12 | 13F | Waterloo Capital, L.P. | 103,773 | 7.64 | 2,471 | 14.51 | ||||
| 2025-07-29 | NP | SLPAX - Siit Small Cap Fund - Class A | 12,300 | 0.00 | 286 | -1.04 | ||||
| 2025-08-06 | 13F | Ethos Financial Group, LLC | 29,811 | -26.19 | 710 | -21.48 | ||||
| 2025-07-28 | 13F | Naviter Wealth, LLC | 137,708 | 19.01 | 3,279 | 24.31 | ||||
| 2025-08-11 | 13F | Platform Technology Partners | 27,945 | -4.90 | 665 | 1.22 | ||||
| 2025-08-14 | 13F | Evergreen Capital Management Llc | 16,513 | -4.37 | 393 | 1.81 | ||||
| 2025-08-08 | 13F | MTM Investment Management, LLC | 2,040 | 49 | ||||||
| 2025-07-17 | 13F | Beacon Capital Management, LLC | 1,204 | 2.29 | 29 | 7.69 | ||||
| 2025-08-18 | 13F | Geneos Wealth Management Inc. | 1,746 | 0.00 | 42 | 5.13 | ||||
| 2025-08-11 | 13F | Brown Brothers Harriman & Co | 100 | 2 | ||||||
| 2025-08-05 | 13F | Westside Investment Management, Inc. | 286 | 7 | ||||||
| 2025-08-12 | 13F | Legal & General Group Plc | 622,774 | 0.14 | 14,822 | 6.57 | ||||
| 2025-07-09 | 13F | Inspirion Wealth Advisors, Llc | 15,426 | 0.00 | 367 | 6.38 | ||||
| 2025-07-11 | 13F | SILVER OAK SECURITIES, Inc | 19,955 | 145.57 | 475 | 162.43 | ||||
| 2025-08-15 | 13F | WealthCollab, LLC | 225 | -43.47 | 5 | -37.50 | ||||
| 2025-08-11 | 13F | Nations Financial Group Inc, /ia/ /adv | 35,508 | -2.42 | 845 | 3.81 | ||||
| 2025-08-14 | 13F | Fmr Llc | 34 | 0.00 | 1 | |||||
| 2025-08-12 | 13F | Cornerstone Wealth Management, LLC | 46,666 | -0.14 | 1,111 | 6.32 | ||||
| 2025-08-13 | 13F | Burgundy Asset Management Ltd. | 2,378,968 | 1.36 | 56,643 | 7.84 | ||||
| 2025-08-08 | 13F | Larson Financial Group LLC | 161 | 1.90 | 4 | 0.00 | ||||
| 2025-08-13 | 13F | Northwestern Mutual Wealth Management Co | 83 | -82.23 | 2 | -90.00 | ||||
| 2025-08-14 | 13F | Jane Street Group, Llc | 52,974 | 1,261 | ||||||
| 2025-08-08 | 13F | Creative Planning | 38,717 | -3.54 | 922 | 2.56 | ||||
| 2025-08-14 | 13F | Jane Street Group, Llc | Call | 12,200 | 290 | |||||
| 2025-05-05 | 13F | Lindbrook Capital, Llc | 260 | 61.49 | 6 | 66.67 | ||||
| 2025-08-14 | 13F | Dearborn Partners Llc | 63,576 | 0.27 | 1,514 | 6.62 | ||||
| 2025-08-13 | 13F | ExodusPoint Capital Management, LP | 0 | -100.00 | 0 | |||||
| 2025-08-13 | 13F | Whalerock Point Partners, Llc | 13,200 | 24.24 | 314 | 32.49 | ||||
| 2025-07-09 | 13F | Pallas Capital Advisors LLC | 48,778 | -9.64 | 1,161 | -3.89 | ||||
| 2025-07-30 | 13F | Denali Advisors Llc | 198,685 | -2.34 | 4,731 | 3.91 | ||||
| 2025-08-08 | 13F | Cetera Investment Advisers | 494,410 | 10.14 | 11,772 | 17.17 | ||||
| 2025-08-13 | 13F | SCS Capital Management LLC | 622,522 | 2.86 | 14,822 | 9.43 | ||||
| 2025-08-21 | NP | BIZD - VanEck Vectors BDC Income ETF | 1,873,346 | -9.19 | 44,604 | -3.39 | ||||
| 2025-06-27 | NP | LBO - WHITEWOLF Publicly Listed Private Equity ETF | 6,624 | 14.29 | 138 | 6.20 | ||||
| 2025-08-04 | 13F | Strs Ohio | 3,176,606 | -10.80 | 75,635 | -5.10 | ||||
| 2025-08-08 | 13F | Marble Harbor Investment Counsel, LLC | 10,210 | -10.00 | 243 | -3.95 | ||||
| 2025-07-21 | 13F | Vaughan Nelson Investment Management, L.p. | 5,350 | 0.00 | 127 | |||||
| 2025-08-08 | 13F | Advisors Capital Management, LLC | 718,338 | 1.95 | 17,104 | 8.46 | ||||
| 2025-08-29 | NP | John Hancock Financial Opportunities Fund | 228,214 | 0.00 | 5,434 | 6.38 | ||||
| 2025-07-09 | 13F | Westmount Partners, LLC | 13,030 | 0.00 | 310 | 6.53 | ||||
| 2025-08-06 | 13F | Baillie Gifford & Co | 0 | -100.00 | 0 | -100.00 | ||||
| 2025-07-23 | 13F | PARK CIRCLE Co | 62,000 | 0.00 | 1,476 | 6.42 | ||||
| 2025-08-12 | 13F | MAI Capital Management | 4,264 | 83.48 | 102 | 94.23 | ||||
| 2025-08-13 | 13F | Virtus Investment Advisers, Inc. | 29,302 | -26.67 | 698 | -22.04 | ||||
| 2025-07-29 | 13F | Chicago Partners Investment Group LLC | 22,864 | 1.33 | 560 | 19.15 | ||||
| 2025-08-08 | 13F | Alberta Investment Management Corp | 0 | -100.00 | 0 | |||||
| 2025-08-14 | 13F | Royal Bank Of Canada | 141,477 | 13.87 | 3,369 | 21.19 | ||||
| 2025-08-12 | 13F | LPL Financial LLC | 609,227 | 0.94 | 14,506 | 7.39 | ||||
| 2025-08-13 | 13F | Jones Financial Companies Lllp | 604 | 0.00 | 14 | 7.69 | ||||
| 2025-05-16 | 13F | Coppell Advisory Solutions LLC | 0 | -100.00 | 0 | |||||
| 2025-07-16 | 13F | Dakota Wealth Management | 39,220 | 8.27 | 934 | 15.19 | ||||
| 2025-08-12 | 13F | Proequities, Inc. | Call | 0 | 0 | |||||
| 2025-08-13 | 13F | EverSource Wealth Advisors, LLC | 1,061 | 0.00 | 25 | 8.70 | ||||
| 2025-08-12 | 13F | Proequities, Inc. | 0 | 0 | ||||||
| 2025-07-30 | 13F | D.a. Davidson & Co. | 179,702 | 3.56 | 4,279 | 10.17 | ||||
| 2025-05-15 | 13F | Brevan Howard Capital Management LP | 0 | -100.00 | 0 | |||||
| 2025-08-13 | 13F | Beacon Pointe Advisors, LLC | 49,612 | 58.49 | 1,181 | 68.71 | ||||
| 2025-07-24 | 13F | Robertson Stephens Wealth Management, LLC | 9,700 | 0.00 | 231 | 5.99 | ||||
| 2025-08-13 | 13F | Cerity Partners LLC | 422,634 | -4.82 | 10,063 | 1.26 | ||||
| 2025-08-13 | 13F | Guggenheim Capital Llc | 26,971 | 5.81 | 642 | 12.63 | ||||
| 2025-08-14 | 13F | Manufacturers Life Insurance Company, The | 230,586 | -0.88 | 5,490 | 5.46 | ||||
| 2025-08-13 | 13F | OMERS ADMINISTRATION Corp | 178,214 | 4,243 | ||||||
| 2025-07-09 | 13F | Mirador Capital Partners LP | 21,920 | 4.38 | 522 | 10.85 | ||||
| 2025-08-11 | 13F | Citigroup Inc | 0 | -100.00 | 0 | |||||
| 2025-07-31 | 13F | Buckingham Strategic Partners | 16,296 | 81.55 | 388 | 94.00 | ||||
| 2025-07-30 | 13F | Whittier Trust Co Of Nevada Inc | 9,575 | 0.00 | 228 | 6.07 | ||||
| 2025-08-11 | 13F | Core Wealth Partners LLC | 11,668 | 0.00 | 278 | 6.13 | ||||
| 2025-08-08 | 13F | Hartland & Co., LLC | 18,000 | 0.00 | 429 | 6.47 | ||||
| 2025-08-14 | 13F | Lazard Asset Management Llc | 32,266 | -38.05 | 1 | -100.00 | ||||
| 2025-08-07 | 13F | Evoke Wealth, Llc | 39,859 | 0.00 | 949 | 6.39 | ||||
| 2025-08-13 | 13F | Truvestments Capital Llc | 193,963 | -0.71 | 4,618 | 5.65 | ||||
| 2025-07-30 | 13F | Mid-American Wealth Advisory Group, Inc. | 189 | 4 | ||||||
| 2025-08-08 | 13F | Bouchey Financial Group Ltd | 30,252 | 0.00 | 720 | 6.35 | ||||
| 2025-04-30 | 13F | Stratos Wealth Advisors, LLC | 0 | -100.00 | 0 | |||||
| 2025-07-28 | 13F | RMR Capital Management, LLC | 190,495 | -21.68 | 4,536 | -16.68 | ||||
| 2025-07-23 | 13F | Columbus Macro, LLC | 437,561 | 12.40 | 10,418 | 19.60 | ||||
| 2025-08-13 | 13F | Natixis | 25,249 | 0.00 | 601 | 6.75 | ||||
| 2025-07-30 | 13F | Blume Capital Management, Inc. | 450 | 0.00 | 11 | 0.00 | ||||
| 2025-08-08 | 13F/A | Ignite Planners, LLC | 71,358 | 53.96 | 1,770 | 85.82 | ||||
| 2025-08-14 | 13F | Integrated Wealth Concepts LLC | 18,339 | 10.88 | 437 | 17.84 | ||||
| 2025-08-14 | 13F | Progeny 3, Inc. | 2,476,398 | 0.96 | 58,963 | 7.41 | ||||
| 2025-05-14 | 13F | Group One Trading, L.p. | 0 | -100.00 | 0 | -100.00 | ||||
| 2025-08-12 | 13F | Atlas Capital Advisors Llc | 5,115 | 0.00 | 122 | 6.14 | ||||
| 2025-07-07 | 13F | Thurston, Springer, Miller, Herd & Titak, Inc. | 200 | 0.00 | 5 | 0.00 | ||||
| 2025-08-28 | NP | SMVIX - Simt Small Cap Value Fund Class I | 4,848 | -71.11 | 115 | -69.33 | ||||
| 2025-08-07 | 13F | Merrion Investment Management Co, LLC | 25,000 | 0.00 | 595 | 6.44 | ||||
| 2025-08-14 | 13F | Ameriprise Financial Inc | 215,650 | 6.58 | 5,176 | 14.24 | ||||
| 2025-06-10 | 13F | Birchbrook, Inc. | 0 | -100.00 | 0 | -100.00 | ||||
| 2025-08-12 | 13F | Jpmorgan Chase & Co | 942,789 | 0.49 | 22,448 | 6.92 | ||||
| 2025-08-14 | 13F | State Street Corp | 89,663 | 257.76 | 2,135 | 281.07 | ||||
| 2025-07-22 | 13F | Grimes & Company, Inc. | 12,161 | 290 | ||||||
| 2025-08-13 | 13F | Barclays Plc | 0 | -100.00 | 0 | |||||
| 2025-08-13 | 13F | Quadrant Capital Group Llc | 0 | -100.00 | 0 | |||||
| 2025-07-10 | 13F | Peoples Bank/KS | 0 | -100.00 | 0 | |||||
| 2025-08-14 | 13F | Quantinno Capital Management LP | 58,035 | 1,382 | ||||||
| 2025-08-15 | 13F | Captrust Financial Advisors | 44,425 | -31.00 | 1,058 | -26.60 | ||||
| 2025-08-13 | 13F | Plan Group Financial, LLC | 51,428 | 32.13 | 1,224 | 40.53 | ||||
| 2025-05-14 | 13F | Caitlin John, LLC | 0 | -100.00 | 0 | |||||
| 2025-07-29 | NP | GIMFX - GMO Implementation Fund | 6,729 | 157 | ||||||
| 2025-08-06 | 13F | First Horizon Advisors, Inc. | 4,123 | 73.97 | 98 | 84.91 | ||||
| 2025-08-12 | 13F | XTX Topco Ltd | 51,926 | 1,236 | ||||||
| 2025-07-15 | 13F | Riverbridge Partners Llc | 48,835 | 3.37 | 1,163 | 9.93 | ||||
| 2025-05-14 | 13F | Group One Trading, L.p. | Put | 0 | -100.00 | 0 | -100.00 | |||
| 2025-07-28 | 13F | BRYN MAWR TRUST Co | 31,070 | 0.00 | 740 | 6.33 | ||||
| 2025-08-14 | 13F | Ares Management Llc | 1,402,689 | 2.19 | 33,398 | 8.72 | ||||
| 2025-08-14 | 13F | Goldman Sachs Group Inc | 347,494 | 336.55 | 8,274 | 364.51 | ||||
| 2025-07-17 | 13F | Janney Montgomery Scott LLC | 264,827 | -4.34 | 6 | 0.00 | ||||
| 2025-07-18 | 13F | SOA Wealth Advisors, LLC. | 0 | -100.00 | 0 | |||||
| 2025-08-14 | 13F | IHT Wealth Management, LLC | 105,149 | 6.64 | 2,504 | 13.46 | ||||
| 2025-07-29 | 13F | Stratos Wealth Partners, LTD. | 9,484 | 0.32 | 226 | 6.64 | ||||
| 2025-07-09 | 13F | Gilman Hill Asset Management, LLC | 465,241 | 4.09 | 11,077 | 10.74 | ||||
| 2025-08-14 | 13F/A | Rockefeller Capital Management L.P. | 207,112 | 7.31 | 4,931 | 14.17 | ||||
| 2025-08-04 | 13F | Canton Hathaway, LLC | 47,430 | -1.66 | 1 | 0.00 | ||||
| 2025-07-22 | 13F | Sage Investment Counsel LLC | 26,277 | 0.00 | 626 | 6.29 | ||||
| 2025-08-13 | 13F | Cresset Asset Management, LLC | 303,843 | -0.12 | 7,235 | 6.26 | ||||
| 2025-08-12 | 13F | Sixth Street Partners Management Company, L.P. | 2,714,226 | 0.00 | 64,626 | 6.39 | ||||
| 2025-08-15 | 13F | Great West Life Assurance Co /can/ | 136,054 | 2.59 | 3 | 50.00 | ||||
| 2025-08-21 | NP | MOFTX - Mercer Opportunistic Fixed Income Fund Class I | 30,000 | 714 | ||||||
| 2025-08-26 | NP | GMOV - GMO U.S. Value ETF | 2,345 | -1.64 | 56 | 3.77 | ||||
| 2025-08-06 | 13F | Texas Yale Capital Corp. | 35,500 | 1.43 | 845 | 7.92 | ||||
| 2025-07-24 | 13F | Us Bancorp \de\ | 25,113 | 0.00 | 598 | 6.23 | ||||
| 2025-08-08 | 13F | Lgt Capital Partners Ltd. | 336,500 | -14.81 | 8,012 | -9.37 | ||||
| 2025-08-12 | 13F | Financial Advocates Investment Management | 0 | -100.00 | 0 | |||||
| 2025-08-14 | 13F | D. E. Shaw & Co., Inc. | 24,606 | 586 | ||||||
| 2025-08-12 | 13F | Proequities, Inc. | Put | 0 | 0 | |||||
| 2025-08-14 | 13F | Boston Private Wealth Llc | 0 | -100.00 | 0 |