Mga Batayang Estadistika
| Pemilik Institusional | 161 total, 161 long only, 0 short only, 0 long/short - change of 6.62% MRQ |
| Alokasi Portofolio Rata-rata | 0.0698 % - change of 5.46% MRQ |
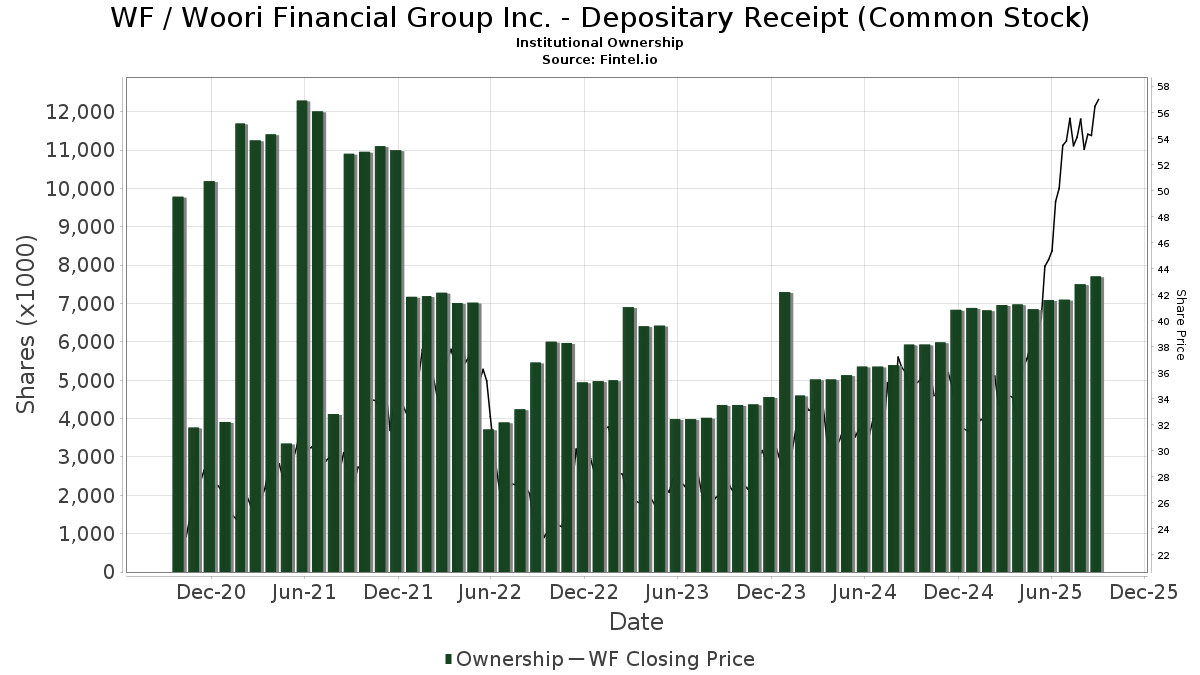
| Saham Institusional (Jangka Panjang) | 7,708,767 (ex 13D/G) - change of 0.62MM shares 8.72% MRQ |
| Nilai Institusional (Jangka Panjang) | $ 355,180 USD ($1000) |
Kepemilikan Institusional dan Pemegang Saham
Woori Financial Group Inc. - Depositary Receipt (Common Stock) (US:WF) memiliki 161 pemilik institusional dan pemegang saham yang telah mengajukan formulir 13D/G atau 13F kepada Komisi Bursa Efek (Securities Exchange Commission/SEC). Lembaga-lembaga ini memegang total 7,708,767 saham. Pemegang saham terbesar meliputi BlackRock, Inc., Morgan Stanley, Connor, Clark & Lunn Investment Management Ltd., Valeo Financial Advisors, LLC, Arrowstreet Capital, Limited Partnership, Creative Planning, Acadian Asset Management Llc, Vident Advisory, LLC, Ethic Inc., and JustInvest LLC .
Struktur kepemilikan institusional Woori Financial Group Inc. - Depositary Receipt (Common Stock) (NYSE:WF) menunjukkan posisi terkini di perusahaan oleh institusi dan dana, serta perubahan terbaru dalam ukuran posisi. Pemegang saham utama dapat mencakup investor individu, reksa dana, dana lindung nilai, atau institusi. Jadwal 13D menunjukkan bahwa investor memegang (atau pernah memegang) lebih dari 5% saham perusahaan dan bermaksud (atau pernah bermaksud) untuk secara aktif mengejar perubahan strategi bisnis. Jadwal 13G menunjukkan investasi pasif lebih dari 5%.
The share price as of September 5, 2025 is 52.91 / share. Previously, on September 6, 2024, the share price was 35.57 / share. This represents an increase of 48.75% over that period.
Skor Sentimen Dana
Skor Sentimen Dana (sebelumnya dikenal sebagai Skor Akumulasi Kepemilikan) menemukan saham-saham yang paling banyak dibeli oleh dana. Ini adalah hasil dari model kuantitatif multi-faktor yang canggih yang mengidentifikasi perusahaan dengan tingkat akumulasi institusional tertinggi. Model penilaian menggunakan kombinasi dari total peningkatan pemilik yang diungkapkan, perubahan dalam alokasi portofolio pada pemilik tersebut, dan metrik lainnya. Angka berkisar dari 0 hingga 100, dengan angka yang lebih tinggi menunjukkan tingkat akumulasi yang lebih tinggi dibandingkan dengan perusahaan sejenisnya, dan 50 adalah rata-ratanya.
Frekuensi Pembaruan: Setiap Hari
Lihat Ownership Explorer, yang menyediakan daftar perusahaan dengan peringkat tertinggi.
Rasio Put/Call Institusional
Selain melaporkan isu ekuitas dan utang standar, institusi dengan aset di bawah manajemen lebih dari 100 juta dolar AS juga harus mengungkapkan kepemilikan opsi put dan call mereka. Karena opsi put umumnya menunjukkan sentimen negatif, dan opsi call menunjukkan sentimen positif, kita dapat mengetahui sentimen institusional secara keseluruhan dengan memplot rasio put terhadap call. Grafik di sebelah kanan memplot rasio put/call historis untuk instrumen ini.
Menggunakan Rasio Put/Call sebagai indikator sentimen investor mengatasi salah satu kekurangan utama dari penggunaan total kepemilikan institusional, yaitu sejumlah besar aset yang dikelola diinvestasikan secara pasif untuk melacak indeks. Dana yang dikelola secara pasif biasanya tidak membeli opsi, sehingga indikator rasio put/call lebih akurat dalam melacak sentimen dana yang dikelola secara aktif.
Pengajuan 13F dan NPORT
Detail pada pengajuan 13F tersedia gratis. Detail pada pengajuan NP memerlukan keanggotaan premium. Baris berwarna hijau menunjukkan posisi baru. Baris berwarna merah menunjukkan posisi yang sudah ditutup. Klik tautan ini ikon untuk melihat riwayat transaksi selengkapnya.
Tingkatkan
untuk membuka data premium dan mengekspor ke Excel ![]() .
.
| Tanggal File | Sumber | Investor | Ketik | Presyo ng Avg (Silangan) |
Saham | Δ Saham (%) |
Dilaporkan Nilai ($1000) |
Nilai Δ (%) |
Alokasi Port (%) |
|
|---|---|---|---|---|---|---|---|---|---|---|
| 2025-07-14 | 13F | Abound Wealth Management | 30 | 0.00 | 1 | 0.00 | ||||
| 2025-08-05 | 13F | Bridgewater Advisors Inc. | 12,225 | 2.05 | 650 | 48.74 | ||||
| 2025-05-16 | 13F | Jones Financial Companies Lllp | 0 | -100.00 | 0 | |||||
| 2025-07-25 | 13F | JustInvest LLC | 100,704 | 27.95 | 5,008 | 90.64 | ||||
| 2025-08-04 | 13F | Hantz Financial Services, Inc. | 1,568 | 7,366.67 | 0 | |||||
| 2025-08-14 | 13F | Vident Advisory, LLC | 117,759 | 2.08 | 5,856 | 52.06 | ||||
| 2025-07-09 | 13F | Sivia Capital Partners, LLC | 9,229 | -7.54 | 459 | 37.54 | ||||
| 2025-08-12 | 13F | Proequities, Inc. | 0 | 0 | ||||||
| 2025-08-14 | 13F | Strategic Global Advisors, LLC | 12,792 | 0.00 | 636 | 49.30 | ||||
| 2025-07-25 | 13F | Sequoia Financial Advisors, LLC | 30,027 | 19.96 | 1,493 | 78.80 | ||||
| 2025-08-14 | 13F | Point72 Asset Management, L.P. | 0 | -100.00 | 0 | |||||
| 2025-08-14 | 13F | Granite FO LLC | 43 | 0.00 | 2 | 100.00 | ||||
| 2025-08-27 | NP | RMEAX - Aspiriant Risk-Managed Equity Allocation Fund Advisor Shares | 1 | 0.00 | 0 | |||||
| 2025-06-26 | NP | DFAX - Dimensional World ex U.S. Core Equity 2 ETF | 2,894 | 0.00 | 107 | 13.83 | ||||
| 2025-08-13 | 13F | Quadrant Capital Group Llc | 29,392 | -43.48 | 1,462 | -15.79 | ||||
| 2025-07-08 | 13F | Parallel Advisors, LLC | 14,709 | -0.12 | 731 | 48.88 | ||||
| 2025-08-12 | 13F | CIBC Private Wealth Group, LLC | 129 | -68.54 | 6 | -50.00 | ||||
| 2025-08-14 | 13F | Evergreen Capital Management Llc | 6,301 | 313 | ||||||
| 2025-08-13 | 13F | Victory Capital Management Inc | 36,615 | 0.00 | 1,821 | 48.94 | ||||
| 2025-08-13 | 13F | Arrowstreet Capital, Limited Partnership | 284,575 | -1.90 | 14,152 | 46.16 | ||||
| 2025-08-13 | 13F | Townsquare Capital Llc | 0 | -100.00 | 0 | |||||
| 2025-08-19 | 13F | Asset Dedication, LLC | 0 | -100.00 | 0 | |||||
| 2025-06-26 | NP | DFA INVESTMENT DIMENSIONS GROUP INC - Emerging Markets Social Core Equity Portfolio Shares | 291 | 0.00 | 11 | 11.11 | ||||
| 2025-09-04 | 13F/A | Advisor Group Holdings, Inc. | 1,042 | 51.90 | 51 | 131.82 | ||||
| 2025-08-12 | 13F | O'shaughnessy Asset Management, Llc | 89,110 | 3.11 | 4,431 | 53.64 | ||||
| 2025-07-22 | 13F | Valeo Financial Advisors, LLC | 363,718 | 388 | ||||||
| 2025-07-24 | 13F | Ramirez Asset Management, Inc. | 39,157 | -0.78 | 1,947 | 47.84 | ||||
| 2025-08-12 | 13F | MAI Capital Management | 4,327 | 215 | ||||||
| 2025-08-12 | 13F | Global Retirement Partners, LLC | 646 | -29.48 | 32 | 14.29 | ||||
| 2025-07-16 | 13F | Signaturefd, Llc | 43,212 | 2.10 | 2,149 | 52.12 | ||||
| 2025-08-12 | 13F | XTX Topco Ltd | 0 | -100.00 | 0 | |||||
| 2025-08-15 | 13F | Morgan Stanley | 1,511,459 | 8.24 | 75,165 | 61.26 | ||||
| 2025-05-08 | NP | QGBLX - Quantified Global Fund Investor Class | 15,723 | 1,425.02 | 525 | 1,537.50 | ||||
| 2025-08-12 | 13F | LPL Financial LLC | 7,163 | -45.48 | 356 | -18.72 | ||||
| 2025-08-14 | 13F | Quantinno Capital Management LP | 84,072 | 48.96 | 4,181 | 121.99 | ||||
| 2025-08-05 | 13F | Westside Investment Management, Inc. | 512 | 25 | ||||||
| 2025-08-14 | 13F | UBS Group AG | 22,613 | 843.78 | 1,125 | 1,322.78 | ||||
| 2025-07-24 | 13F | Ronald Blue Trust, Inc. | 11,549 | 30.44 | 574 | 94.58 | ||||
| 2025-08-14 | 13F | Royal Bank Of Canada | 3,429 | 187.19 | 171 | 327.50 | ||||
| 2025-06-23 | NP | UUPIX - Ultraemerging Markets Profund Investor Class | 884 | 6.38 | 33 | 18.52 | ||||
| 2025-07-21 | 13F | Qrg Capital Management, Inc. | 11,865 | 18.08 | 590 | 76.12 | ||||
| 2025-08-14 | 13F | Smartleaf Asset Management LLC | 984 | 551.66 | 48 | 860.00 | ||||
| 2025-06-26 | NP | DEXC - Dimensional Emerging Markets ex China Core Equity ETF | 6,385 | 10.56 | 237 | 25.53 | ||||
| 2025-05-01 | 13F | Schechter Investment Advisors, LLC | 8,780 | -26.34 | 293 | -21.24 | ||||
| 2025-08-14 | 13F | Ieq Capital, Llc | 9,185 | 41.16 | 457 | 110.14 | ||||
| 2025-08-14 | 13F | Atomi Financial Group, Inc. | 7,250 | 12.44 | 361 | 67.44 | ||||
| 2025-08-07 | 13F | Connor, Clark & Lunn Investment Management Ltd. | 494,930 | -8.46 | 24,613 | 36.38 | ||||
| 2025-08-11 | 13F | Brown Brothers Harriman & Co | 296 | 15 | ||||||
| 2025-08-13 | 13F | First Trust Advisors Lp | 21,729 | -5.18 | 1,081 | 41.36 | ||||
| 2025-07-11 | 13F/A | Umb Bank N A/mo | 527 | 0.00 | 26 | 52.94 | ||||
| 2025-07-28 | 13F | Ritholtz Wealth Management | 36,171 | 19.98 | 1,799 | 78.73 | ||||
| 2025-08-12 | 13F | Franklin Resources Inc | 6,507 | 5.89 | 324 | 57.56 | ||||
| 2025-08-14 | 13F | Fmr Llc | 36,011 | -0.14 | 1,791 | 48.79 | ||||
| 2025-08-04 | 13F | Assetmark, Inc | 17,172 | 1,593.49 | 854 | 2,484.85 | ||||
| 2025-08-06 | 13F | First Horizon Advisors, Inc. | 14 | 0.00 | 1 | |||||
| 2025-08-11 | 13F | Pinnacle Wealth Planning Services, Inc. | 5,109 | -41.74 | 254 | -13.01 | ||||
| 2025-08-11 | 13F | Frank, Rimerman Advisors LLC | 4,453 | 221 | ||||||
| 2025-08-14 | 13F | Bnp Paribas Arbitrage, Sa | 53,059 | 2.29 | 2,639 | 52.40 | ||||
| 2025-08-14 | 13F | Cubist Systematic Strategies, LLC | 0 | -100.00 | 0 | |||||
| 2025-06-26 | NP | DEHP - Dimensional Emerging Markets High Profitability ETF | 4,438 | -6.73 | 165 | 5.81 | ||||
| 2025-08-08 | 13F | SBI Securities Co., Ltd. | 226 | -47.44 | 11 | -21.43 | ||||
| 2025-08-07 | 13F | Parkside Financial Bank & Trust | 140 | 7 | ||||||
| 2025-06-26 | NP | DFA INVESTMENT DIMENSIONS GROUP INC - Emerging Markets Sustainability Core 1 Portfolio Institutional Class This fund is a listed as child fund of Dimensional Fund Advisors Lp and if that institution has disclosed ownership in this security, then these positions will not be double counted when calculating total shares and total value | 773 | 0.00 | 29 | 12.00 | ||||
| 2025-08-12 | 13F | Wayfinding Financial, LLC | 0 | -100.00 | 0 | |||||
| 2025-08-07 | 13F | Allworth Financial LP | 1,171 | 25.51 | 58 | 70.59 | ||||
| 2025-08-13 | 13F | Northern Trust Corp | 28,737 | 4.79 | 1,429 | 56.17 | ||||
| 2025-04-21 | 13F | Nelson, Van Denburg & Campbell Wealth Management Group, LLC | 0 | -100.00 | 0 | |||||
| 2025-08-04 | 13F | Simon Quick Advisors, Llc | 6,359 | 316 | ||||||
| 2025-08-14 | 13F | Mariner, LLC | 27,799 | 9.06 | 1,381 | 62.47 | ||||
| 2025-08-14 | 13F | Aqr Capital Management Llc | 38,041 | 88.67 | 1,892 | 180.98 | ||||
| 2025-08-18 | 13F | Geneos Wealth Management Inc. | 20 | 1 | ||||||
| 2025-07-22 | 13F | Miracle Mile Advisors, LLC | 10,778 | 4.37 | 536 | 55.52 | ||||
| 2025-07-25 | 13F | Cwm, Llc | 2,987 | -6.07 | 0 | |||||
| 2025-08-15 | 13F | CI Private Wealth, LLC | 34,876 | 71.40 | 1,734 | 155.38 | ||||
| 2025-05-05 | 13F | Lindbrook Capital, Llc | 5,566 | 3.50 | 186 | 10.12 | ||||
| 2025-07-15 | 13F | Public Employees Retirement System Of Ohio | 31,325 | -11.89 | 1,558 | 31.28 | ||||
| 2025-08-11 | 13F | Principal Securities, Inc. | 55 | -57.03 | 3 | -50.00 | ||||
| 2025-07-11 | 13F | Farther Finance Advisors, LLC | 949 | 1,255.71 | 47 | 2,250.00 | ||||
| 2025-08-14 | 13F | Ariadne Wealth Management, LP | 6,896 | 0.09 | 383 | 47.49 | ||||
| 2025-08-14 | 13F | Millennium Management Llc | 63,281 | -1.38 | 3,147 | 46.94 | ||||
| 2025-08-29 | NP | MPLAX - Praxis International Index Fund Class A | 34,279 | 0.00 | 1,705 | 48.95 | ||||
| 2025-08-14 | 13F | Verition Fund Management LLC | 0 | -100.00 | 0 | |||||
| 2025-07-14 | 13F | Foster Group, Inc. | 6,199 | -6.23 | 308 | 40.00 | ||||
| 2025-08-14 | 13F | Sei Investments Co | 65,522 | 1.19 | 3,258 | 50.76 | ||||
| 2025-08-05 | 13F | Advisors Preferred, LLC | 0 | -100.00 | 0 | |||||
| 2025-08-13 | 13F | EverSource Wealth Advisors, LLC | 7,058 | 0.92 | 351 | 50.21 | ||||
| 2025-07-24 | 13F | Jfs Wealth Advisors, Llc | 444 | 14.43 | 22 | 83.33 | ||||
| 2025-07-08 | 13F | Arlington Trust Co LLC | 219 | 0.00 | 11 | 42.86 | ||||
| 2025-07-24 | 13F | Us Bancorp \de\ | 41,310 | 9.10 | 2,054 | 62.63 | ||||
| 2025-08-12 | 13F | Pathstone Holdings, LLC | 21,850 | 27.49 | 1,087 | 89.86 | ||||
| 2025-08-12 | 13F | Coldstream Capital Management Inc | 10,373 | 577.53 | 516 | 909.80 | ||||
| 2025-08-08 | 13F | Geode Capital Management, Llc | 4,829 | 240 | ||||||
| 2025-08-14 | 13F/A | Skopos Labs, Inc. | 1,880 | 273.76 | 93 | 481.25 | ||||
| 2025-07-29 | NP | RBB FUND, INC. - Aquarius International Fund | 4,696 | 0.00 | 196 | 22.64 | ||||
| 2025-08-07 | 13F | Profund Advisors Llc | 5,160 | 257 | ||||||
| 2025-08-14 | 13F | Jane Street Group, Llc | 0 | -100.00 | 0 | |||||
| 2025-08-08 | 13F | Creative Planning | 261,811 | 25.83 | 13,020 | 87.46 | ||||
| 2025-08-14 | 13F | Wells Fargo & Company/mn | 483 | 24 | ||||||
| 2025-07-30 | 13F | Cullen/frost Bankers, Inc. | 0 | -100.00 | 0 | |||||
| 2025-05-16 | 13F | Coppell Advisory Solutions LLC | 0 | -100.00 | 0 | |||||
| 2025-06-26 | NP | DFEM - Dimensional Emerging Markets Core Equity 2 ETF | 11,270 | 0.00 | 418 | 13.32 | ||||
| 2025-08-14 | 13F | Goldman Sachs Group Inc | 41,848 | -19.79 | 2,081 | 19.53 | ||||
| 2025-08-01 | 13F | Envestnet Asset Management Inc | 8,143 | 8.57 | 405 | 61.60 | ||||
| 2025-07-28 | NP | NSI - National Security Emerging Markets Index ETF | 3,273 | 38.51 | 136 | 70.00 | ||||
| 2025-07-09 | 13F | Aaron Wealth Advisors LLC | 6,148 | 306 | ||||||
| 2025-08-11 | 13F | HighTower Advisors, LLC | 5,937 | -4.23 | 295 | 43.20 | ||||
| 2025-08-14 | 13F | Wetherby Asset Management Inc | 62,221 | 10.96 | 3,094 | 76.60 | ||||
| 2025-08-14 | 13F | Ancora Advisors, LLC | 150 | 0.00 | 7 | 40.00 | ||||
| 2025-08-04 | 13F | Spire Wealth Management | 0 | -100.00 | 0 | |||||
| 2025-07-30 | NP | APIE - ActivePassive International Equity ETF | 30,416 | 6.57 | 1,268 | 30.59 | ||||
| 2025-06-26 | NP | DFSE - Dimensional Emerging Markets Sustainability Core 1 ETF | 4,147 | 14.75 | 154 | 29.66 | ||||
| 2025-05-15 | 13F | CAPROCK Group, Inc. | 10,480 | -31.17 | 364 | -23.37 | ||||
| 2025-08-14 | 13F | Mercer Global Advisors Inc /adv | 8,583 | 4.94 | 427 | 56.04 | ||||
| 2025-07-14 | 13F | GAMMA Investing LLC | 3,894 | 59.52 | 194 | 138.27 | ||||
| 2025-08-13 | 13F | Guggenheim Capital Llc | 20,438 | 0.25 | 1,016 | 49.41 | ||||
| 2025-05-06 | 13F | Venturi Wealth Management, LLC | 0 | -100.00 | 0 | |||||
| 2025-08-05 | 13F | NewSquare Capital LLC | 380 | 155.03 | 19 | 350.00 | ||||
| 2025-08-14 | 13F | Ameriprise Financial Inc | 7,594 | -9.08 | 378 | 35.61 | ||||
| 2025-08-14 | 13F | Two Sigma Advisers, Lp | 0 | -100.00 | 0 | |||||
| 2025-07-23 | 13F | Optas, LLC | 0 | -100.00 | 0 | |||||
| 2025-08-13 | 13F | Bare Financial Services, Inc | 145 | 168.52 | 7 | 600.00 | ||||
| 2025-08-14 | 13F | Principal Street Partners, LLC | 6,900 | 343 | ||||||
| 2025-08-12 | 13F | SRS Capital Advisors, Inc. | 681 | 34 | ||||||
| 2025-08-15 | 13F | Tower Research Capital LLC (TRC) | 1,150 | 3,282.35 | 57 | 5,600.00 | ||||
| 2025-07-15 | 13F | Ballentine Partners, LLC | 40,994 | 23.48 | 2,039 | 83.94 | ||||
| 2025-08-11 | 13F | Citigroup Inc | 11,178 | 8.46 | 556 | 61.34 | ||||
| 2025-08-12 | 13F | BlackRock, Inc. | 2,057,241 | 7.33 | 102,307 | 59.91 | ||||
| 2025-08-14 | 13F | Bank Of America Corp /de/ | 98,209 | -27.97 | 4,884 | 7.30 | ||||
| 2025-08-27 | NP | RYWTX - Emerging Markets 2x Strategy Fund Class A | 1,172 | 154.23 | 58 | 286.67 | ||||
| 2025-07-28 | 13F | Ativo Capital Management LLC | 32,076 | -3.07 | 1,595 | 44.47 | ||||
| 2025-08-20 | NP | REMG - Emerging Markets Equity Active ETF | 2,485 | 124 | ||||||
| 2025-08-11 | 13F | B. Metzler seel. Sohn & Co. AG | 39,257 | 1.55 | 1,952 | 51.32 | ||||
| 2025-08-12 | 13F | Dimensional Fund Advisors Lp | 90,571 | 15.96 | 4,503 | 72.79 | ||||
| 2025-08-05 | 13F | Huntington National Bank | 9 | 0 | ||||||
| 2025-08-08 | 13F | Pnc Financial Services Group, Inc. | 19,055 | 13.70 | 948 | 69.41 | ||||
| 2025-08-13 | 13F | West Family Investments, Inc. | 17,614 | 42.85 | 876 | 112.90 | ||||
| 2025-07-24 | 13F | IFP Advisors, Inc | 99 | 37.50 | 5 | 100.00 | ||||
| 2025-08-13 | 13F | Russell Investments Group, Ltd. | 8,744 | 133.30 | 435 | 247.20 | ||||
| 2025-07-30 | 13F | Ethic Inc. | 105,012 | 9.15 | 5,150 | 57.99 | ||||
| 2025-05-02 | 13F | Cable Hill Partners, LLC | 8,813 | -8.59 | 327 | 8.31 | ||||
| 2025-07-16 | 13F | Highline Wealth Partners Llc | 91 | 62.50 | 5 | 300.00 | ||||
| 2025-08-15 | 13F | WealthCollab, LLC | 1,284 | 2.64 | 64 | 53.66 | ||||
| 2025-07-25 | 13F | Meritage Portfolio Management | 95,621 | -2.80 | 4,755 | 44.84 | ||||
| 2025-05-09 | 13F | R Squared Ltd | 0 | -100.00 | 0 | |||||
| 2025-07-14 | 13F | Abacus Wealth Partners, LLC | 7,469 | 0.21 | 371 | 49.60 | ||||
| 2025-08-14 | 13F | Lazard Asset Management Llc | 12,633 | 1 | ||||||
| 2025-08-26 | NP | Profunds - Profund Vp Emerging Markets | 3,760 | 14.01 | 187 | 69.09 | ||||
| 2025-07-30 | 13F | Drive Wealth Management, Llc | 4,811 | 239 | ||||||
| 2025-07-17 | 13F | Clean Yield Group | 100 | 0.00 | 5 | 33.33 | ||||
| 2025-08-12 | 13F | Trexquant Investment LP | 0 | -100.00 | 0 | |||||
| 2025-07-25 | 13F | Yousif Capital Management, Llc | 24,346 | 7.89 | 1,211 | 60.69 | ||||
| 2025-08-13 | 13F | Cerity Partners LLC | 66,279 | -2.82 | 3,296 | 44.82 | ||||
| 2025-08-13 | 13F | Marshall Wace, Llp | 0 | -100.00 | 0 | |||||
| 2025-08-12 | 13F | Rhumbline Advisers | 17,888 | -31.43 | 890 | 2.18 | ||||
| 2025-08-14 | 13F | Glenmede Investment Management, LP | 4,947 | 246 | ||||||
| 2025-06-26 | NP | DFAE - Dimensional Emerging Core Equity Market ETF | 31,007 | 45.81 | 1,149 | 65.32 | ||||
| 2025-07-18 | 13F | BSW Wealth Partners | 8,844 | 6.35 | 440 | 58.48 | ||||
| 2025-07-29 | 13F | Private Trust Co Na | 31 | 0.00 | 2 | 0.00 | ||||
| 2025-08-13 | 13F | Invesco Ltd. | 32,792 | -14.16 | 1,631 | 27.84 | ||||
| 2025-08-07 | 13F | Vise Technologies, Inc. | 15,057 | 749 | ||||||
| 2025-07-14 | 13F | UMA Financial Services, Inc. | 139 | 131.67 | 7 | 200.00 | ||||
| 2025-08-14 | 13F | Aprio Wealth Management, LLC | 11,420 | -1.57 | 568 | 46.51 | ||||
| 2025-07-28 | 13F | BRYN MAWR TRUST Co | 97 | 0.00 | 5 | 33.33 | ||||
| 2025-08-11 | 13F | Bell Investment Advisors, Inc | 357 | -22.39 | 18 | 13.33 | ||||
| 2025-08-07 | 13F | Acadian Asset Management Llc | 128,924 | 0.85 | 6 | 50.00 | ||||
| 2025-08-12 | 13F | Jpmorgan Chase & Co | 80,430 | 40.10 | 4,000 | 108.72 | ||||
| 2025-08-13 | 13F | Twin Peaks Wealth Advisors, LLC | 143 | 8 | ||||||
| 2025-08-13 | 13F | Natixis Advisors, L.p. | 25,050 | -6.08 | 1 | |||||
| 2025-08-14 | 13F | Two Sigma Investments, Lp | 12,458 | -56.02 | 620 | -34.50 | ||||
| 2025-08-13 | 13F | Northwestern Mutual Wealth Management Co | 172 | 9 | ||||||
| 2025-07-11 | 13F | Pinnacle Bancorp, Inc. | 65 | 3 | ||||||
| 2025-06-26 | NP | DFEV - Dimensional Emerging Markets Value ETF | 4,382 | -8.58 | 162 | 3.85 | ||||
| 2025-07-15 | 13F | Td Private Client Wealth Llc | 411 | 20.53 | 20 | 81.82 | ||||
| 2025-07-24 | 13F | PDS Planning, Inc | 13,440 | 1.36 | 668 | 51.13 | ||||
| 2025-08-08 | 13F | Crossmark Global Holdings, Inc. | 5,425 | 270 | ||||||
| 2025-07-23 | 13F | Canopy Partners, LLC | 6,071 | 0.58 | 302 | 49.75 | ||||
| 2025-07-29 | 13F | Wealthstream Advisors, Inc. | 5,224 | 260 | ||||||
| 2025-08-07 | 13F | Sierra Ocean, Llc | 298 | -2.30 | 15 | 40.00 | ||||
| 2025-07-08 | 13F | Rise Advisors, LLC | 28 | 833.33 | 1 | |||||
| 2025-08-13 | 13F | Renaissance Technologies Llc | 0 | -100.00 | 0 | |||||
| 2025-08-14 | 13F | Raymond James Financial Inc | 322 | 16 | ||||||
| 2025-07-17 | 13F | Greenleaf Trust | 7,102 | 0.98 | 353 | 50.85 | ||||
| 2025-07-17 | 13F | HB Wealth Management, LLC | 5,729 | 285 | ||||||
| 2025-04-21 | 13F | CWA Asset Management Group, LLC | 0 | -100.00 | 0 |
Other Listings
| DE:2WGA | € 44.20 |