Mga Batayang Estadistika
| Pemilik Institusional | 228 total, 225 long only, 0 short only, 3 long/short - change of 10.10% MRQ |
| Alokasi Portofolio Rata-rata | 0.1563 % - change of -38.34% MRQ |
| Saham Institusional (Jangka Panjang) | 2,123,434 (ex 13D/G) - change of 0.06MM shares 2.86% MRQ |
| Nilai Institusional (Jangka Panjang) | $ 510,549 USD ($1000) |
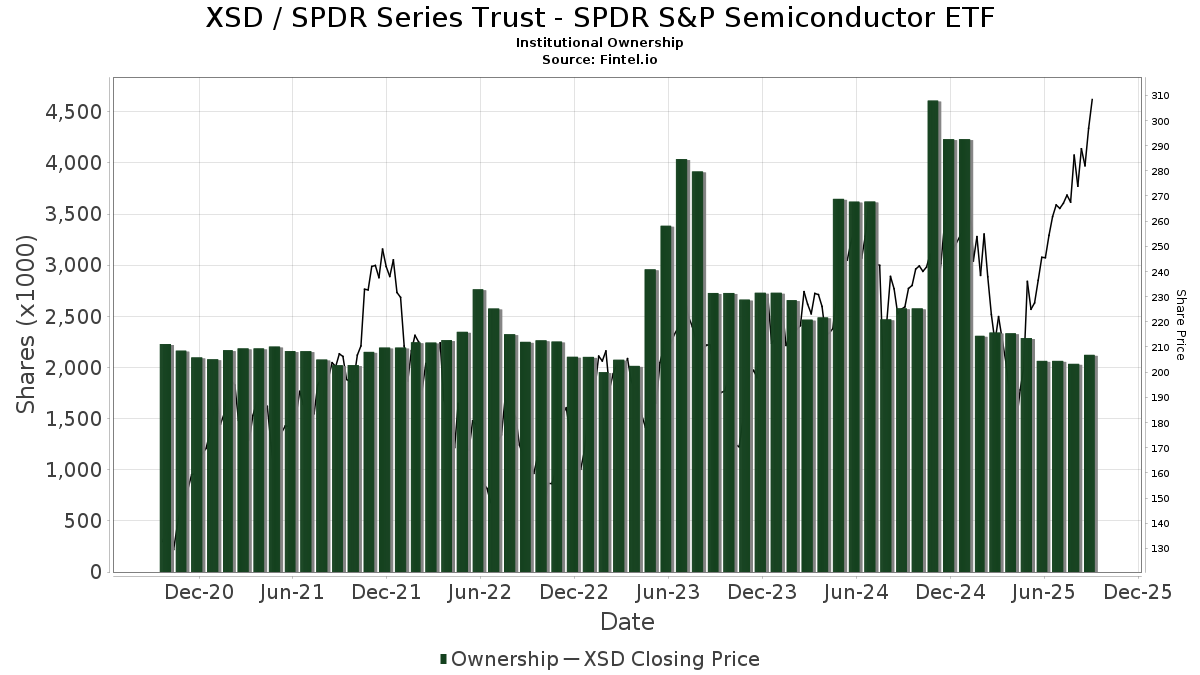
Kepemilikan Institusional dan Pemegang Saham
SPDR Series Trust - SPDR S&P Semiconductor ETF (US:XSD) memiliki 228 pemilik institusional dan pemegang saham yang telah mengajukan formulir 13D/G atau 13F kepada Komisi Bursa Efek (Securities Exchange Commission/SEC). Lembaga-lembaga ini memegang total 2,123,434 saham. Pemegang saham terbesar meliputi Morgan Stanley, LPL Financial LLC, Bank Of America Corp /de/, Ameriprise Financial Inc, Wells Fargo & Company/mn, Bnp Paribas Arbitrage, Sa, Pnc Financial Services Group, Inc., CoreCap Advisors, LLC, UBS Group AG, and Goldman Sachs Group Inc .
Struktur kepemilikan institusional SPDR Series Trust - SPDR S&P Semiconductor ETF (ARCA:XSD) menunjukkan posisi terkini di perusahaan oleh institusi dan dana, serta perubahan terbaru dalam ukuran posisi. Pemegang saham utama dapat mencakup investor individu, reksa dana, dana lindung nilai, atau institusi. Jadwal 13D menunjukkan bahwa investor memegang (atau pernah memegang) lebih dari 5% saham perusahaan dan bermaksud (atau pernah bermaksud) untuk secara aktif mengejar perubahan strategi bisnis. Jadwal 13G menunjukkan investasi pasif lebih dari 5%.
The share price as of September 5, 2025 is 289.62 / share. Previously, on September 9, 2024, the share price was 215.54 / share. This represents an increase of 34.37% over that period.
Skor Sentimen Dana
Skor Sentimen Dana (sebelumnya dikenal sebagai Skor Akumulasi Kepemilikan) menemukan saham-saham yang paling banyak dibeli oleh dana. Ini adalah hasil dari model kuantitatif multi-faktor yang canggih yang mengidentifikasi perusahaan dengan tingkat akumulasi institusional tertinggi. Model penilaian menggunakan kombinasi dari total peningkatan pemilik yang diungkapkan, perubahan dalam alokasi portofolio pada pemilik tersebut, dan metrik lainnya. Angka berkisar dari 0 hingga 100, dengan angka yang lebih tinggi menunjukkan tingkat akumulasi yang lebih tinggi dibandingkan dengan perusahaan sejenisnya, dan 50 adalah rata-ratanya.
Frekuensi Pembaruan: Setiap Hari
Lihat Ownership Explorer, yang menyediakan daftar perusahaan dengan peringkat tertinggi.
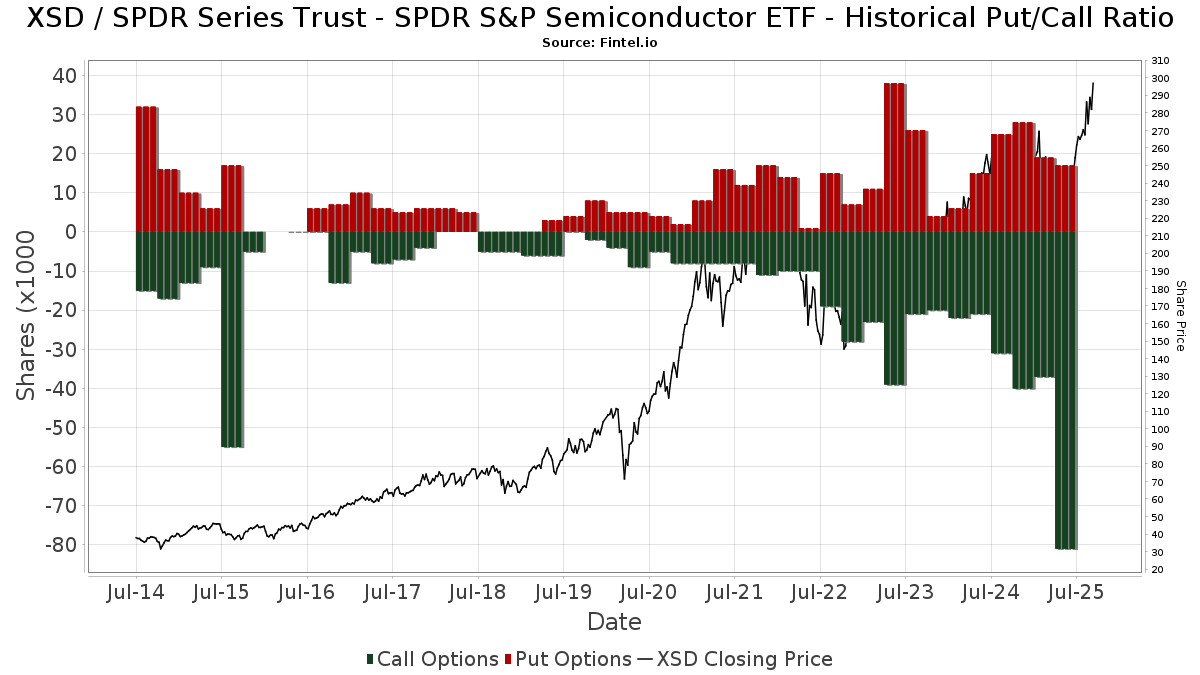
Rasio Put/Call Institusional
Selain melaporkan isu ekuitas dan utang standar, institusi dengan aset di bawah manajemen lebih dari 100 juta dolar AS juga harus mengungkapkan kepemilikan opsi put dan call mereka. Karena opsi put umumnya menunjukkan sentimen negatif, dan opsi call menunjukkan sentimen positif, kita dapat mengetahui sentimen institusional secara keseluruhan dengan memplot rasio put terhadap call. Grafik di sebelah kanan memplot rasio put/call historis untuk instrumen ini.
Menggunakan Rasio Put/Call sebagai indikator sentimen investor mengatasi salah satu kekurangan utama dari penggunaan total kepemilikan institusional, yaitu sejumlah besar aset yang dikelola diinvestasikan secara pasif untuk melacak indeks. Dana yang dikelola secara pasif biasanya tidak membeli opsi, sehingga indikator rasio put/call lebih akurat dalam melacak sentimen dana yang dikelola secara aktif.
Pengajuan 13F dan NPORT
Detail pada pengajuan 13F tersedia gratis. Detail pada pengajuan NP memerlukan keanggotaan premium. Baris berwarna hijau menunjukkan posisi baru. Baris berwarna merah menunjukkan posisi yang sudah ditutup. Klik tautan ini ikon untuk melihat riwayat transaksi selengkapnya.
Tingkatkan
untuk membuka data premium dan mengekspor ke Excel ![]() .
.
| Tanggal File | Sumber | Investor | Ketik | Presyo ng Avg (Silangan) |
Saham | Δ Saham (%) |
Dilaporkan Nilai ($1000) |
Nilai Δ (%) |
Alokasi Port (%) |
|
|---|---|---|---|---|---|---|---|---|---|---|
| 2025-08-12 | 13F | Steward Partners Investment Advisory, Llc | 3,981 | 23.86 | 1,021 | 58.29 | ||||
| 2025-07-17 | 13F | Fifth Third Securities, Inc. | 3,271 | 15.18 | 839 | 47.19 | ||||
| 2025-07-25 | 13F | Apollon Wealth Management, LLC | 4,131 | 0.07 | 1,060 | 27.90 | ||||
| 2025-08-12 | 13F | Cowa, Llc | 0 | -100.00 | 0 | |||||
| 2025-07-02 | 13F | Central Pacific Bank - Trust Division | 6 | 0.00 | 2 | 0.00 | ||||
| 2025-07-21 | 13F | DHJJ Financial Advisors, Ltd. | 2 | 0.00 | 1 | |||||
| 2025-08-12 | 13F | Putnam Fl Investment Management Co | 1,650 | -1.49 | 423 | 25.89 | ||||
| 2025-04-15 | 13F | Collier Financial | 404 | 0.00 | 81 | -19.00 | ||||
| 2025-07-29 | 13F | Sigma Investment Counselors Inc | 807 | 207 | ||||||
| 2025-08-11 | 13F | Empowered Funds, LLC | 0 | -100.00 | 0 | -100.00 | ||||
| 2025-08-12 | 13F | Guerra Pan Advisors, Llc | 1,218 | 0.00 | 312 | 27.87 | ||||
| 2025-07-24 | 13F | Game Plan Financial Advisors, LLC | 860 | 0.00 | 221 | 27.91 | ||||
| 2025-08-14 | 13F | Qube Research & Technologies Ltd | 318 | 0.00 | 82 | 28.57 | ||||
| 2025-08-14 | 13F | Ancora Advisors, LLC | 300 | 0.00 | 77 | 26.67 | ||||
| 2025-05-09 | 13F | Financial Connections Group, Inc. | 0 | -100.00 | 0 | |||||
| 2025-08-06 | 13F | AE Wealth Management LLC | 285 | -11.49 | 73 | 14.06 | ||||
| 2025-08-12 | 13F | PSI Advisors, LLC | 0 | -100.00 | 0 | |||||
| 2025-08-06 | 13F | Grey Fox Wealth Advisors, LLC | 897 | 230 | ||||||
| 2025-07-29 | 13F | Stratos Wealth Partners, LTD. | 2,475 | 635 | ||||||
| 2025-08-06 | 13F | Stonebridge Financial Planning Group, LLC | 1,500 | -16.67 | 385 | 6.37 | ||||
| 2025-08-14 | 13F | Mercer Global Advisors Inc /adv | 1,857 | -3.88 | 476 | 23.00 | ||||
| 2025-04-28 | 13F | Smart Money Group LLC | 0 | -100.00 | 0 | |||||
| 2025-05-14 | 13F | Lionshead Wealth Management, LLC | 0 | -100.00 | 0 | |||||
| 2025-07-21 | 13F | Ameritas Advisory Services, LLC | 204 | 52 | ||||||
| 2025-05-05 | 13F | Transce3nd, LLC | 0 | -100.00 | 0 | |||||
| 2025-08-01 | 13F | Ashton Thomas Private Wealth, LLC | 1,059 | 0.00 | 272 | 27.83 | ||||
| 2025-07-14 | 13F | Painted Porch Advisors LLC | 2 | 0.00 | 1 | |||||
| 2025-08-11 | 13F | Rothschild Investment Llc | 3 | 0.00 | 1 | |||||
| 2025-08-05 | 13F | Tsfg, Llc | 101 | 0.00 | 0 | |||||
| 2025-08-14 | 13F | Benjamin Edwards Inc | 1,644 | 0.06 | 422 | 27.96 | ||||
| 2025-07-21 | 13F | Crews Bank & Trust | 50 | 0.00 | 13 | 20.00 | ||||
| 2025-08-06 | 13F | Modera Wealth Management, LLC | 1,436 | 0.00 | 368 | 27.78 | ||||
| 2025-08-14 | 13F | Coastal Bridge Advisors, LLC | 1,170 | -9.65 | 300 | 15.38 | ||||
| 2025-07-24 | 13F | Rice Partnership, LLC | 90 | 0.00 | 23 | 27.78 | ||||
| 2025-07-21 | 13F | Ameriflex Group, Inc. | 9 | 0.00 | 2 | 100.00 | ||||
| 2025-08-13 | 13F | Providence Capital Advisors, LLC | 5 | 1 | ||||||
| 2025-08-12 | 13F | Harbor Advisory Corp /ma/ | 7,556 | -4.22 | 1,938 | 22.43 | ||||
| 2025-07-18 | 13F | Truist Financial Corp | 12,146 | 8.44 | 3,116 | 38.57 | ||||
| 2025-07-28 | 13F | Harbour Investments, Inc. | 414 | -26.60 | 106 | -6.19 | ||||
| 2025-08-08 | 13F | Larson Financial Group LLC | 140 | 36 | ||||||
| 2025-08-14 | 13F | Bnp Paribas Arbitrage, Sa | 75,597 | 47.85 | 19,391 | 88.90 | ||||
| 2025-05-13 | 13F | Mill Creek Capital Advisors, LLC | 0 | -100.00 | 0 | -100.00 | ||||
| 2025-07-29 | 13F | Stephens Inc /ar/ | 1,152 | 296 | ||||||
| 2025-08-06 | 13F | Atlantic Union Bankshares Corp | 753 | 193 | ||||||
| 2025-08-01 | 13F | Biltmore Family Office, LLC | 1,650 | 0.00 | 423 | 27.79 | ||||
| 2025-08-14 | 13F | Royal Bank Of Canada | 34,250 | -4.82 | 8,786 | 21.61 | ||||
| 2025-07-15 | 13F | World Equity Group, Inc. | 900 | 231 | ||||||
| 2025-07-24 | 13F | IFP Advisors, Inc | 264 | 17.86 | 68 | 52.27 | ||||
| 2025-08-14 | 13F | Bank Of America Corp /de/ | 86,623 | -1.38 | 22,220 | 25.99 | ||||
| 2025-08-14 | 13F | Goldman Sachs Group Inc | 50,336 | -24.16 | 12,912 | -3.11 | ||||
| 2025-08-08 | 13F | Avantax Advisory Services, Inc. | 5,562 | 28.51 | 1,427 | 64.10 | ||||
| 2025-04-23 | 13F | Oppenheimer & Co Inc | 0 | -100.00 | 0 | -100.00 | ||||
| 2025-08-14 | 13F | D. E. Shaw & Co., Inc. | 2,570 | 0.00 | 659 | 27.96 | ||||
| 2025-08-14 | 13F | Fort Point Capital Partners LLC | 5,756 | 7.49 | 1,477 | 37.30 | ||||
| 2025-07-25 | 13F | Cwm, Llc | 383 | 15.71 | 0 | |||||
| 2025-07-10 | 13F | Global Financial Private Client, LLC | 3,039 | -0.46 | 780 | 27.29 | ||||
| 2025-08-04 | 13F | Flagship Harbor Advisors, Llc | 888 | 228 | ||||||
| 2025-08-14 | 13F | Peapack Gladstone Financial Corp | 2,000 | 0.00 | 1 | |||||
| 2025-08-15 | 13F | Kestra Advisory Services, LLC | 3,035 | -50.71 | 778 | -37.06 | ||||
| 2025-07-22 | 13F | Beacon Financial Advisory LLC | 2,334 | -21.86 | 599 | -0.17 | ||||
| 2025-07-14 | 13F | GAMMA Investing LLC | 3 | 0.00 | 1 | |||||
| 2025-08-13 | 13F | Twin Peaks Wealth Advisors, LLC | 32 | 9 | ||||||
| 2025-07-30 | 13F | Princeton Global Asset Management LLC | 97 | 0.00 | 25 | 26.32 | ||||
| 2025-08-06 | 13F | Golden State Wealth Management, LLC | 543 | -5.07 | 139 | 21.93 | ||||
| 2025-08-18 | 13F | Hollencrest Capital Management | 116 | 0.00 | 30 | 26.09 | ||||
| 2025-08-14 | 13F | Comerica Bank | 287 | 0.00 | 74 | 28.07 | ||||
| 2025-07-02 | 13F | HBW Advisory Services LLC | 0 | -100.00 | 0 | |||||
| 2025-08-14 | 13F | Colony Group, LLC | 3,420 | 7.92 | 878 | 37.89 | ||||
| 2025-07-28 | 13F | Copia Wealth Management | 90 | 0.00 | 23 | 27.78 | ||||
| 2025-08-01 | 13F | Bessemer Group Inc | 56 | -85.96 | 0 | |||||
| 2025-04-14 | 13F | Henrickson Nauta Wealth Advisors, Inc. | 0 | -100.00 | 0 | |||||
| 2025-07-17 | 13F | Hanson & Doremus Investment Management | 29 | 0.00 | 0 | |||||
| 2025-08-26 | 13F/A | Thrivent Financial For Lutherans | 1,029 | -88.06 | 0 | -100.00 | ||||
| 2025-08-14 | 13F | Mariner, LLC | 8,223 | 12.34 | 2,109 | 43.57 | ||||
| 2025-04-29 | 13F | Hm Payson & Co | 17 | 3 | ||||||
| 2025-07-23 | 13F | Beaumont Asset Management, L.L.C. | 11,563 | 0.71 | 2,966 | 28.63 | ||||
| 2025-07-31 | 13F | Brinker Capital Investments, LLC | 0 | -100.00 | 0 | -100.00 | ||||
| 2025-08-06 | 13F | First Horizon Advisors, Inc. | 20 | 5 | ||||||
| 2025-08-11 | 13F | TD Waterhouse Canada Inc. | 50 | 0.00 | 13 | 20.00 | ||||
| 2025-08-13 | 13F | Jones Financial Companies Lllp | 3,212 | 33.17 | 823 | 68.79 | ||||
| 2025-08-05 | 13F | Simplex Trading, Llc | 0 | -100.00 | 0 | |||||
| 2025-08-01 | 13F | Jericho Financial, Llp | 1,255 | 4.93 | 322 | 33.75 | ||||
| 2025-08-11 | 13F | Aptus Capital Advisors, LLC | 248 | 12.22 | 64 | 43.18 | ||||
| 2025-05-14 | 13F | TD Capital Management LLC | 0 | -100.00 | 0 | |||||
| 2025-07-22 | 13F | Chemung Canal Trust Co | 1,871 | -79.26 | 480 | -73.55 | ||||
| 2025-07-30 | 13F | Bogart Wealth, LLC | 447 | 28.82 | 115 | 65.22 | ||||
| 2025-08-14 | 13F/A | Barclays Plc | 250 | 0.00 | 0 | |||||
| 2025-07-10 | 13F | Atticus Wealth Management, Llc | 1 | 0.00 | 0 | |||||
| 2025-08-12 | 13F | Wood Tarver Financial Group, LLC | 539 | 0.00 | 0 | -100.00 | ||||
| 2025-08-11 | 13F | Capital Square, LLC | 1,177 | 312 | ||||||
| 2025-07-29 | 13F | International Assets Investment Management, Llc | 1,950 | -0.91 | 500 | 26.58 | ||||
| 2025-08-14 | 13F | Guardian Wealth Advisors, Llc / Nc | 248 | 19.23 | 64 | 53.66 | ||||
| 2025-08-14 | 13F | Hrt Financial Lp | 0 | -100.00 | 0 | |||||
| 2025-08-14 | 13F | Money Concepts Capital Corp | 12,096 | -23.19 | 3,103 | -1.87 | ||||
| 2025-08-12 | 13F | Jpmorgan Chase & Co | 2,425 | 41.65 | 622 | 81.34 | ||||
| 2025-08-01 | 13F | Gwn Securities Inc. | 1,892 | 489 | ||||||
| 2025-08-13 | 13F | Consultiva Wealth Management, Corp. | 83 | 0.00 | 21 | 31.25 | ||||
| 2025-08-13 | 13F | Baird Financial Group, Inc. | 8,454 | -51.95 | 2,169 | -38.62 | ||||
| 2025-05-02 | 13F | SeaBridge Investment Advisors LLC | 0 | -100.00 | 0 | |||||
| 2025-08-07 | 13F | Allworth Financial LP | 50 | 0.00 | 13 | 33.33 | ||||
| 2025-03-21 | 13F | Prostatis Group LLC | 0 | -100.00 | 0 | |||||
| 2025-08-13 | 13F | EverSource Wealth Advisors, LLC | 41 | 0.00 | 11 | 25.00 | ||||
| 2025-08-14 | 13F | GWM Advisors LLC | 317 | 0.00 | 81 | 28.57 | ||||
| 2025-08-15 | 13F | Tower Research Capital LLC (TRC) | 14,151 | -6.47 | 3,630 | 19.49 | ||||
| 2025-05-13 | 13F | Intrepid Financial Planning Group LLC | 0 | -100.00 | 0 | -100.00 | ||||
| 2025-04-30 | 13F | M&t Bank Corp | 0 | -100.00 | 0 | -100.00 | ||||
| 2025-08-13 | 13F | Flow Traders U.s. Llc | 5,258 | 1 | ||||||
| 2025-08-14 | 13F | Ameriprise Financial Inc | 79,799 | -1.45 | 20,486 | 26.14 | ||||
| 2025-08-11 | 13F | Morling Financial Advisors, LLC | 52 | 13 | ||||||
| 2025-07-29 | 13F | BKD Wealth Advisors, LLC | 0 | -100.00 | 0 | |||||
| 2025-08-12 | 13F | Argent Trust Co | 2,300 | 0.00 | 590 | 27.77 | ||||
| 2025-07-30 | 13F | First Interstate Bank | 29,163 | -0.69 | 7,481 | 26.87 | ||||
| 2025-08-14 | 13F | Millennium Management Llc | 37,987 | 9,744 | ||||||
| 2025-08-01 | 13F | Envestnet Asset Management Inc | 34,533 | 70.05 | 8,858 | 117.27 | ||||
| 2025-08-11 | 13F | Private Advisor Group, LLC | 1,576 | -2.17 | 404 | 25.08 | ||||
| 2025-08-05 | 13F | Bank Of Montreal /can/ | 10 | -97.10 | 3 | -97.10 | ||||
| 2025-08-18 | 13F/A | National Bank Of Canada /fi/ | 49 | 600.00 | 13 | 1,100.00 | ||||
| 2025-04-24 | 13F | Wingate Wealth Advisors, Inc. | 0 | -100.00 | 0 | |||||
| 2025-08-14 | 13F | Jane Street Group, Llc | 1,185 | -81.66 | 304 | -76.62 | ||||
| 2025-08-14 | 13F | Millennium Management Llc | Call | 25,000 | 6,413 | |||||
| 2025-08-14 | 13F | Stifel Financial Corp | 19,936 | 0.54 | 5,114 | 28.46 | ||||
| 2025-08-04 | 13F | Creative Financial Designs Inc /adv | 35 | 0.00 | 9 | 28.57 | ||||
| 2025-05-07 | 13F | Mb, Levis & Associates, Llc | 0 | -100.00 | 0 | -100.00 | ||||
| 2025-08-13 | 13F | Gateway Wealth Partners, LLC | 1,043 | 0.00 | 268 | 27.75 | ||||
| 2025-08-05 | 13F | Plante Moran Financial Advisors, LLC | 129 | 0.00 | 33 | 32.00 | ||||
| 2025-04-17 | 13F | Atlas Financial Advisors, Inc. | 1,068 | 2.50 | 265 | 6.00 | ||||
| 2025-07-14 | 13F | Armstrong Advisory Group, Inc | 41 | 0.00 | 11 | 0.00 | ||||
| 2025-08-04 | 13F | Pensionmark Financial Group, Llc | 1,476 | 40.97 | 378 | 80.00 | ||||
| 2025-08-06 | 13F | Tradewinds, LLC. | 0 | -100.00 | 0 | |||||
| 2025-08-11 | 13F | SFI Advisors, LLC | 3,645 | -78.53 | 935 | -72.59 | ||||
| 2025-08-14 | 13F | Federation des caisses Desjardins du Quebec | 40 | 0.00 | 10 | 25.00 | ||||
| 2025-08-18 | 13F | Geneos Wealth Management Inc. | 188 | -3.09 | 48 | 26.32 | ||||
| 2025-07-09 | 13F | Bulwark Capital Corp | 161 | 41 | ||||||
| 2025-08-19 | 13F | Advisory Services Network, LLC | 3,442 | -4.50 | 913 | 26.28 | ||||
| 2025-07-08 | 13F | Parallel Advisors, LLC | 211 | -19.16 | 54 | 3.85 | ||||
| 2025-07-11 | 13F | Farther Finance Advisors, LLC | 959 | -7.88 | 246 | 17.22 | ||||
| 2025-07-18 | 13F | SOA Wealth Advisors, LLC. | 1,771 | 0.11 | 454 | 27.89 | ||||
| 2025-07-25 | 13F | M3 Advisory Group, LLC | 1,885 | -8.36 | 483 | 17.23 | ||||
| 2025-07-17 | 13F | Patton Albertson Miller Group, Llc | 3,468 | 0.00 | 890 | 27.73 | ||||
| 2025-07-14 | 13F | UMA Financial Services, Inc. | 88 | 0.00 | 23 | 29.41 | ||||
| 2025-08-13 | 13F | Russell Investments Group, Ltd. | 458 | 0.00 | 118 | 28.57 | ||||
| 2025-08-06 | 13F | Commonwealth Equity Services, Llc | 24,894 | -6.82 | 6 | 20.00 | ||||
| 2025-07-23 | NP | CHPS - Xtrackers Semiconductor Select Equity ETF | 10 | 2 | ||||||
| 2025-05-14 | 13F | Legend Financial Advisors, Inc. | 0 | -100.00 | 0 | |||||
| 2025-07-24 | 13F | Blair William & Co/il | 2,793 | 0.43 | 716 | 28.32 | ||||
| 2025-05-12 | 13F | Sandy Spring Bank | 753 | 0.00 | 151 | -19.25 | ||||
| 2025-08-13 | 13F | Renaissance Technologies Llc | 0 | -100.00 | 0 | |||||
| 2025-07-17 | 13F | Chatham Capital Group, Inc. | 5,617 | 0.00 | 1,441 | 27.77 | ||||
| 2025-08-08 | 13F | Kaizen Financial Strategies | 2,000 | -3.61 | 513 | 23.32 | ||||
| 2025-07-31 | 13F | Conservest Capital Advisors, Inc. | 2,430 | 623 | ||||||
| 2025-08-08 | 13F | Emerald Investment Partners, Llc | 11 | 3 | ||||||
| 2025-08-12 | 13F | Agp Franklin, Llc | 1,982 | 0.00 | 508 | 43.91 | ||||
| 2025-07-22 | 13F | Merit Financial Group, LLC | 5,747 | 14.21 | 1,474 | 45.94 | ||||
| 2025-08-06 | 13F | Soltis Investment Advisors LLC | 2,400 | -1.36 | 616 | 26.02 | ||||
| 2025-08-14 | 13F | Glen Eagle Advisors, LLC | 8 | 0.00 | 2 | 100.00 | ||||
| 2025-07-29 | NP | MSSS - Monarch Select Subsector Index ETF | 41,835 | -6.11 | 9,251 | -8.41 | ||||
| 2025-07-22 | 13F | Global Assets Advisory, LLC | 2,332 | -80.65 | 598 | -73.42 | ||||
| 2025-08-14 | 13F | UBS Group AG | 62,612 | 33.38 | 16,061 | 70.42 | ||||
| 2025-07-07 | 13F | Thurston, Springer, Miller, Herd & Titak, Inc. | 4,928 | 1,264 | ||||||
| 2025-08-15 | 13F | Morgan Stanley | 246,868 | 30.82 | 63,324 | 67.13 | ||||
| 2025-08-14 | 13F | Wells Fargo & Company/mn | 77,159 | 0.28 | 19,792 | 28.12 | ||||
| 2025-08-14 | 13F | CoreCap Advisors, LLC | 64,823 | 220.48 | 16,628 | 309.53 | ||||
| 2025-08-12 | 13F | Richard W. Paul & Associates, LLC | 92 | 0.00 | 24 | 27.78 | ||||
| 2025-07-24 | 13F | Us Bancorp \de\ | 1,163 | 0.09 | 298 | 27.90 | ||||
| 2025-07-30 | 13F | Crewe Advisors LLC | 0 | -100.00 | 0 | |||||
| 2025-08-08 | 13F | Creative Planning | 3,169 | 2.06 | 813 | 30.34 | ||||
| 2025-05-12 | 13F | Atlas Capital Advisors Llc | 0 | -100.00 | 0 | |||||
| 2025-08-12 | 13F | Manchester Capital Management LLC | 1,750 | 0.00 | 449 | 27.64 | ||||
| 2025-07-21 | 13F | Jmac Enterprises Llc | 23,792 | 13.61 | 6,103 | 45.15 | ||||
| 2025-08-08 | 13F | Glassman Wealth Services | 0 | -100.00 | 0 | -100.00 | ||||
| 2025-08-11 | 13F | Tidemark, LLC | 34 | -52.11 | 9 | -42.86 | ||||
| 2025-08-04 | 13F | Kovack Advisors, Inc. | 1,097 | -5.92 | 281 | 20.09 | ||||
| 2025-07-17 | 13F | Janney Montgomery Scott LLC | 19,321 | 1.05 | 5 | 33.33 | ||||
| 2025-08-05 | 13F | Huntington National Bank | 114 | 276.67 | ||||||
| 2025-07-31 | 13F | Hobart Private Capital, LLC | 38,616 | -14.15 | 9,905 | 9.69 | ||||
| 2025-04-25 | 13F | WASHINGTON TRUST Co | 0 | -100.00 | 0 | -100.00 | ||||
| 2025-05-28 | NP | THRIVENT SERIES FUND INC - Thrivent All Cap Portfolio Class A | 8,615 | 42.07 | 1,730 | 14.81 | ||||
| 2025-07-01 | 13F | Harbor Investment Advisory, Llc | 1,352 | -6.89 | 347 | 18.90 | ||||
| 2025-07-08 | 13F | Juncture Wealth Strategies, Llc | 1,466 | 18.32 | 376 | 51.61 | ||||
| 2025-08-11 | 13F | Compass Capital Corp /ma/ /adv | 0 | -100.00 | 0 | |||||
| 2025-07-16 | 13F | Arkansas Financial Group, Inc. | 4,448 | -0.43 | 1,172 | 50.26 | ||||
| 2025-04-30 | 13F | Round Rock Advisors, LLC | 0 | -100.00 | 0 | |||||
| 2025-07-18 | 13F | McGuire Investment Group, LLC | 41,905 | 1.14 | 10,749 | 29.21 | ||||
| 2025-07-29 | 13F | Chicago Partners Investment Group LLC | 4,033 | 0.02 | 1,077 | 32.47 | ||||
| 2025-04-29 | 13F | U.S. Capital Wealth Advisors, LLC | 0 | -100.00 | 0 | |||||
| 2025-08-12 | 13F | BlackRock, Inc. | 9,218 | -0.18 | 2,365 | 27.51 | ||||
| 2025-08-12 | 13F | Deutsche Bank Ag\ | 10 | 0.00 | 3 | 0.00 | ||||
| 2025-08-07 | 13F | McClarren Financial Advisors, Inc. | 0 | -100.00 | 0 | |||||
| 2025-08-13 | 13F/A | StoneX Group Inc. | 1,495 | 19.98 | 331 | 27.41 | ||||
| 2025-07-02 | 13F | Capital Market Strategies LLC | 1,087 | 0.00 | 279 | 27.52 | ||||
| 2025-08-13 | 13F | Safe Harbor Fiduciary, LLC | 0 | -100.00 | 0 | |||||
| 2025-08-01 | 13F | Belvedere Trading LLC | 0 | -100.00 | 0 | -100.00 | ||||
| 2025-08-11 | 13F | Citigroup Inc | 5,159 | -2.48 | 1,323 | 24.58 | ||||
| 2025-07-08 | 13F | Nbc Securities, Inc. | 335 | 3.72 | 0 | |||||
| 2025-07-22 | 13F | Wealthcare Advisory Partners LLC | 1,159 | 297 | ||||||
| 2025-08-14 | 13F | Sunbelt Securities, Inc. | 50 | -54.55 | 12 | -45.45 | ||||
| 2025-09-04 | 13F/A | Advisor Group Holdings, Inc. | 33,800 | 3.64 | 8,678 | 32.45 | ||||
| 2025-08-14 | 13F | Pennington Partners & Co., Llc | 937 | 240 | ||||||
| 2025-08-15 | 13F | CI Private Wealth, LLC | 4,172 | 28.92 | 1,070 | 64.87 | ||||
| 2025-07-22 | 13F | Valley National Advisers Inc | 105 | 0.00 | 0 | |||||
| 2025-08-14 | 13F | Fmr Llc | 1,077 | -15.79 | 276 | 7.81 | ||||
| 2025-04-28 | 13F | Mutual Advisors, LLC | 0 | -100.00 | 0 | -100.00 | ||||
| 2025-08-14 | 13F | Quantinno Capital Management LP | 2,308 | 592 | ||||||
| 2025-05-13 | 13F | Ground Swell Capital, LLC | 0 | -100.00 | 0 | -100.00 | ||||
| 2025-07-10 | 13F | Sovran Advisors, LLC | 2,623 | -3.60 | 691 | 47.02 | ||||
| 2025-08-12 | 13F | Marshall & Sterling Wealth Advisors Inc. | 249 | -4.96 | 64 | 21.15 | ||||
| 2025-08-12 | 13F | MAI Capital Management | 150 | 0.00 | 39 | 26.67 | ||||
| 2025-05-12 | 13F | Waterloo Capital, L.P. | 0 | -100.00 | 0 | |||||
| 2025-08-08 | 13F | Pnc Financial Services Group, Inc. | 67,337 | -9.18 | 17,273 | 16.04 | ||||
| 2025-07-30 | 13F | Forum Financial Management, LP | 1,041 | 267 | ||||||
| 2025-07-14 | 13F | Park Avenue Securities Llc | 929 | 0 | ||||||
| 2025-08-01 | 13F | Vision Financial Markets Llc | 117 | 0.00 | 30 | 26.09 | ||||
| 2025-04-11 | 13F | Affinity Wealth Management Llc | 0 | -100.00 | 0 | |||||
| 2025-08-14 | 13F | Gerber Kawasaki Wealth & Investment Management | 6,264 | -17.60 | 1,607 | 5.24 | ||||
| 2025-07-23 | 13F | Prime Capital Investment Advisors, LLC | 3,055 | -0.16 | 784 | 27.52 | ||||
| 2025-08-13 | 13F | Cresset Asset Management, LLC | 911 | 234 | ||||||
| 2025-08-04 | 13F | Assetmark, Inc | 104 | 4.00 | 27 | 30.00 | ||||
| 2025-08-13 | 13F | Beacon Pointe Advisors, LLC | 918 | 236 | ||||||
| 2025-08-11 | 13F | Aspen Investment Management Inc | 1,034 | 0.00 | 0 | |||||
| 2025-07-22 | 13F | Kessler Investment Group, LLC | 2 | 0.00 | 1 | |||||
| 2025-05-06 | 13F | Jackson, Grant Investment Advisers, Inc. | 0 | -100.00 | 0 | |||||
| 2025-08-07 | 13F | Rathbone Brothers plc | 2,568 | 0.00 | 659 | 27.77 | ||||
| 2025-07-31 | 13F | Sharper & Granite LLC | 4,770 | 23.42 | 1,249 | 61.03 | ||||
| 2025-08-14 | 13F | Sandler Capital Management | 9,000 | 2,309 | ||||||
| 2025-07-10 | 13F | Wealth Enhancement Advisory Services, Llc | 3,524 | 57.32 | 934 | 108.02 | ||||
| 2025-08-07 | 13F | Parkside Financial Bank & Trust | 88 | 23 | ||||||
| 2025-05-02 | 13F | Signaturefd, Llc | 0 | -100.00 | 0 | |||||
| 2025-07-15 | 13F | Yarbrough Capital, LLC | 10,498 | -48.19 | 2,693 | -33.82 | ||||
| 2025-08-12 | 13F | Park Square Financial Group, LLC | 1 | 0 | ||||||
| 2025-08-08 | 13F | Kingsview Wealth Management, LLC | 47,618 | -18.89 | 12,214 | 3.63 | ||||
| 2025-08-19 | 13F | National Asset Management, Inc. | 0 | -100.00 | 0 | -100.00 | ||||
| 2025-08-04 | 13F | Spire Wealth Management | 285 | -45.71 | 73 | -31.43 | ||||
| 2025-07-18 | 13F | Vicus Capital | 897 | 230 | ||||||
| 2025-08-11 | 13F | HighTower Advisors, LLC | 14,611 | 0.21 | 3,748 | 28.02 | ||||
| 2025-08-12 | 13F | SRS Capital Advisors, Inc. | 5 | 0.00 | 1 | 0.00 | ||||
| 2025-04-28 | 13F | Strategic Financial Concepts, LLC | 0 | -100.00 | 0 | -100.00 | ||||
| 2025-05-13 | 13F | Adams Wealth Management | 37,115 | 6.94 | 7,452 | -13.59 | ||||
| 2025-07-25 | 13F | Hazlett, Burt & Watson, Inc. | 0 | -100.00 | 0 | |||||
| 2025-08-11 | 13F | Principal Securities, Inc. | 673 | 173 | ||||||
| 2025-08-12 | 13F | Global Retirement Partners, LLC | 958 | 2.24 | 246 | 5.60 | ||||
| 2025-07-23 | 13F | Kingswood Wealth Advisors, Llc | 1,150 | -24.49 | 295 | -3.59 | ||||
| 2025-08-12 | 13F | Proequities, Inc. | 0 | 0 | ||||||
| 2025-07-15 | 13F | North Star Investment Management Corp. | 550 | 18.53 | 141 | 51.61 | ||||
| 2025-05-06 | 13F | Hamilton Point Investment Advisors, LLC | 0 | -100.00 | 0 | -100.00 | ||||
| 2025-05-13 | 13F | CacheTech Inc. | 37,115 | 6.94 | 7,452 | -13.59 | ||||
| 2025-08-14 | 13F | Synovus Financial Corp | 1,719 | 441 | ||||||
| 2025-05-14 | 13F | Snowden Capital Advisors LLC | 0 | -100.00 | 0 | |||||
| 2025-08-14 | 13F | Susquehanna International Group, Llp | Put | 11,100 | 13.27 | 2,847 | 44.74 | |||
| 2025-08-14 | 13F | Susquehanna International Group, Llp | 11,984 | 34.12 | 3,074 | 71.44 | ||||
| 2025-08-14 | 13F | Susquehanna International Group, Llp | Call | 42,600 | 48.43 | 10,927 | 89.64 | |||
| 2025-04-14 | 13F | Regent Peak Wealth Advisors LLC | 3,525 | 0.00 | 708 | -19.20 | ||||
| 2025-08-13 | 13F | Northwestern Mutual Wealth Management Co | 3,449 | -24.92 | 885 | -4.12 | ||||
| 2025-08-14 | 13F | MGB Wealth Management, LLC | 32,042 | -1.57 | 8,218 | 25.72 | ||||
| 2025-04-02 | 13F | Marcum Wealth, LLC | 1,040 | 0.00 | 209 | -19.38 | ||||
| 2025-08-19 | 13F | Newbridge Financial Services Group, Inc. | 709 | -9.22 | 182 | 16.03 | ||||
| 2025-08-29 | 13F | Centaurus Financial, Inc. | 4,287 | 75.41 | 1 | |||||
| 2025-07-31 | 13F | Cambridge Investment Research Advisors, Inc. | 15,007 | 4.73 | 4 | 50.00 | ||||
| 2025-07-29 | 13F | Private Trust Co Na | 154 | 2.67 | 40 | 30.00 | ||||
| 2025-08-13 | 13F | Northern Trust Corp | 1,007 | 0.00 | 258 | 27.72 | ||||
| 2025-08-12 | 13F | LPL Financial LLC | 215,028 | -0.10 | 55,157 | 27.63 | ||||
| 2025-08-08 | 13F | Cetera Investment Advisers | 48,939 | 8.15 | 12,553 | 38.19 | ||||
| 2025-08-14 | 13F | Mml Investors Services, Llc | 28,822 | -0.42 | 7 | 40.00 | ||||
| 2025-08-12 | 13F | Archer Investment Corp | 28 | 0.00 | 7 | 40.00 | ||||
| 2025-08-08 | 13F | Hartland & Co., LLC | 25 | 0.00 | 6 | 20.00 | ||||
| 2025-07-15 | 13F | Cranbrook Wealth Management, LLC | 5 | 0.00 | 1 | 0.00 | ||||
| 2025-07-09 | 13F | Bank of New Hampshire | 722 | -28.16 | 185 | -7.96 | ||||
| 2025-07-30 | 13F | Sonata Capital Group Inc | 1,750 | 0.00 | 0 | |||||
| 2025-08-01 | 13F | Belvedere Trading LLC | Call | 5,000 | 138.10 | 1,283 | 204.51 | |||
| 2025-08-01 | 13F | Belvedere Trading LLC | Put | 100 | 0.00 | 26 | 25.00 | |||
| 2025-08-12 | 13F | Laurel Wealth Advisors LLC | 2,566 | 25,560.00 | 0 | -100.00 | ||||
| 2025-08-14 | 13F | Clark Capital Management Group, Inc. | 8,876 | 2,277 | ||||||
| 2025-04-28 | 13F | Financial Advocates Investment Management | 0 | -100.00 | 0 | |||||
| 2025-07-29 | 13F | Harbor Asset Planning, Inc. | 87 | 22 | ||||||
| 2025-08-11 | 13F | Wealthspire Advisors, LLC | 1,096 | 281 | ||||||
| 2025-08-08 | 13F | Gts Securities Llc | 0 | -100.00 | 0 | |||||
| 2025-08-12 | 13F | Concentrum Wealth Management | 1,129 | 290 | ||||||
| 2025-08-14 | 13F | IHT Wealth Management, LLC | 4,918 | -2.98 | 1,262 | 23.99 | ||||
| 2025-08-14 | 13F | Raymond James Financial Inc | 42,810 | -9.98 | 10,981 | 15.01 | ||||
| 2025-07-22 | 13F | Grimes & Company, Inc. | 6,936 | 1,779 | ||||||
| 2025-07-29 | 13F | Dale Q Rice Investment Management Ltd | 10,632 | -51.99 | 2,818 | -36.62 | ||||
| 2025-08-14 | 13F | EP Wealth Advisors, Inc. | 3,335 | -9.82 | 855 | 15.23 | ||||
| 2025-08-14 | 13F | Citadel Advisors Llc | Call | 8,900 | 34.85 | 2,283 | 72.23 | |||
| 2025-08-08 | 13F | Foundations Investment Advisors, LLC | 0 | -100.00 | 0 | -100.00 | ||||
| 2025-08-14 | 13F | Citadel Advisors Llc | 18,359 | 0.56 | 4,709 | 28.49 | ||||
| 2025-08-14 | 13F | Citadel Advisors Llc | Put | 6,300 | -35.05 | 1,616 | -17.00 |
Other Listings
| MX:XSD |