Mga Batayang Estadistika
| Pemilik Institusional | 164 total, 160 long only, 0 short only, 4 long/short - change of 7.19% MRQ |
| Alokasi Portofolio Rata-rata | 0.3864 % - change of 19.99% MRQ |
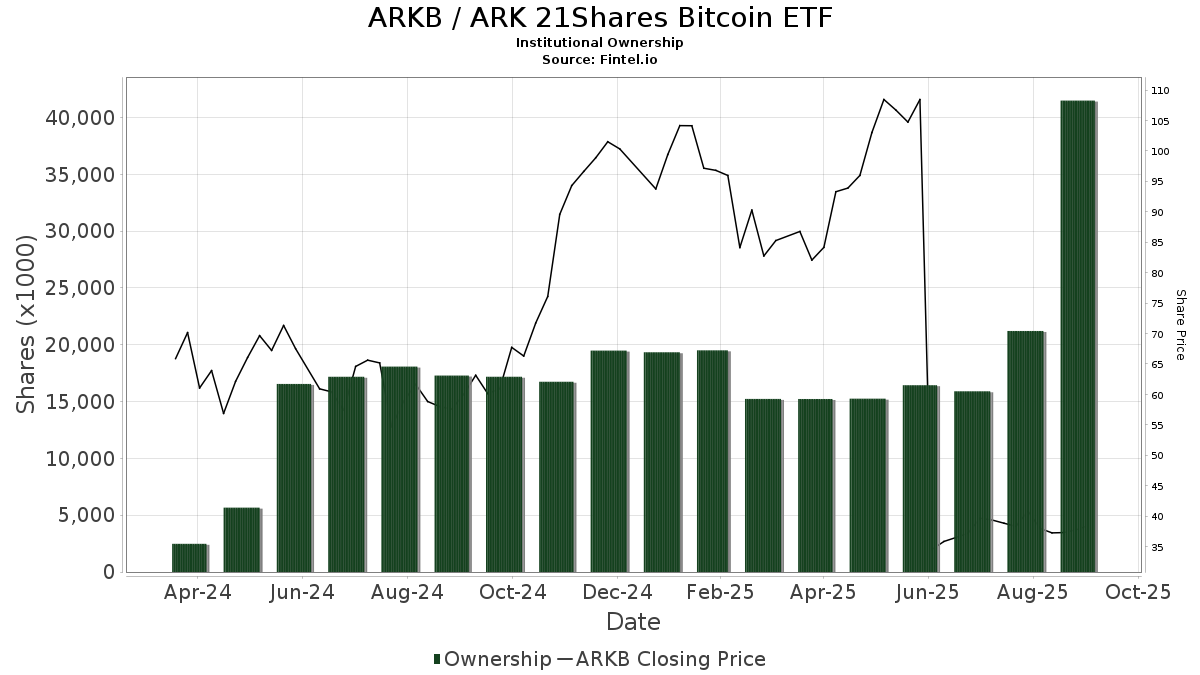
| Saham Institusional (Jangka Panjang) | 41,483,608 (ex 13D/G) - change of 25.05MM shares 152.37% MRQ |
| Nilai Institusional (Jangka Panjang) | $ 1,571,088 USD ($1000) |
Kepemilikan Institusional dan Pemegang Saham
ARK 21Shares Bitcoin ETF (US:ARKB) memiliki 164 pemilik institusional dan pemegang saham yang telah mengajukan formulir 13D/G atau 13F kepada Komisi Bursa Efek (Securities Exchange Commission/SEC). Lembaga-lembaga ini memegang total 41,483,608 saham. Pemegang saham terbesar meliputi Jane Street Group, Llc, ARK Investment Management LLC, Millennium Management Llc, Schonfeld Strategic Advisors LLC, Hbk Investments L P, ARKW - ARK Next Generation Internet ETF, Apollo Management Holdings, L.P., Susquehanna International Group, Llp, Kaleidoscope Capital Lp, and ARKF - ARK Fintech Innovation ETF .
Struktur kepemilikan institusional ARK 21Shares Bitcoin ETF (BATS:ARKB) menunjukkan posisi terkini di perusahaan oleh institusi dan dana, serta perubahan terbaru dalam ukuran posisi. Pemegang saham utama dapat mencakup investor individu, reksa dana, dana lindung nilai, atau institusi. Jadwal 13D menunjukkan bahwa investor memegang (atau pernah memegang) lebih dari 5% saham perusahaan dan bermaksud (atau pernah bermaksud) untuk secara aktif mengejar perubahan strategi bisnis. Jadwal 13G menunjukkan investasi pasif lebih dari 5%.
The share price as of September 5, 2025 is 37.10 / share. Previously, on September 6, 2024, the share price was 17.82 / share. This represents an increase of 108.23% over that period.
Skor Sentimen Dana
Skor Sentimen Dana (sebelumnya dikenal sebagai Skor Akumulasi Kepemilikan) menemukan saham-saham yang paling banyak dibeli oleh dana. Ini adalah hasil dari model kuantitatif multi-faktor yang canggih yang mengidentifikasi perusahaan dengan tingkat akumulasi institusional tertinggi. Model penilaian menggunakan kombinasi dari total peningkatan pemilik yang diungkapkan, perubahan dalam alokasi portofolio pada pemilik tersebut, dan metrik lainnya. Angka berkisar dari 0 hingga 100, dengan angka yang lebih tinggi menunjukkan tingkat akumulasi yang lebih tinggi dibandingkan dengan perusahaan sejenisnya, dan 50 adalah rata-ratanya.
Frekuensi Pembaruan: Setiap Hari
Lihat Ownership Explorer, yang menyediakan daftar perusahaan dengan peringkat tertinggi.
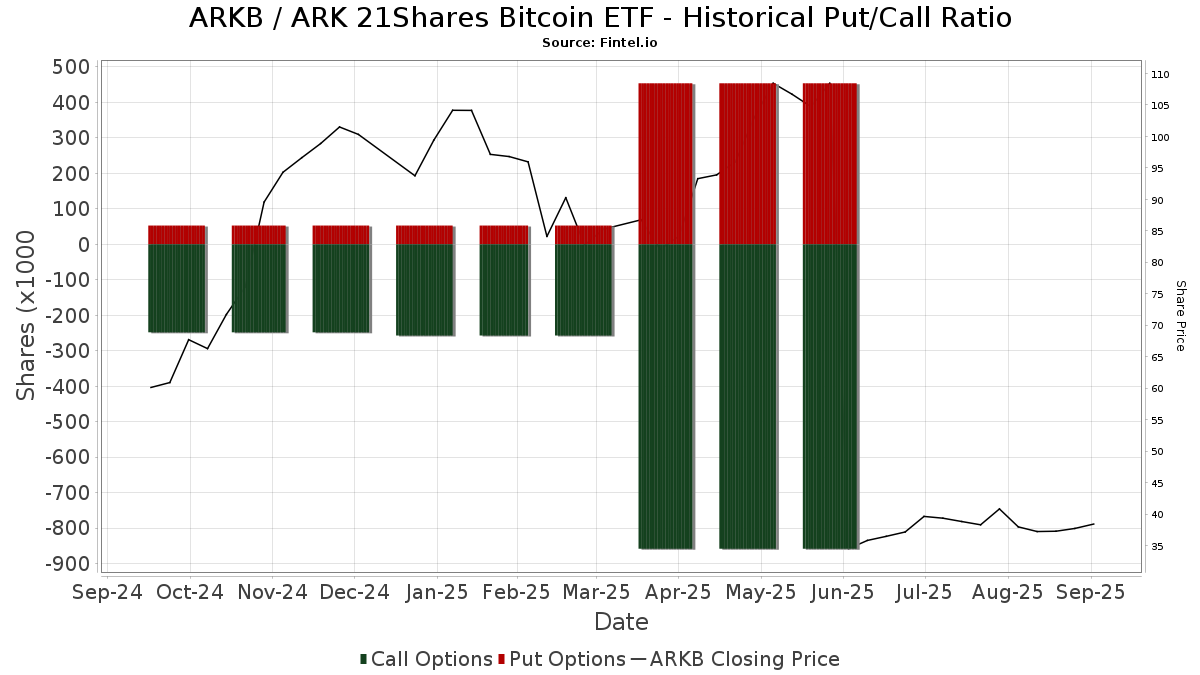
Rasio Put/Call Institusional
Selain melaporkan isu ekuitas dan utang standar, institusi dengan aset di bawah manajemen lebih dari 100 juta dolar AS juga harus mengungkapkan kepemilikan opsi put dan call mereka. Karena opsi put umumnya menunjukkan sentimen negatif, dan opsi call menunjukkan sentimen positif, kita dapat mengetahui sentimen institusional secara keseluruhan dengan memplot rasio put terhadap call. Grafik di sebelah kanan memplot rasio put/call historis untuk instrumen ini.
Menggunakan Rasio Put/Call sebagai indikator sentimen investor mengatasi salah satu kekurangan utama dari penggunaan total kepemilikan institusional, yaitu sejumlah besar aset yang dikelola diinvestasikan secara pasif untuk melacak indeks. Dana yang dikelola secara pasif biasanya tidak membeli opsi, sehingga indikator rasio put/call lebih akurat dalam melacak sentimen dana yang dikelola secara aktif.
Pengajuan 13F dan NPORT
Detail pada pengajuan 13F tersedia gratis. Detail pada pengajuan NP memerlukan keanggotaan premium. Baris berwarna hijau menunjukkan posisi baru. Baris berwarna merah menunjukkan posisi yang sudah ditutup. Klik tautan ini ikon untuk melihat riwayat transaksi selengkapnya.
Tingkatkan
untuk membuka data premium dan mengekspor ke Excel ![]() .
.
| Tanggal File | Sumber | Investor | Ketik | Presyo ng Avg (Silangan) |
Saham | Δ Saham (%) |
Dilaporkan Nilai ($1000) |
Nilai Δ (%) |
Alokasi Port (%) |
|
|---|---|---|---|---|---|---|---|---|---|---|
| 2025-08-06 | 13F | Prospera Financial Services Inc | 71,631 | 2,564 | ||||||
| 2025-08-13 | 13F | Certior Financial Group, Llc | 15,000 | 193.54 | 537 | 27.62 | ||||
| 2025-08-14 | 13F | CIBC World Markets Inc. | 10,650 | 199.16 | 381 | 30.48 | ||||
| 2025-07-01 | 13F | Harbor Investment Advisory, Llc | 1,155 | 208.00 | 41 | 36.67 | ||||
| 2025-08-14 | 13F | Old Mission Capital Llc | 0 | -100.00 | 0 | |||||
| 2025-05-07 | 13F | Atlas Legacy Advisors, LLC | 0 | -100.00 | 0 | |||||
| 2025-08-14 | 13F | Two Sigma Securities, Llc | 12,137 | 210.57 | 434 | 35.20 | ||||
| 2025-08-08 | 13F | Woodley Farra Manion Portfolio Management Inc | 9,000 | 322 | ||||||
| 2025-05-16 | 13F/A | Kestra Investment Management, LLC | 0 | -100.00 | 0 | |||||
| 2025-08-14 | 13F | Citadel Advisors Llc | Put | 224,500 | 1,033.84 | 8,035 | 393.79 | |||
| 2025-08-12 | 13F | Titleist Asset Management, Llc | 478,234 | 197.86 | 17,116 | 29.69 | ||||
| 2025-08-18 | 13F | Geneos Wealth Management Inc. | 40,158 | 1,531.11 | 1,437 | 611.39 | ||||
| 2025-08-11 | 13F | HighTower Advisors, LLC | 90,336 | 214.43 | 3,233 | 36.93 | ||||
| 2025-07-15 | 13F | Well Done, LLC | 75,870 | 200.00 | 2,715 | 15.14 | ||||
| 2025-07-24 | 13F | Ronald Blue Trust, Inc. | 81,041 | 247.00 | 2,900 | 51.12 | ||||
| 2025-06-25 | NP | ARKF - ARK Fintech Innovation ETF | 636,601 | 0.00 | 59,770 | -7.34 | ||||
| 2025-08-13 | 13F | Hsbc Holdings Plc | 180,000 | 200.00 | 6,442 | 30.62 | ||||
| 2025-05-05 | 13F | Transce3nd, LLC | 0 | -100.00 | 0 | |||||
| 2025-04-30 | 13F | Kedalion Capital Management LLP | 0 | -100.00 | 0 | |||||
| 2025-08-05 | 13F | State Of Michigan Retirement System | 300,000 | 200.00 | 10,737 | 30.62 | ||||
| 2025-07-25 | 13F | Cwm, Llc | 7,045 | 231.06 | 0 | |||||
| 2025-04-18 | 13F | Pacific Capital Wealth Advisors, Inc | 0 | -100.00 | 0 | -100.00 | ||||
| 2025-08-14 | 13F | Mercer Global Advisors Inc /adv | 0 | -100.00 | 0 | |||||
| 2025-08-12 | 13F | Clark Financial Services Group Inc /bd | 12,229 | 202.17 | 438 | 31.63 | ||||
| 2025-08-04 | 13F | Hantz Financial Services, Inc. | 1,884 | 223.71 | 0 | |||||
| 2025-07-17 | 13F | Global Trust Asset Management, LLC | 600 | 21 | ||||||
| 2025-05-09 | 13F | Pnc Financial Services Group, Inc. | 0 | -100.00 | 0 | -100.00 | ||||
| 2025-07-24 | 13F | Cyndeo Wealth Partners, LLC | 385,551 | 205.69 | 13,799 | 33.10 | ||||
| 2025-08-14 | 13F | Sunbelt Securities, Inc. | 0 | -100.00 | 0 | |||||
| 2025-04-29 | 13F | Element Wealth, LLC | 0 | -100.00 | 0 | |||||
| 2025-08-14 | 13F | Q Fund Management (Hong Kong) Ltd | 24,000 | 200.00 | 859 | 30.59 | ||||
| 2025-04-29 | 13F | Hm Payson & Co | 30 | 0.00 | 2 | 0.00 | ||||
| 2025-08-08 | 13F | Creative Planning | 54,938 | 199.73 | 1,966 | 30.54 | ||||
| 2025-04-17 | 13F | Dynamic Advisor Solutions LLC | 0 | -100.00 | 0 | |||||
| 2025-07-17 | 13F | Mustard Seed Financial, LLC | 37,791 | 183.95 | 1,353 | 23.58 | ||||
| 2025-08-11 | 13F | NewEdge Wealth, LLC | 32,781 | 191.33 | 1,282 | 38.64 | ||||
| 2025-07-30 | 13F | ARK Investment Management LLC | 6,622,008 | 130.77 | 237,002 | 0.48 | ||||
| 2025-08-11 | 13F | Elequin Capital Lp | 280,830 | 94,138.26 | 10,051 | 41,775.00 | ||||
| 2025-09-04 | 13F/A | Advisor Group Holdings, Inc. | 2,754 | 225.15 | 99 | 42.03 | ||||
| 2025-08-04 | 13F | Grant Street Asset Management, Inc. | 9,000 | 322 | ||||||
| 2025-08-06 | 13F | Commonwealth Equity Services, Llc | 57,587 | 172.83 | 2 | 100.00 | ||||
| 2025-04-24 | 13F | Decker Retirement Planning Inc. | 0 | -100.00 | 0 | |||||
| 2025-07-11 | 13F | OxenFree Capital LLC | 24,990 | 200.00 | 894 | 23.14 | ||||
| 2025-08-14 | 13F | Paragon Private Wealth Management, LLC | 15,487 | 135.76 | 554 | 2.78 | ||||
| 2025-07-23 | 13F | MADDEN SECURITIES Corp | 221,784 | 211.11 | 7,938 | 35.47 | ||||
| 2025-08-14 | 13F | Wealth Preservation Advisors, LLC | 31,749 | 214.88 | 1,136 | 37.20 | ||||
| 2025-08-14 | 13F | Citadel Advisors Llc | 194,250 | 455.25 | 6,952 | 141.81 | ||||
| 2025-08-11 | 13F | Rpo Llc | 77,070 | 315.70 | 2,758 | 81.09 | ||||
| 2025-08-14 | 13F | Citadel Advisors Llc | Call | 340,700 | 143.18 | 12,194 | 5.88 | |||
| 2025-07-28 | 13F | Kiker Wealth Management, LLC | 900 | 200.00 | 32 | 33.33 | ||||
| 2025-08-01 | 13F | Koss-Olinger Consulting, LLC | 60,000 | 2,147 | ||||||
| 2025-08-14 | 13F | Wells Fargo & Company/mn | 1 | 0.00 | 0 | |||||
| 2025-07-15 | 13F | Missouri Trust & Investment Co | 300 | 200.00 | 11 | 25.00 | ||||
| 2025-08-05 | 13F | Chase Investment Counsel Corp | 44,676 | 200.00 | 2 | 0.00 | ||||
| 2025-07-23 | 13F | Richardson Capital Management LLC | 7,647 | 200.00 | 274 | 30.62 | ||||
| 2025-08-07 | 13F | Encompass More Asset Management | 6,745 | 241 | ||||||
| 2025-08-14 | 13F | Farringdon Capital, Ltd. | 128,870 | 195.65 | 4,612 | 28.75 | ||||
| 2025-08-14 | 13F | Susquehanna International Group, Llp | 999,300 | 4,565.27 | 35,765 | 1,932.05 | ||||
| 2025-08-14 | 13F | Susquehanna International Group, Llp | Put | 175,400 | 790.36 | 6,278 | 287.71 | |||
| 2025-08-14 | 13F | Susquehanna International Group, Llp | Call | 352,600 | 316.29 | 12,620 | 81.26 | |||
| 2025-08-14 | 13F | Verition Fund Management LLC | 150,000 | 200.00 | 5,368 | 30.61 | ||||
| 2025-08-18 | 13F | Hollencrest Capital Management | 6,300 | 200.00 | 225 | 30.81 | ||||
| 2025-08-05 | 13F | Optivise Advisory Services LLC | 10,519 | 161.34 | 376 | 13.94 | ||||
| 2025-07-25 | 13F | Concurrent Investment Advisors, LLC | 127,579 | 157.87 | 4,566 | 12.30 | ||||
| 2025-05-14 | 13F | Flow Traders U.s. Llc | 0 | -100.00 | 0 | |||||
| 2025-05-16 | 13F | Jones Financial Companies Lllp | 0 | -100.00 | 0 | |||||
| 2025-07-23 | 13F | Indiana Trust & Investment Management CO | 2,610 | 200.00 | 93 | 30.99 | ||||
| 2025-08-14 | 13F | Millennium Management Llc | 4,228,533 | 206.81 | 151,339 | 33.58 | ||||
| 2025-07-28 | 13F | Axxcess Wealth Management, Llc | 26,213 | 161.82 | 938 | 14.11 | ||||
| 2025-08-15 | 13F | CI Private Wealth, LLC | 11,645 | 417 | ||||||
| 2025-08-12 | 13F | Virtu Financial LLC | 193,212 | 7 | ||||||
| 2025-08-13 | 13F/A | Claudia M.p. Batlle, Crp (r) Llc | 10,000 | 358 | ||||||
| 2025-08-06 | 13F | Vestmark Advisory Solutions, Inc. | 15,750 | 445.74 | 564 | 137.55 | ||||
| 2025-08-05 | 13F | Carolinas Wealth Consulting Llc | 0 | -100.00 | 0 | |||||
| 2025-08-05 | 13F | Harel Insurance Investments & Financial Services Ltd. | 661 | 0 | ||||||
| 2025-08-13 | 13F | Brown Advisory Inc | 30,525 | 200.00 | 1,092 | 30.62 | ||||
| 2025-07-31 | 13F | Buckingham Strategic Partners | 7,152 | 256 | ||||||
| 2025-08-05 | 13F | Simplex Trading, Llc | 200,964 | 230.32 | 7 | 40.00 | ||||
| 2025-07-10 | 13F | Oliver Lagore Vanvalin Investment Group | 0 | -100.00 | 0 | |||||
| 2025-08-05 | 13F | Bank Of Montreal /can/ | 15,950 | -69.52 | 571 | -86.75 | ||||
| 2025-08-12 | 13F | Centric Wealth Management | 5,226 | 202 | ||||||
| 2025-08-01 | 13F | Envestnet Asset Management Inc | 157,818 | 157.47 | 5,648 | 12.11 | ||||
| 2025-08-13 | 13F | Lauer Wealth, LLC | 9,600 | 276.47 | 380 | 56.61 | ||||
| 2025-08-13 | 13F | Walleye Trading LLC | Put | 5,400 | 1,700.00 | 193 | 704.17 | |||
| 2025-08-14 | 13F | Modern Wealth Management, LLC | 27,189 | 294.56 | 973 | 71.91 | ||||
| 2025-08-13 | 13F | Walleye Trading LLC | Call | 1,500 | 150.00 | 54 | 8.16 | |||
| 2025-08-13 | 13F | Lido Advisors, LLC | 16,573 | 272.34 | 593 | 62.47 | ||||
| 2025-08-08 | 13F | Empower Advisory Group, LLC | 8,946 | 172.49 | 320 | 18.96 | ||||
| 2025-08-13 | 13F | Walleye Trading LLC | 1,077 | -83.58 | 39 | -92.95 | ||||
| 2025-08-14 | 13F | Vivaldi Capital Management, LLC | 25,086 | 54.58 | 898 | -32.71 | ||||
| 2025-08-15 | 13F | Morgan Stanley | 29,218 | 137.78 | 1,046 | 3.47 | ||||
| 2025-08-07 | 13F | Kestra Private Wealth Services, Llc | 9,315 | 127.14 | 333 | -1.19 | ||||
| 2025-05-14 | 13F | Walleye Capital LLC | 0 | -100.00 | 0 | |||||
| 2025-07-25 | 13F | Meritage Portfolio Management | 27,351 | 200.00 | 979 | 30.57 | ||||
| 2025-08-14 | 13F | Raymond James Financial Inc | 1,767 | 63 | ||||||
| 2025-08-14 | 13F | Freedom Financial Partners LLC | 50,575 | 195.73 | 1,810 | 28.83 | ||||
| 2025-07-24 | 13F | IFP Advisors, Inc | 6 | 0 | ||||||
| 2025-07-31 | 13F | Richards, Merrill & Peterson, Inc. | 0 | -100.00 | 0 | |||||
| 2025-05-09 | 13F | CoreCap Advisors, LLC | 0 | -100.00 | 0 | |||||
| 2025-05-07 | 13F | Nkcfo Llc | 0 | -100.00 | 0 | |||||
| 2025-08-11 | 13F | EMC Capital Management | 0 | -100.00 | 0 | |||||
| 2025-08-13 | 13F | Aristides Capital LLC | 195,030 | 200.00 | 6,980 | 30.64 | ||||
| 2025-07-17 | 13F | Avondale Wealth Management | 9,119 | 199.97 | 326 | 30.92 | ||||
| 2025-08-14 | 13F | Vienna Asset Management LLC | 6,111 | 219 | ||||||
| 2025-08-08 | 13F | Advyzon Investment Management, LLC | 14,731 | 47.47 | 527 | -35.81 | ||||
| 2025-08-14 | 13F | Comerica Bank | 482 | 46.50 | 17 | -37.04 | ||||
| 2025-08-15 | 13F | Kestra Advisory Services, LLC | 89,512 | 209.38 | 3,204 | 34.69 | ||||
| 2025-08-18 | 13F/A | Apollo Management Holdings, L.P. | 1,275,000 | 13.84 | 45,632 | -50.43 | ||||
| 2025-07-15 | 13F | Surience Private Wealth Llc | 38,375 | 642.84 | 1,373 | 223.82 | ||||
| 2025-08-12 | 13F | Vestor Capital, Llc | 619,370 | 18 | ||||||
| 2025-07-30 | 13F | Avidian Wealth Solutions, LLC | 11,037 | 200.00 | 395 | 30.79 | ||||
| 2025-07-08 | 13F | Nbc Securities, Inc. | 1,155 | 200.00 | 0 | |||||
| 2025-08-15 | 13F | First Heartland Consultants, Inc. | 17,663 | 215.81 | 632 | 37.69 | ||||
| 2025-07-15 | 13F | Garrett Investment Advisors LLC | 6,858 | 245 | ||||||
| 2025-08-14 | 13F | GWM Advisors LLC | 50,024 | 219.19 | 1,790 | 38.98 | ||||
| 2025-08-14 | 13F | Fmr Llc | 0 | -100.00 | 0 | |||||
| 2025-07-17 | 13F | Venture Visionary Partners LLC | 36,705 | 169.41 | 1,314 | 17.34 | ||||
| 2025-07-25 | 13F | NorthRock Partners, LLC | 11,795 | 204.78 | 422 | 32.39 | ||||
| 2025-07-09 | 13F | Pallas Capital Advisors LLC | 9,335 | 182.37 | 334 | 23.25 | ||||
| 2025-08-14 | 13F | Arete Wealth Advisors, LLC | 18,671 | 203.00 | 1 | |||||
| 2025-08-19 | 13F | Advisory Services Network, LLC | 24,299 | 363.54 | 942 | 119.07 | ||||
| 2025-07-16 | 13F | American National Bank | 315 | 200.00 | 11 | 37.50 | ||||
| 2025-08-12 | 13F | LPL Financial LLC | 59,458 | 149.46 | 2,128 | 8.63 | ||||
| 2025-08-08 | 13F | Everett Harris & Co /ca/ | 6,000 | 215 | ||||||
| 2025-08-14 | 13F | Jane Street Group, Llc | 11,436,418 | 128.36 | 409,309 | -0.57 | ||||
| 2025-08-14 | 13F | Jane Street Group, Llc | Put | 48,800 | 269.70 | 1,747 | 60.92 | |||
| 2025-07-15 | 13F | Cordant, Inc. | 0 | -100.00 | 0 | |||||
| 2025-08-14 | 13F | Jane Street Group, Llc | Call | 163,900 | 527.97 | 5,866 | 173.43 | |||
| 2025-07-17 | 13F | Campion Asset Management LLC | 0 | -100.00 | 0 | |||||
| 2025-08-14 | 13F | Headlands Technologies LLC | 100 | -93.56 | 4 | -97.64 | ||||
| 2025-08-13 | 13F | StoneX Group Inc. | 0 | -100.00 | 0 | -100.00 | ||||
| 2025-07-30 | 13F | Strategic Blueprint, LLC | 106,629 | 209.46 | 3,816 | 34.75 | ||||
| 2025-08-08 | 13F | Citizens Financial Group Inc/ri | 27,573 | 200.00 | 987 | 30.60 | ||||
| 2025-07-16 | 13F | Perigon Wealth Management, LLC | 16,047 | 246.89 | 574 | 51.05 | ||||
| 2025-07-30 | 13F | Fogel Capital Management, Inc. | 7,950 | 200.00 | 285 | 30.88 | ||||
| 2025-08-12 | 13F | Cornerstone Select Advisors, LLC | 7,509 | 183.25 | 269 | 23.50 | ||||
| 2025-07-02 | 13F | HBW Advisory Services LLC | 34,555 | 202.82 | 1,237 | 31.91 | ||||
| 2025-08-15 | 13F | ROSS\JOHNSON & Associates LLC | 3,474 | 200.00 | 124 | 30.53 | ||||
| 2025-08-06 | 13F | First Horizon Advisors, Inc. | 4,255 | 77.14 | 152 | -22.84 | ||||
| 2025-07-23 | 13F | Castle Rock Wealth Management, LLC | 83,580 | 209.34 | 3,270 | 42.30 | ||||
| 2025-08-14 | 13F | Kerrisdale Advisers, LLC | 0 | -100.00 | 0 | |||||
| 2025-07-25 | 13F | We Are One Seven, LLC | 6,060 | 126.97 | 217 | -1.37 | ||||
| 2025-07-28 | 13F | RFG Advisory, LLC | 9,642 | 205.80 | 345 | 33.20 | ||||
| 2025-08-13 | 13F | Cresset Asset Management, LLC | 121,101 | 208.43 | 4,334 | 34.30 | ||||
| 2025-07-14 | 13F | UMA Financial Services, Inc. | 300 | 200.00 | 11 | 25.00 | ||||
| 2025-07-11 | 13F | Farther Finance Advisors, LLC | 180 | 21.62 | 6 | -50.00 | ||||
| 2025-07-21 | 13F | Rainey & Randall Investment Management Inc. | 22,074 | 200.00 | 790 | 30.79 | ||||
| 2025-08-14 | 13F | DRW Securities, LLC | 114,802 | 182.63 | 4,109 | 23.07 | ||||
| 2025-07-14 | 13F | Painted Porch Advisors LLC | 1,425 | 200.00 | 51 | 30.77 | ||||
| 2025-08-08 | 13F | Larson Financial Group LLC | 6 | 200.00 | 0 | |||||
| 2025-08-05 | 13F | Dunhill Financial, LLC | 0 | -100.00 | 0 | |||||
| 2025-08-14 | 13F | Bank Of America Corp /de/ | 3,459 | 3,359.00 | 124 | 1,437.50 | ||||
| 2025-07-25 | 13F | Midwest Capital Advisors, LLC | 165 | 6 | ||||||
| 2025-08-14 | 13F | Mml Investors Services, Llc | 17,701 | 250.72 | 1 | |||||
| 2025-08-13 | 13F | Hbk Investments L P | 3,267,144 | 299.81 | 116,931 | 74.08 | ||||
| 2025-08-14 | 13F | Cantor Fitzgerald, L. P. | 21,175 | 211.63 | 758 | 35.66 | ||||
| 2025-07-16 | 13F | Dakota Wealth Management | 188,001 | 200.00 | 6,729 | 30.62 | ||||
| 2025-04-21 | 13F | ORG Partners LLC | 0 | -100.00 | 0 | |||||
| 2025-07-07 | 13F | Global Wealth Strategies & Associates | 621 | 200.00 | 22 | 29.41 | ||||
| 2025-08-11 | 13F | Anfield Capital Management, LLC | 150 | 200.00 | 5 | 25.00 | ||||
| 2025-08-12 | 13F | One Charles Private Wealth Services, LLC | 91,764 | 198.90 | 3,284 | 30.16 | ||||
| 2025-07-22 | 13F | Beacon Financial Advisory LLC | 16,233 | 205.30 | 581 | 32.72 | ||||
| 2025-07-22 | 13F | Merit Financial Group, LLC | 10,614 | 223.50 | 380 | 40.89 | ||||
| 2025-08-12 | 13F | Wisconsin Wealth Advisors, LLC | 38,132 | 209.56 | 1,365 | 34.78 | ||||
| 2025-08-11 | 13F | TD Waterhouse Canada Inc. | 1,500 | 200.00 | 54 | 26.19 | ||||
| 2025-08-14 | 13F | Mariner, LLC | 50,493 | 166.20 | 1,807 | 15.91 | ||||
| 2025-08-14 | 13F | Royal Bank Of Canada | 420 | 23.53 | 15 | -46.43 | ||||
| 2025-06-25 | NP | ARKW - ARK Next Generation Internet ETF | 1,636,584 | -24.66 | 153,659 | -30.20 | ||||
| 2025-08-13 | 13F | Renaissance Technologies Llc | 163,800 | 5,862 | ||||||
| 2025-08-14 | 13F | Benjamin Edwards Inc | 150,754 | 162.70 | 5,395 | 14.37 | ||||
| 2025-07-15 | 13F | BCS Wealth Management | 5,985 | 0 | ||||||
| 2025-08-11 | 13F | TRUE Private Wealth Advisors | 6,900 | 247 | ||||||
| 2025-07-30 | 13F | Brookstone Capital Management | 7,788 | 279 | ||||||
| 2025-08-13 | 13F | Financial & Tax Architects, LLC | 5,688 | 204 | ||||||
| 2025-08-08 | 13F | Foundations Investment Advisors, LLC | 10,311 | 320.34 | 369 | 83.58 | ||||
| 2025-08-13 | 13F | EverSource Wealth Advisors, LLC | 30,403 | 246.28 | 1,088 | 50.90 | ||||
| 2025-08-01 | 13F | Belvedere Trading LLC | 0 | -100.00 | 0 | |||||
| 2025-08-13 | 13F | Kaleidoscope Capital Lp | 674,568 | 444.87 | 24,143 | 137.24 | ||||
| 2025-07-16 | 13F | Strategic Investment Solutions, Inc. /IL | 0 | -100.00 | 0 | |||||
| 2025-08-07 | 13F | Allworth Financial LP | 942 | 96.25 | 34 | -25.00 | ||||
| 2025-08-18 | 13F | N.E.W. Advisory Services LLC | 72 | -34.55 | 3 | -77.78 | ||||
| 2025-08-14 | 13F | First Foundation Advisors | 6,030 | 216 | ||||||
| 2025-08-01 | 13F | Belvedere Trading LLC | Call | 0 | -100.00 | 0 | ||||
| 2025-08-12 | 13F | Global Retirement Partners, LLC | 801 | 102.78 | 29 | -22.22 | ||||
| 2025-08-01 | 13F | Belvedere Trading LLC | Put | 0 | -100.00 | 0 | ||||
| 2025-07-21 | 13F | Ameritas Advisory Services, LLC | 528 | 19 | ||||||
| 2025-08-11 | 13F | Gr Financial Group, Llc | 0 | -100.00 | 0 | |||||
| 2025-08-12 | 13F | CIBC Private Wealth Group, LLC | 228 | 200.00 | 8 | 60.00 | ||||
| 2025-08-13 | 13F | Jump Financial, LLC | 21,780 | 780 | ||||||
| 2025-05-06 | 13F | Venturi Wealth Management, LLC | 0 | -100.00 | 0 | |||||
| 2025-05-15 | 13F | Wolverine Trading, Llc | Call | 0 | -100.00 | 0 | ||||
| 2025-07-22 | 13F | Wealthcare Advisory Partners LLC | 79,351 | 197.56 | 2,840 | 29.52 | ||||
| 2025-07-31 | 13F/A | Interchange Capital Partners, LLC | 24,918 | 131.11 | 892 | 0.56 | ||||
| 2025-08-11 | 13F | Landaas & Co /wi /adv | 8,987 | 322 | ||||||
| 2025-08-07 | 13F | CENTRAL TRUST Co | 1,917 | 200.00 | 69 | 30.77 | ||||
| 2025-07-31 | 13F | Cambridge Investment Research Advisors, Inc. | 122,468 | 198.46 | 4 | 33.33 | ||||
| 2025-08-12 | 13F | Steward Partners Investment Advisory, Llc | 0 | -100.00 | 0 | |||||
| 2025-08-04 | 13F | Impact Partnership Wealth, LLC | 0 | -100.00 | 0 | |||||
| 2025-07-22 | 13F | Belpointe Asset Management LLC | 64,998 | 197.13 | 2,326 | 29.37 | ||||
| 2025-08-14 | 13F | Schonfeld Strategic Advisors LLC | 3,326,587 | 1,227.83 | 119,059 | 478.15 | ||||
| 2025-08-14 | 13F | Visionary Wealth Advisors | 6,157 | 220 | ||||||
| 2025-07-10 | 13F | Wealth Enhancement Advisory Services, Llc | 16,435 | 166.80 | 597 | 17.98 | ||||
| 2025-06-30 | NP | BLKC - Invesco Alerian Galaxy Blockchain Users and Decentralized Commerce ETF This fund is a listed as child fund of Invesco Ltd. and if that institution has disclosed ownership in this security, then these positions will not be double counted when calculating total shares and total value | 203 | -14.35 | 19 | -20.83 | ||||
| 2025-06-30 | NP | SATO - Invesco Alerian Galaxy Crypto Economy ETF This fund is a listed as child fund of Invesco Ltd. and if that institution has disclosed ownership in this security, then these positions will not be double counted when calculating total shares and total value | 624 | -23.34 | 59 | -29.27 | ||||
| 2025-07-22 | 13F | IMC-Chicago, LLC | 25,677 | 88.52 | 919 | -17.96 | ||||
| 2025-08-12 | 13F | MAI Capital Management | 15,418 | 227.90 | 552 | 42.75 | ||||
| 2025-07-23 | 13F | Meitav Dash Investments Ltd | 61,114 | 397.10 | 2,187 | 116.53 | ||||
| 2025-07-14 | 13F | AdvisorNet Financial, Inc | 27,360 | 114.57 | 979 | -6.58 | ||||
| 2025-08-12 | 13F | Proequities, Inc. | 0 | 0 | ||||||
| 2025-08-08 | 13F | United Asset Strategies, Inc. | 13,965 | 200.00 | 500 | 30.63 |