Mga Batayang Estadistika
| Pemilik Institusional | 89 total, 85 long only, 0 short only, 4 long/short - change of 0.00% MRQ |
| Alokasi Portofolio Rata-rata | 0.2415 % - change of -3.63% MRQ |
| Saham Institusional (Jangka Panjang) | 19,212,126 (ex 13D/G) - change of 2.39MM shares 14.23% MRQ |
| Nilai Institusional (Jangka Panjang) | $ 322,967 USD ($1000) |
Kepemilikan Institusional dan Pemegang Saham
Banco BBVA Argentina S.A. - Depositary Receipt (Common Stock) (US:BBAR) memiliki 89 pemilik institusional dan pemegang saham yang telah mengajukan formulir 13D/G atau 13F kepada Komisi Bursa Efek (Securities Exchange Commission/SEC). Lembaga-lembaga ini memegang total 19,212,126 saham. Pemegang saham terbesar meliputi PointState Capital LP, MIRAE ASSET GLOBAL ETFS HOLDINGS Ltd., ARGT - Global X MSCI Argentina ETF, Samlyn Capital, Llc, Fourth Sail Capital LP, Morgan Stanley, Arrowstreet Capital, Limited Partnership, Ping Capital Management, Inc., Millennium Management Llc, and Brevan Howard Capital Management LP .
Struktur kepemilikan institusional Banco BBVA Argentina S.A. - Depositary Receipt (Common Stock) (NYSE:BBAR) menunjukkan posisi terkini di perusahaan oleh institusi dan dana, serta perubahan terbaru dalam ukuran posisi. Pemegang saham utama dapat mencakup investor individu, reksa dana, dana lindung nilai, atau institusi. Jadwal 13D menunjukkan bahwa investor memegang (atau pernah memegang) lebih dari 5% saham perusahaan dan bermaksud (atau pernah bermaksud) untuk secara aktif mengejar perubahan strategi bisnis. Jadwal 13G menunjukkan investasi pasif lebih dari 5%.
The share price as of September 5, 2025 is 12.33 / share. Previously, on September 9, 2024, the share price was 11.06 / share. This represents an increase of 11.48% over that period.

Skor Sentimen Dana
Skor Sentimen Dana (sebelumnya dikenal sebagai Skor Akumulasi Kepemilikan) menemukan saham-saham yang paling banyak dibeli oleh dana. Ini adalah hasil dari model kuantitatif multi-faktor yang canggih yang mengidentifikasi perusahaan dengan tingkat akumulasi institusional tertinggi. Model penilaian menggunakan kombinasi dari total peningkatan pemilik yang diungkapkan, perubahan dalam alokasi portofolio pada pemilik tersebut, dan metrik lainnya. Angka berkisar dari 0 hingga 100, dengan angka yang lebih tinggi menunjukkan tingkat akumulasi yang lebih tinggi dibandingkan dengan perusahaan sejenisnya, dan 50 adalah rata-ratanya.
Frekuensi Pembaruan: Setiap Hari
Lihat Ownership Explorer, yang menyediakan daftar perusahaan dengan peringkat tertinggi.
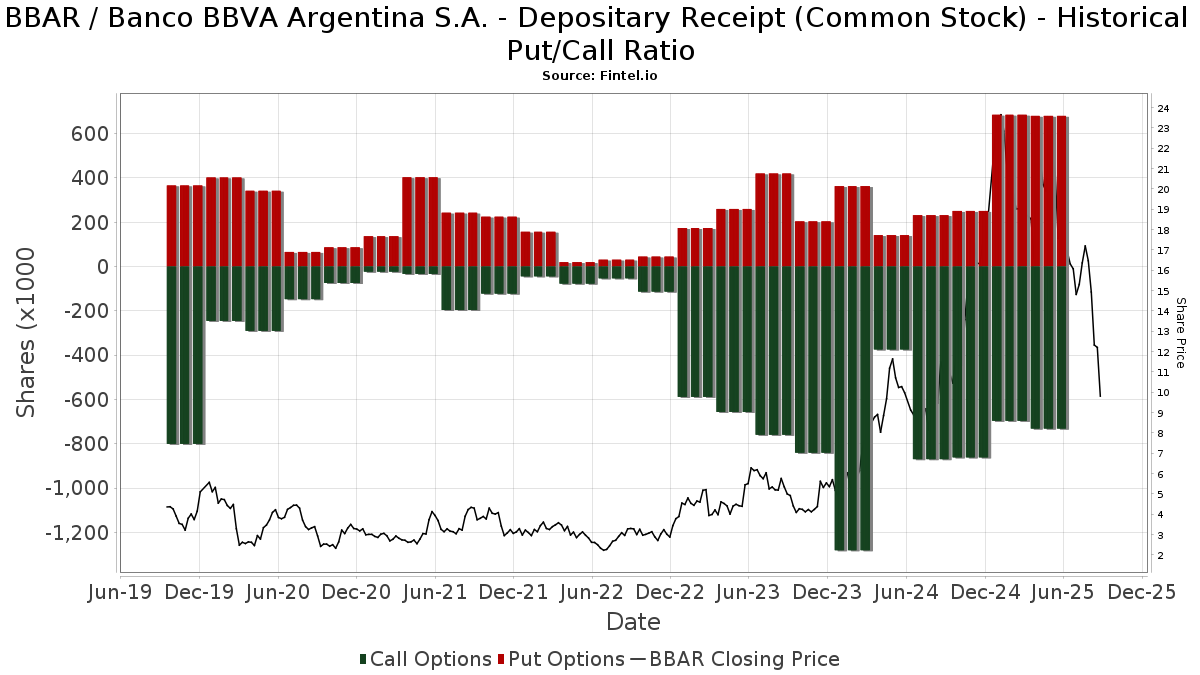
Rasio Put/Call Institusional
Selain melaporkan isu ekuitas dan utang standar, institusi dengan aset di bawah manajemen lebih dari 100 juta dolar AS juga harus mengungkapkan kepemilikan opsi put dan call mereka. Karena opsi put umumnya menunjukkan sentimen negatif, dan opsi call menunjukkan sentimen positif, kita dapat mengetahui sentimen institusional secara keseluruhan dengan memplot rasio put terhadap call. Grafik di sebelah kanan memplot rasio put/call historis untuk instrumen ini.
Menggunakan Rasio Put/Call sebagai indikator sentimen investor mengatasi salah satu kekurangan utama dari penggunaan total kepemilikan institusional, yaitu sejumlah besar aset yang dikelola diinvestasikan secara pasif untuk melacak indeks. Dana yang dikelola secara pasif biasanya tidak membeli opsi, sehingga indikator rasio put/call lebih akurat dalam melacak sentimen dana yang dikelola secara aktif.
Pengajuan 13F dan NPORT
Detail pada pengajuan 13F tersedia gratis. Detail pada pengajuan NP memerlukan keanggotaan premium. Baris berwarna hijau menunjukkan posisi baru. Baris berwarna merah menunjukkan posisi yang sudah ditutup. Klik tautan ini ikon untuk melihat riwayat transaksi selengkapnya.
Tingkatkan
untuk membuka data premium dan mengekspor ke Excel ![]() .
.
| Tanggal File | Sumber | Investor | Ketik | Presyo ng Avg (Silangan) |
Saham | Δ Saham (%) |
Dilaporkan Nilai ($1000) |
Nilai Δ (%) |
Alokasi Port (%) |
|
|---|---|---|---|---|---|---|---|---|---|---|
| 2025-07-29 | 13F | William Blair Investment Management, Llc | 333,654 | 6.47 | 5,492 | -3.29 | ||||
| 2025-08-14 | 13F | Ubs Oconnor Llc | 192,490 | 3,168 | ||||||
| 2025-08-14 | 13F | Engineers Gate Manager LP | 41,105 | -36.81 | 677 | -42.61 | ||||
| 2025-08-13 | 13F | Mirabella Financial Services Llp | 0 | -100.00 | 0 | |||||
| 2025-07-30 | NP | APIE - ActivePassive International Equity ETF | 13,701 | 21.65 | 269 | 333.87 | ||||
| 2025-08-20 | NP | WXCIX - William Blair Emerging Markets ex China Growth Fund Class I | 10,235 | -0.26 | 168 | -9.19 | ||||
| 2025-08-06 | 13F | Fox Run Management, L.l.c. | 0 | -100.00 | 0 | |||||
| 2025-08-14 | 13F | Two Sigma Investments, Lp | 59,656 | 8.94 | 982 | -1.11 | ||||
| 2025-07-10 | 13F | Redhawk Wealth Advisors, Inc. | 52,270 | 2.51 | 860 | -6.83 | ||||
| 2025-05-09 | 13F | R Squared Ltd | 0 | -100.00 | 0 | |||||
| 2025-05-15 | 13F | Aqr Capital Management Llc | 0 | -100.00 | 0 | |||||
| 2025-07-31 | 13F | Glass Jacobson Investment Advisors llc | 0 | -100.00 | 0 | |||||
| 2025-07-25 | 13F | NorthRock Partners, LLC | 34,998 | -0.01 | 576 | -9.15 | ||||
| 2025-08-14 | 13F | D. E. Shaw & Co., Inc. | 247,046 | -0.62 | 4,066 | -9.72 | ||||
| 2025-08-14 | 13F | Cubist Systematic Strategies, LLC | 145,133 | -50.45 | 2,389 | -55.00 | ||||
| 2025-05-15 | 13F | Discovery Capital Management, Llc / Ct | 0 | -100.00 | 0 | -100.00 | ||||
| 2025-07-29 | NP | BLUIX - BLUEPRINT GROWTH FUND Institutional Class | 20,235 | 398 | ||||||
| 2025-07-09 | 13F | Crocodile Capital Partners GmbH | 40,000 | 0.00 | 658 | -9.12 | ||||
| 2025-05-28 | NP | BESIX - William Blair Emerging Markets Small Cap Growth Fund Class I | 0 | -100.00 | 0 | -100.00 | ||||
| 2025-08-14 | 13F | FIL Ltd | 0 | -100.00 | 0 | |||||
| 2025-08-14 | 13F | Banco BTG Pactual S.A. | 12,000 | -40.00 | 198 | -45.58 | ||||
| 2025-08-15 | 13F | Tower Research Capital LLC (TRC) | 2,236 | 2,229.17 | 37 | 3,500.00 | ||||
| 2025-08-15 | 13F | WealthCollab, LLC | 1,909 | 0.00 | 31 | -8.82 | ||||
| 2025-08-13 | 13F | Marshall Wace, Llp | 116,908 | -73.10 | 1,924 | -75.57 | ||||
| 2025-08-25 | NP | EITEX - Parametric Tax-Managed Emerging Markets Fund Institutional Class | 11,711 | 0.00 | 193 | -9.43 | ||||
| 2025-08-14 | 13F | Susquehanna International Group, Llp | Put | 473,100 | -16.21 | 7,787 | -23.88 | |||
| 2025-08-14 | 13F | GWM Advisors LLC | 563 | -97.70 | 9 | -97.97 | ||||
| 2025-08-14 | 13F | Susquehanna International Group, Llp | Call | 317,700 | -18.01 | 5,229 | -25.52 | |||
| 2025-08-07 | 13F | Fourth Sail Capital LP | 1,786,085 | 29,399 | ||||||
| 2025-08-14 | 13F | Hrt Financial Lp | 0 | -100.00 | 0 | |||||
| 2025-08-14 | 13F | PointState Capital LP | 3,691,574 | 10.31 | 60,763 | 0.20 | ||||
| 2025-07-18 | 13F | Truist Financial Corp | 13,651 | 0.11 | 225 | -9.31 | ||||
| 2025-08-14 | 13F | 10Elms LLP | 2,000 | 0.00 | 33 | -11.11 | ||||
| 2025-07-31 | 13F | Caitong International Asset Management Co., Ltd | 301 | 410.17 | 5 | 300.00 | ||||
| 2025-07-21 | 13F | Ping Capital Management, Inc. | 745,900 | 6.51 | 12,278 | -3.25 | ||||
| 2025-08-13 | 13F | Northwestern Mutual Wealth Management Co | 0 | -100.00 | 0 | |||||
| 2025-08-14 | 13F | TCG Advisory Services, LLC | 16,072 | 2.58 | 265 | -6.71 | ||||
| 2025-07-23 | 13F | Clear Creek Financial Management, LLC | 35,629 | 51.84 | 586 | 37.88 | ||||
| 2025-08-14 | 13F | Millennium Management Llc | 692,231 | 101.85 | 11,394 | 83.36 | ||||
| 2025-07-16 | 13F | ABS Direct Equity Fund LLC | 27,665 | -9.05 | 455 | -17.42 | ||||
| 2025-08-12 | 13F | Jpmorgan Chase & Co | 177,455 | 171.78 | 2,921 | 146.83 | ||||
| 2025-06-27 | NP | ARGT - Global X MSCI Argentina ETF This fund is a listed as child fund of Mirae Asset Global Investments Co., Ltd. and if that institution has disclosed ownership in this security, then these positions will not be double counted when calculating total shares and total value | 1,824,860 | -9.19 | 36,880 | -16.01 | ||||
| 2025-08-14 | 13F | Bnp Paribas Arbitrage, Sa | 15,301 | 123.34 | 252 | 102.42 | ||||
| 2025-08-15 | 13F | Morgan Stanley | 1,096,043 | 135.37 | 18,041 | 113.82 | ||||
| 2025-08-12 | 13F | LPL Financial LLC | 0 | -100.00 | 0 | |||||
| 2025-08-14 | 13F | Federation des caisses Desjardins du Quebec | 1,415 | 23 | ||||||
| 2025-07-09 | 13F | Systrade AG | 30,000 | -40.24 | 494 | -45.76 | ||||
| 2025-06-23 | NP | Global Macro Portfolio - Global Macro Portfolio | 37,182 | 1.31 | 751 | -6.24 | ||||
| 2025-08-14 | 13F | Gemsstock Ltd. | 231,274 | -4.14 | 3,807 | -12.93 | ||||
| 2025-08-14 | 13F | MIRAE ASSET GLOBAL ETFS HOLDINGS Ltd. | 2,021,521 | 9.78 | 33,274 | -0.27 | ||||
| 2025-08-12 | 13F | XTX Topco Ltd | 0 | -100.00 | 0 | |||||
| 2025-08-08 | 13F | SBI Securities Co., Ltd. | 2,381 | 199.87 | 39 | 178.57 | ||||
| 2025-08-13 | 13F | Centiva Capital, LP | 20,887 | 344 | ||||||
| 2025-04-15 | 13F | Ameliora Wealth Management Ltd. | 0 | -100.00 | 0 | |||||
| 2025-08-14 | 13F | Verition Fund Management LLC | 98,301 | -50.85 | 1,618 | 168.77 | ||||
| 2025-08-14 | 13F | Jane Street Group, Llc | Put | 124,500 | 301.61 | 2,049 | 265.24 | |||
| 2025-08-01 | 13F | Belvedere Trading LLC | Put | 0 | -100.00 | 0 | -100.00 | |||
| 2025-08-14 | 13F | Jane Street Group, Llc | Call | 226,600 | 37.75 | 3,730 | 25.13 | |||
| 2025-08-04 | 13F | GAM Holding AG | 45,166 | 743 | ||||||
| 2025-08-14 | 13F | Glenorchy Capital Ltd | 276,920 | -3.12 | 4,558 | -11.99 | ||||
| 2025-06-23 | NP | Global Macro Absolute Return Advantage Portfolio - Global Macro Absolute Return Advantage Portfolio | 146,855 | 4.90 | 2,968 | -3.01 | ||||
| 2025-05-29 | NP | MCTOX - Modern Capital Tactical Opportunities Fund Class A Shares | 45,810 | -24.67 | 830 | -28.39 | ||||
| 2025-07-24 | 13F | Ronald Blue Trust, Inc. | 2,268 | 0.00 | 37 | -9.76 | ||||
| 2025-08-14 | 13F | Royal Bank Of Canada | 2,774 | -60.79 | 46 | -64.06 | ||||
| 2025-04-15 | 13F | SG Americas Securities, LLC | 0 | -100.00 | 0 | |||||
| 2025-08-12 | 13F | Proequities, Inc. | 0 | 0 | ||||||
| 2025-08-14 | 13F | Goldman Sachs Group Inc | 37,559 | -59.73 | 618 | -63.41 | ||||
| 2025-05-14 | 13F | Jump Financial, LLC | 0 | -100.00 | 0 | |||||
| 2025-08-14 | 13F | Raymond James Financial Inc | 0 | -100.00 | 0 | |||||
| 2025-08-13 | 13F | Arrowstreet Capital, Limited Partnership | 888,562 | -19.33 | 14,626 | -26.72 | ||||
| 2025-08-14 | 13F | Vident Advisory, LLC | 10,020 | -43.62 | 165 | -49.07 | ||||
| 2025-08-14 | 13F | Nwi Management Lp | 63,000 | 0.00 | 1 | 0.00 | ||||
| 2025-08-13 | 13F | Walleye Capital LLC | 0 | -100.00 | 0 | |||||
| 2025-08-14 | 13F | Wells Fargo & Company/mn | 5,035 | 11.00 | 83 | 0.00 | ||||
| 2025-07-10 | 13F | Baader Bank INC | 14,674 | -15.02 | 237 | -23.79 | ||||
| 2025-08-01 | 13F | Belvedere Trading LLC | Call | 14,000 | 0.00 | 230 | -9.09 | |||
| 2025-08-14 | 13F | Brevan Howard Capital Management LP | 514,724 | 6.04 | 8,810 | 0.16 | ||||
| 2025-08-14 | 13F | Bank Of America Corp /de/ | 60,156 | 229.87 | 990 | 200.00 | ||||
| 2025-06-10 | 13F/A | Militia Capital Partners, LP | 0 | -100.00 | 0 | -100.00 | ||||
| 2025-07-15 | 13F | Public Employees Retirement System Of Ohio | 91,391 | 0.00 | 1,504 | -9.18 | ||||
| 2025-04-22 | 13F | TT International Asset Management LTD | 0 | -100.00 | 0 | |||||
| 2025-08-12 | 13F | BlackRock, Inc. | 2 | 0.00 | 0 | |||||
| 2025-08-13 | 13F | Amundi | 0 | -100.00 | 0 | |||||
| 2025-08-14 | 13F | Aquatic Capital Management LLC | 0 | -100.00 | 0 | |||||
| 2025-08-06 | 13F | Commonwealth Equity Services, Llc | 13,609 | 0 | ||||||
| 2025-08-14 | 13F | Voloridge Investment Management, Llc | 62,907 | 1,035 | ||||||
| 2025-08-11 | 13F | Private Advisor Group, LLC | 12,246 | -0.77 | 202 | -9.87 | ||||
| 2025-08-13 | 13F | Quantbot Technologies LP | 6,378 | -60.60 | 105 | -64.51 | ||||
| 2025-08-14 | 13F | Benjamin Edwards Inc | 18,268 | -0.11 | 301 | -9.37 | ||||
| 2025-08-14 | 13F | Samlyn Capital, Llc | 1,824,244 | -1.53 | 30,027 | -10.55 | ||||
| 2025-08-13 | 13F | Channing Global Advisors, Llc | 25,470 | 419 | ||||||
| 2025-08-14 | 13F | UBS Group AG | 25,669 | -91.05 | 423 | -91.88 | ||||
| 2025-08-14 | 13F | UBS Group AG | Put | 53,100 | -25.73 | 874 | -32.51 | |||
| 2025-05-12 | 13F | Invesco Ltd. | 0 | -100.00 | 0 | |||||
| 2025-08-14 | 13F | Point72 Asset Management, L.P. | 148,000 | 121.56 | 2,436 | 101.32 | ||||
| 2025-08-14 | 13F | Susquehanna International Group, Llp | 237,968 | -1.82 | 3,917 | -10.82 | ||||
| 2025-08-08 | 13F | North of South Capital LLP | 30,000 | 0.00 | 494 | -9.21 | ||||
| 2025-05-15 | 13F | Hood River Capital Management LLC | 0 | -100.00 | 0 | |||||
| 2025-06-25 | NP | RPGAX - T. Rowe Price Global Allocation Fund, Inc. This fund is a listed as child fund of Price T Rowe Associates Inc /md/ and if that institution has disclosed ownership in this security, then these positions will not be double counted when calculating total shares and total value | 1,128 | -31.55 | 23 | -38.89 | ||||
| 2025-08-14 | 13F | Citadel Advisors Llc | Put | 29,700 | 64.09 | 489 | 49.24 | |||
| 2025-08-13 | 13F | EverSource Wealth Advisors, LLC | 549 | 9 | ||||||
| 2025-08-14 | 13F | Banque Transatlantique SA | 0 | -100.00 | 0 | |||||
| 2025-08-14 | 13F | Citadel Advisors Llc | 114,830 | -38.52 | 1,890 | -44.15 | ||||
| 2025-08-14 | 13F | Citadel Advisors Llc | Call | 173,100 | 32.24 | 2,849 | 20.16 | |||
| 2025-04-01 | NP | CVY - Invesco Zacks Multi-Asset Income ETF This fund is a listed as child fund of Invesco Ltd. and if that institution has disclosed ownership in this security, then these positions will not be double counted when calculating total shares and total value | 59,111 | -52.68 | 1,292 | -24.94 | ||||
| 2025-08-14 | 13F | Price T Rowe Associates Inc /md/ | 34,810 | 88.59 | 1 | |||||
| 2025-08-25 | NP | MAINSTAY VP FUNDS TRUST - MainStay VP Emerging Markets Equity Portfolio Initial Class | 0 | -100.00 | 0 | -100.00 | ||||
| 2025-07-09 | 13F | Byrne Asset Management LLC | 680 | 11 | ||||||
| 2025-05-08 | 13F | Gsa Capital Partners Llp | 0 | -100.00 | 0 | |||||
| 2025-04-23 | 13F | Spire Wealth Management | 0 | -100.00 | 0 | |||||
| 2025-06-24 | NP | MCYAX - MainStay Candriam Emerging Markets Equity Fund Class A | 20,000 | 404 | ||||||
| 2025-07-11 | 13F | Farther Finance Advisors, LLC | 109 | 0.00 | 2 | -50.00 | ||||
| 2025-07-18 | 13F | Deltec Asset Management Llc | 81,500 | -4.12 | 1,341 | -12.92 | ||||
| 2025-08-08 | 13F | Itau Unibanco Holding S.A. | 68,040 | -14.91 | 1,120 | 111,800.00 | ||||
| 2025-08-14 | 13F | Two Sigma Advisers, Lp | 58,910 | -12.34 | 970 | -20.38 | ||||
| 2025-08-08 | 13F | Candriam Luxembourg S.C.A. | 0 | -100.00 | 0 | |||||
| 2025-09-04 | 13F/A | Advisor Group Holdings, Inc. | 300 | 5 | ||||||
| 2025-04-30 | 13F | Sofos Investments, Inc. | 177 | 3 | ||||||
| 2025-06-23 | NP | Global Macro Capital Opportunities Portfolio - Global Macro Capital Opportunities Portfolio | 155,657 | 67.59 | 3,146 | 55.00 | ||||
| 2025-08-05 | 13F | Simplex Trading, Llc | 6,601 | 725.12 | 0 | |||||
| 2025-08-13 | 13F | Hsbc Holdings Plc | 58,121 | -32.85 | 965 | -39.56 | ||||
| 2025-07-25 | 13F | Legal Advantage Investments, Inc. | 24,000 | 0.00 | 395 | -8.99 | ||||
| 2025-08-14 | 13F | Jane Street Group, Llc | 0 | -100.00 | 0 | |||||
| 2025-07-16 | 13F | Signaturefd, Llc | 113 | 2 | ||||||
| 2025-07-29 | 13F | Activest Wealth Management | 69,990 | -2.44 | 1,152 | -11.32 | ||||
| 2025-07-14 | 13F | GAMMA Investing LLC | 4,486 | -15.41 | 74 | -23.96 |