Mga Batayang Estadistika
| Pemilik Institusional | 172 total, 170 long only, 0 short only, 2 long/short - change of -7.53% MRQ |
| Alokasi Portofolio Rata-rata | 0.2345 % - change of -8.02% MRQ |
| Saham Institusional (Jangka Panjang) | 22,343,460 (ex 13D/G) - change of -0.49MM shares -2.13% MRQ |
| Nilai Institusional (Jangka Panjang) | $ 186,580 USD ($1000) |
Kepemilikan Institusional dan Pemegang Saham
CION Investment Corporation (US:CION) memiliki 172 pemilik institusional dan pemegang saham yang telah mengajukan formulir 13D/G atau 13F kepada Komisi Bursa Efek (Securities Exchange Commission/SEC). Lembaga-lembaga ini memegang total 22,343,460 saham. Pemegang saham terbesar meliputi Bulldog Investors, LLP, Invesco Ltd., Van Eck Associates Corp, BIZD - VanEck Vectors BDC Income ETF, LPL Financial LLC, KBWD - Invesco KBW High Dividend Yield Financial ETF, Special Opportunities Fund, Inc., Cambridge Investment Research Advisors, Inc., Wells Fargo & Company/mn, and Private Advisor Group, LLC .
Struktur kepemilikan institusional CION Investment Corporation (NYSE:CION) menunjukkan posisi terkini di perusahaan oleh institusi dan dana, serta perubahan terbaru dalam ukuran posisi. Pemegang saham utama dapat mencakup investor individu, reksa dana, dana lindung nilai, atau institusi. Jadwal 13D menunjukkan bahwa investor memegang (atau pernah memegang) lebih dari 5% saham perusahaan dan bermaksud (atau pernah bermaksud) untuk secara aktif mengejar perubahan strategi bisnis. Jadwal 13G menunjukkan investasi pasif lebih dari 5%.
The share price as of September 5, 2025 is 10.25 / share. Previously, on September 6, 2024, the share price was 11.61 / share. This represents a decline of 11.71% over that period.

Skor Sentimen Dana
Skor Sentimen Dana (sebelumnya dikenal sebagai Skor Akumulasi Kepemilikan) menemukan saham-saham yang paling banyak dibeli oleh dana. Ini adalah hasil dari model kuantitatif multi-faktor yang canggih yang mengidentifikasi perusahaan dengan tingkat akumulasi institusional tertinggi. Model penilaian menggunakan kombinasi dari total peningkatan pemilik yang diungkapkan, perubahan dalam alokasi portofolio pada pemilik tersebut, dan metrik lainnya. Angka berkisar dari 0 hingga 100, dengan angka yang lebih tinggi menunjukkan tingkat akumulasi yang lebih tinggi dibandingkan dengan perusahaan sejenisnya, dan 50 adalah rata-ratanya.
Frekuensi Pembaruan: Setiap Hari
Lihat Ownership Explorer, yang menyediakan daftar perusahaan dengan peringkat tertinggi.
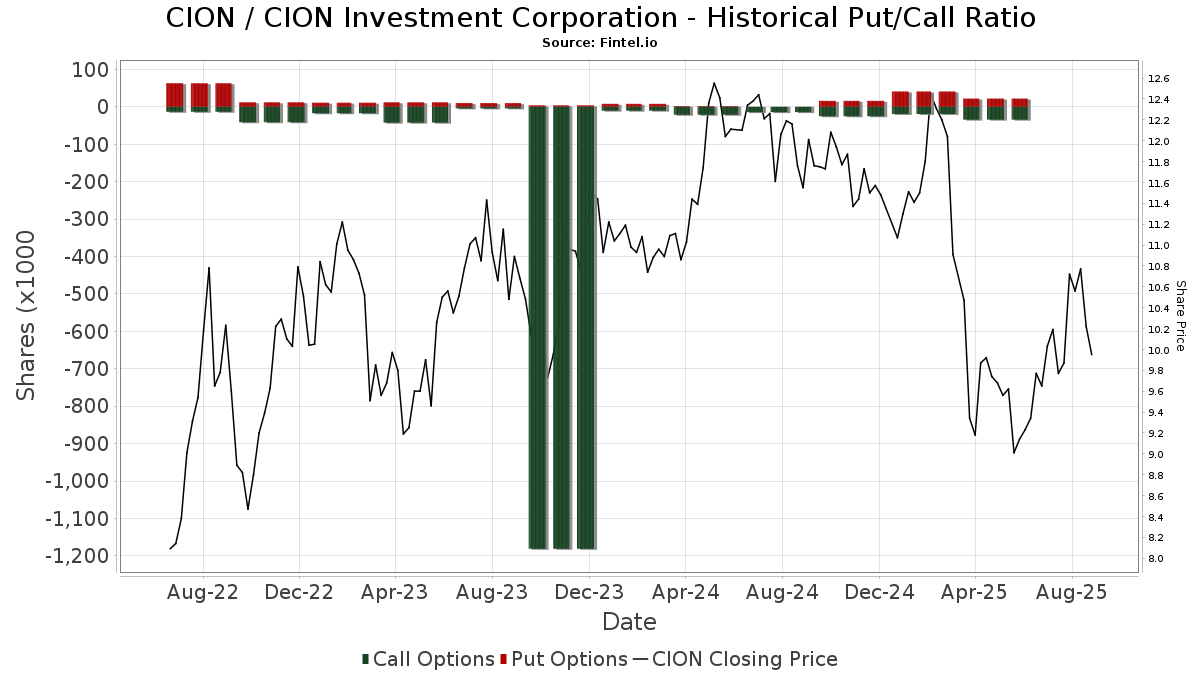
Rasio Put/Call Institusional
Selain melaporkan isu ekuitas dan utang standar, institusi dengan aset di bawah manajemen lebih dari 100 juta dolar AS juga harus mengungkapkan kepemilikan opsi put dan call mereka. Karena opsi put umumnya menunjukkan sentimen negatif, dan opsi call menunjukkan sentimen positif, kita dapat mengetahui sentimen institusional secara keseluruhan dengan memplot rasio put terhadap call. Grafik di sebelah kanan memplot rasio put/call historis untuk instrumen ini.
Menggunakan Rasio Put/Call sebagai indikator sentimen investor mengatasi salah satu kekurangan utama dari penggunaan total kepemilikan institusional, yaitu sejumlah besar aset yang dikelola diinvestasikan secara pasif untuk melacak indeks. Dana yang dikelola secara pasif biasanya tidak membeli opsi, sehingga indikator rasio put/call lebih akurat dalam melacak sentimen dana yang dikelola secara aktif.
Pengajuan 13F dan NPORT
Detail pada pengajuan 13F tersedia gratis. Detail pada pengajuan NP memerlukan keanggotaan premium. Baris berwarna hijau menunjukkan posisi baru. Baris berwarna merah menunjukkan posisi yang sudah ditutup. Klik tautan ini ikon untuk melihat riwayat transaksi selengkapnya.
Tingkatkan
untuk membuka data premium dan mengekspor ke Excel ![]() .
.
| Tanggal File | Sumber | Investor | Ketik | Presyo ng Avg (Silangan) |
Saham | Δ Saham (%) |
Dilaporkan Nilai ($1000) |
Nilai Δ (%) |
Alokasi Port (%) |
|
|---|---|---|---|---|---|---|---|---|---|---|
| 2025-07-18 | 13F | Cooper Financial Group | 50,895 | -3.62 | 487 | -10.81 | ||||
| 2025-07-29 | 13F | Private Trust Co Na | 7,284 | 0.00 | 70 | -8.00 | ||||
| 2025-07-29 | NP | Putnam High Income Securities Fund | 626,379 | 0.00 | 6,057 | -22.88 | ||||
| 2025-07-30 | 13F | Brookstone Capital Management | 0 | -100.00 | 0 | |||||
| 2025-07-22 | 13F | Belpointe Asset Management LLC | 15,946 | 10.31 | 153 | 2.01 | ||||
| 2025-08-14 | 13F | Citadel Advisors Llc | 0 | -100.00 | 0 | |||||
| 2025-07-29 | 13F | Koshinski Asset Management, Inc. | 32,788 | -3.95 | 314 | -11.33 | ||||
| 2025-08-27 | NP | Special Opportunities Fund, Inc. | 909,621 | 0.00 | 8,705 | -7.53 | ||||
| 2025-08-08 | 13F | Hartland & Co., LLC | 0 | -100.00 | 0 | |||||
| 2025-08-14 | 13F | CF Capital LLC | 500,000 | -13.96 | 4,805 | -17.71 | ||||
| 2025-07-15 | 13F | EWG Elevate Inc. | 25,474 | 0.00 | 244 | -7.60 | ||||
| 2025-08-14 | 13F | GWM Advisors LLC | 7 | 16.67 | 0 | |||||
| 2025-04-30 | 13F | Sofos Investments, Inc. | 97,281 | 499.28 | 1,007 | 413.27 | ||||
| 2025-07-21 | 13F | Catalina Capital Group, LLC | 0 | -100.00 | 0 | |||||
| 2025-07-09 | 13F | Triumph Capital Management | 14,619 | -36.98 | 140 | -42.08 | ||||
| 2025-04-30 | 13F | Stratos Wealth Partners, LTD. | 0 | -100.00 | 0 | |||||
| 2025-03-28 | NP | DVDN - Kingsbarn Dividend Opportunity ETF | 7,989 | 51.68 | 94 | 45.31 | ||||
| 2025-08-04 | 13F | Arkadios Wealth Advisors | 329,379 | 3.26 | 3,152 | -4.51 | ||||
| 2025-08-14 | 13F | IHT Wealth Management, LLC | 25,450 | -2.06 | 244 | -9.33 | ||||
| 2025-08-08 | 13F | Avantax Advisory Services, Inc. | 35,751 | 36.73 | 342 | 26.67 | ||||
| 2025-08-07 | 13F | Resources Investment Advisors, LLC. | 184,073 | -8.40 | 1,762 | -15.30 | ||||
| 2025-07-22 | 13F | Wealthcare Advisory Partners LLC | 28,979 | 40.83 | 277 | 30.66 | ||||
| 2025-08-14 | 13F | Diversify Wealth Management, Llc | 132,850 | -14.13 | 1,414 | -9.54 | ||||
| 2025-06-18 | NP | Putnam ETF Trust - Putnam BDC ETF - | 117,445 | -73.97 | 1,165 | -77.97 | ||||
| 2025-08-13 | 13F | ExodusPoint Capital Management, LP | 0 | -100.00 | 0 | |||||
| 2025-08-05 | 13F | Sigma Planning Corp | 342,566 | 1.31 | 3,278 | -6.32 | ||||
| 2025-07-31 | 13F | Caitong International Asset Management Co., Ltd | 402 | 482.61 | 4 | |||||
| 2025-08-14 | 13F | Mercer Global Advisors Inc /adv | 17,927 | -3.59 | 172 | -10.94 | ||||
| 2025-07-08 | 13F | Arlington Trust Co LLC | 1,000 | -52.38 | 9 | -57.14 | ||||
| 2025-07-22 | 13F | Merit Financial Group, LLC | 18,893 | -4.60 | 181 | -11.76 | ||||
| 2025-08-12 | 13F | XTX Topco Ltd | 21,618 | 207 | ||||||
| 2025-08-13 | 13F | Northwestern Mutual Wealth Management Co | 3,133 | 0.00 | 30 | -9.37 | ||||
| 2025-08-19 | 13F | Newbridge Financial Services Group, Inc. | 15,094 | 0.00 | 144 | -7.69 | ||||
| 2025-08-27 | 13F/A | Brinker Capital Investments, LLC | 17,831 | -21.58 | 171 | -27.66 | ||||
| 2025-07-29 | 13F | International Assets Investment Management, Llc | 64,996 | -2.95 | 622 | -10.25 | ||||
| 2025-08-19 | 13F | Cape Investment Advisory, Inc. | 14,045 | -6.65 | 134 | -13.55 | ||||
| 2025-08-14 | 13F | Comerica Bank | 2,342 | 0.00 | 22 | -8.33 | ||||
| 2025-08-14 | 13F | Susquehanna International Group, Llp | 14,225 | -5.67 | 136 | -12.82 | ||||
| 2025-08-11 | 13F | Western Wealth Management, LLC | 13,068 | 0.00 | 125 | -7.41 | ||||
| 2025-08-14 | 13F | Susquehanna International Group, Llp | Call | 21,800 | 118.00 | 209 | 101.94 | |||
| 2025-08-06 | 13F | Golden State Wealth Management, LLC | 18,856 | 87.98 | 180 | 74.76 | ||||
| 2025-07-10 | 13F | Redhawk Wealth Advisors, Inc. | 0 | -100.00 | 0 | |||||
| 2025-08-01 | 13F | Envestnet Asset Management Inc | 199,905 | 98.83 | 1,913 | 83.94 | ||||
| 2025-08-11 | 13F | United Advisor Group, LLC | 24,136 | 0.00 | 231 | -7.63 | ||||
| 2025-08-11 | 13F | Private Advisor Group, LLC | 677,822 | -8.32 | 6,487 | -15.24 | ||||
| 2025-08-13 | 13F | SageView Advisory Group, LLC | 11,322 | 0.00 | 113 | -4.27 | ||||
| 2025-08-11 | 13F | PAX Financial Group, LLC | 13,662 | -44.52 | 131 | -48.82 | ||||
| 2025-07-10 | 13F | Kozak & Associates, Inc. | 590 | 4.06 | 6 | 0.00 | ||||
| 2025-08-13 | 13F | Virtus Investment Advisers, Inc. | 109,146 | 20.94 | 1,045 | 11.78 | ||||
| 2025-08-14 | 13F | Great Valley Advisor Group, Inc. | 12,643 | 121 | ||||||
| 2025-09-04 | 13F/A | Advisor Group Holdings, Inc. | 259,295 | 8.08 | 2,504 | 0.85 | ||||
| 2025-08-14 | 13F | Aquatic Capital Management LLC | 3,907 | 37 | ||||||
| 2025-08-11 | 13F | United Capital Financial Advisers, Llc | 11,482 | -29.95 | 110 | -35.50 | ||||
| 2025-08-14 | 13F | Millennium Management Llc | 66,254 | 142.25 | 634 | 124.03 | ||||
| 2025-08-13 | 13F | StoneX Group Inc. | 22,031 | 18.03 | 211 | 8.81 | ||||
| 2025-05-21 | 13F | Acadian Asset Management Llc | 0 | -100.00 | 0 | |||||
| 2025-08-13 | 13F | Townsquare Capital Llc | 16,388 | -47.87 | 157 | -52.00 | ||||
| 2025-07-29 | 13F | Swmg, Llc | 19,374 | 0.00 | 193 | -1.03 | ||||
| 2025-07-30 | 13F | Strategic Blueprint, LLC | 48,293 | -6.42 | 462 | -13.48 | ||||
| 2025-08-06 | 13F | Legacy Investment Solutions, LLC | 7,711 | -9.13 | 74 | -25.51 | ||||
| 2025-08-14 | 13F | Beck Capital Management, Llc | 0 | -100.00 | 0 | |||||
| 2025-07-22 | 13F | Berger Financial Group, Inc | 487,404 | 27.62 | 4,664 | 18.02 | ||||
| 2025-08-13 | 13F | Continuum Advisory, LLC | 42,245 | 0.00 | 404 | -7.55 | ||||
| 2025-08-12 | 13F | Steward Partners Investment Advisory, Llc | 1,562 | 0.00 | 15 | -12.50 | ||||
| 2025-08-14 | 13F | Verition Fund Management LLC | 27,409 | 42.96 | 262 | 32.32 | ||||
| 2025-08-22 | 13F/A | TT Capital Management LLC | 34,416 | 11.03 | 329 | 2.81 | ||||
| 2025-07-17 | 13F | Symmetry Partners, LLC | 40,376 | 117.55 | 386 | 101.04 | ||||
| 2025-08-14 | 13F | Alpine Global Management, LLC | 88,836 | 0.00 | 850 | -7.51 | ||||
| 2025-05-12 | 13F | Eagle Global Advisors Llc | 0 | -100.00 | 0 | |||||
| 2025-08-14 | 13F | Bulldog Investors, LLP | 1,538,071 | -9.23 | 14,719 | -16.07 | ||||
| 2025-07-14 | 13F | Ai Financial Services Llc | 28,743 | -6.62 | 275 | -13.52 | ||||
| 2025-08-07 | 13F | Efficient Advisors, LLC | 0 | -100.00 | 0 | |||||
| 2025-05-15 | 13F | Tower Research Capital LLC (TRC) | 0 | -100.00 | 0 | |||||
| 2025-08-08 | 13F | Tanglewood Legacy Advisors, LLC | 16,865 | 0.00 | 161 | -7.47 | ||||
| 2025-07-24 | 13F | IFP Advisors, Inc | 16,870 | 2.24 | 161 | -5.29 | ||||
| 2025-08-08 | 13F | Cetera Investment Advisers | 247,703 | -2.09 | 2,371 | -9.47 | ||||
| 2025-08-14 | 13F | Brevan Howard Capital Management LP | 80,285 | 768 | ||||||
| 2025-08-14 | 13F | BI Asset Management Fondsmaeglerselskab A/S | 184,026 | 0.00 | 2 | 0.00 | ||||
| 2025-08-14 | 13F | Harwood Advisory Group, LLC | 1,511 | 14 | ||||||
| 2025-08-13 | 13F | Beacon Pointe Advisors, LLC | 11,346 | 109 | ||||||
| 2025-07-31 | 13F | Buckingham Strategic Partners | 20,427 | 0.00 | 195 | -7.58 | ||||
| 2025-08-08 | 13F | New England Capital Financial Advisors LLC | 2,513 | 8.04 | 24 | 0.00 | ||||
| 2025-08-14 | 13F | Federation des caisses Desjardins du Quebec | 800 | 0.00 | 8 | -12.50 | ||||
| 2025-07-10 | 13F | Atticus Wealth Management, Llc | 10,594 | 0.00 | 101 | -7.34 | ||||
| 2025-04-28 | 13F | Redmont Wealth Advisors Llc | 31,151 | -29.36 | 322 | -35.86 | ||||
| 2025-07-15 | 13F | Main Street Group, LTD | 2,856 | -24.32 | 27 | -30.77 | ||||
| 2025-08-14 | 13F | Van Eck Associates Corp | 1,304,706 | 6.26 | 12 | 0.00 | ||||
| 2025-08-11 | 13F | Aviso Wealth Management | 17,654 | -0.21 | 169 | -8.20 | ||||
| 2025-08-13 | 13F | Transce3nd, LLC | 5,875 | -21.61 | 56 | -27.27 | ||||
| 2025-05-15 | 13F | Ameriflex Group, Inc. | 0 | -100.00 | 0 | |||||
| 2025-08-18 | 13F/A | Apollo Management Holdings, L.P. | 63,262 | 0.00 | 605 | -7.49 | ||||
| 2025-08-14 | 13F | Integrated Wealth Concepts LLC | 15,230 | 0.00 | 146 | -7.64 | ||||
| 2025-08-14 | 13F | Royal Bank Of Canada | 6,856 | -76.96 | 66 | -78.57 | ||||
| 2025-08-12 | 13F | Jpmorgan Chase & Co | 14,015 | -74.38 | 134 | -76.33 | ||||
| 2025-08-14 | 13F | Bank Of America Corp /de/ | 7,458 | -1.74 | 71 | -8.97 | ||||
| 2025-07-21 | 13F | Ameritas Advisory Services, LLC | 1,416 | 14 | ||||||
| 2025-08-14 | 13F | Engineers Gate Manager LP | 0 | -100.00 | 0 | |||||
| 2025-08-13 | 13F | Quantbot Technologies LP | 29,665 | 284 | ||||||
| 2025-08-08 | 13F | Creative Planning | 23,905 | -44.17 | 229 | -48.53 | ||||
| 2025-08-07 | 13F | Hennion & Walsh Asset Management, Inc. | 585,434 | 5.41 | 5,603 | -2.54 | ||||
| 2025-07-17 | 13F | Sound Income Strategies, LLC | 404 | 0.00 | 4 | -25.00 | ||||
| 2025-08-12 | 13F | Trexquant Investment LP | 39,306 | -36.73 | 376 | -41.43 | ||||
| 2025-05-15 | 13F | Gwn Securities Inc. | 0 | -100.00 | 0 | |||||
| 2025-07-25 | 13F | Concurrent Investment Advisors, LLC | 51,286 | 19.32 | 491 | 10.36 | ||||
| 2025-08-14 | 13F | UBS Group AG | 551,905 | 60.45 | 5,282 | 48.34 | ||||
| 2025-07-11 | 13F | Farther Finance Advisors, LLC | 5,826 | 0.00 | 56 | -9.84 | ||||
| 2025-05-02 | 13F | Wealthfront Advisers Llc | 0 | -100.00 | 0 | -100.00 | ||||
| 2025-07-25 | 13F | Endowment Wealth Management, Inc. | 63,830 | 6.25 | 611 | -1.77 | ||||
| 2025-07-25 | 13F | Richardson Financial Services Inc. | 399 | 0.00 | 4 | -25.00 | ||||
| 2025-07-11 | 13F | Seacrest Wealth Management, Llc | 29,102 | 13.96 | 279 | 5.30 | ||||
| 2025-07-31 | 13F | Cambridge Investment Research Advisors, Inc. | 902,203 | 4.98 | 9 | 0.00 | ||||
| 2025-08-05 | 13F | EPG Wealth Management LLC | 24,195 | 4.23 | 232 | -3.75 | ||||
| 2025-08-06 | 13F | First Horizon Advisors, Inc. | 153 | 0.00 | 1 | 0.00 | ||||
| 2025-07-18 | 13F | Consolidated Portfolio Review Corp | 40,973 | -2.49 | 392 | -9.68 | ||||
| 2025-08-12 | 13F | Global Retirement Partners, LLC | 13,410 | 3.17 | 128 | -13.51 | ||||
| 2025-08-13 | 13F | Cerity Partners LLC | 24,064 | -6.24 | 230 | -13.21 | ||||
| 2025-08-14 | 13F | Raymond James Financial Inc | 182,218 | 4.31 | 1,744 | -3.60 | ||||
| 2025-08-12 | 13F | Proequities, Inc. | 0 | 0 | ||||||
| 2025-07-28 | NP | KBWD - Invesco KBW High Dividend Yield Financial ETF This fund is a listed as child fund of Invesco Ltd. and if that institution has disclosed ownership in this security, then these positions will not be double counted when calculating total shares and total value | 988,929 | -6.58 | 9,563 | -27.96 | ||||
| 2025-08-04 | 13F | Creekmur Asset Management LLC | 2 | -86.67 | 0 | |||||
| 2025-08-15 | 13F | Morgan Stanley | 459,664 | -16.20 | 4,399 | -22.53 | ||||
| 2025-08-07 | 13F | HighPoint Advisor Group LLC | 157,704 | 0.00 | 1,509 | -5.21 | ||||
| 2025-08-11 | 13F | WPG Advisers, LLC | 3,497 | 0.00 | 33 | -8.33 | ||||
| 2025-08-20 | 13F/A | Coppell Advisory Solutions LLC | 10,966 | 0.00 | 104 | -5.45 | ||||
| 2025-08-12 | 13F | Advisors Asset Management, Inc. | 219,520 | 63.01 | 2,101 | 50.75 | ||||
| 2025-08-14 | 13F | Mariner, LLC | 30,792 | 15.79 | 295 | 6.91 | ||||
| 2025-08-05 | 13F | Simplex Trading, Llc | 0 | -100.00 | 0 | |||||
| 2025-08-12 | 13F | Providence Wealth Advisors, LLC | 0 | -100.00 | 0 | |||||
| 2025-05-13 | 13F | Skopos Labs, Inc. | 0 | -100.00 | 0 | |||||
| 2025-08-07 | 13F | Kestra Private Wealth Services, Llc | 22,213 | 1.03 | 213 | -6.61 | ||||
| 2025-08-13 | 13F | OMERS ADMINISTRATION Corp | 0 | -100.00 | 0 | |||||
| 2025-08-12 | 13F | Leigh Baldwin & Co., Llc | 0 | -100.00 | 0 | |||||
| 2025-08-28 | NP | Monachil Credit Income Fund | 10,000 | 96 | ||||||
| 2025-08-29 | NP | Resource Credit Income Fund | 120,800 | 0.00 | 1,156 | -7.52 | ||||
| 2025-05-14 | 13F | Jane Street Group, Llc | 0 | -100.00 | 0 | |||||
| 2025-08-14 | 13F | Elevatus Welath Management | 0 | -100.00 | 0 | |||||
| 2025-08-11 | 13F | Lsv Asset Management | 186,600 | 17.95 | 2 | 0.00 | ||||
| 2025-08-13 | 13F | Pinkerton Retirement Specialists, LLC | 461,725 | -3.47 | 4,419 | -10.75 | ||||
| 2025-08-12 | 13F | Virtu Financial LLC | 0 | -100.00 | 0 | |||||
| 2025-08-13 | 13F | Callodine Capital Management, LP | 550,000 | 10.00 | 5,264 | 1.70 | ||||
| 2025-05-12 | 13F | National Bank Of Canada /fi/ | 0 | -100.00 | 0 | |||||
| 2025-08-07 | 13F/A | Joseph Group Capital Management | 4,131 | 0.00 | 40 | -7.14 | ||||
| 2025-05-12 | 13F | Richard W. Paul & Associates, LLC | 0 | -100.00 | 0 | -100.00 | ||||
| 2025-07-23 | 13F | Winthrop Advisory Group LLC | 11,493 | -32.73 | 110 | -40.11 | ||||
| 2025-06-27 | NP | LBO - WHITEWOLF Publicly Listed Private Equity ETF | 7,729 | 14.28 | 77 | -3.80 | ||||
| 2025-07-25 | 13F | Apollon Wealth Management, LLC | 69,707 | 28.00 | 667 | 18.47 | ||||
| 2025-08-12 | 13F | O'shaughnessy Asset Management, Llc | 13,702 | -89.44 | 131 | -90.25 | ||||
| 2025-08-14 | 13F | Wells Fargo & Company/mn | 887,357 | 0.81 | 8,492 | -6.78 | ||||
| 2025-07-15 | 13F | Fifth Third Bancorp | 0 | -100.00 | 0 | |||||
| 2025-05-15 | 13F/A | Orion Portfolio Solutions, LLC | 22,738 | -13.80 | 235 | -21.67 | ||||
| 2025-05-08 | 13F | Gsa Capital Partners Llp | 0 | -100.00 | 0 | |||||
| 2025-07-23 | 13F | Kingswood Wealth Advisors, Llc | 14,599 | 0.00 | 140 | -8.55 | ||||
| 2025-07-30 | 13F | BlueChip Wealth Advisors LLC | 52,976 | 3.13 | 507 | -4.71 | ||||
| 2025-08-12 | 13F | Gitterman Wealth Management, LLC | 7,300 | 70 | ||||||
| 2025-08-12 | 13F | LPL Financial LLC | 1,067,915 | 7.55 | 10,220 | -0.55 | ||||
| 2025-08-14 | 13F | Citadel Advisors Llc | Call | 12,200 | 24.49 | 117 | 14.85 | |||
| 2025-08-14 | 13F | Citadel Advisors Llc | Put | 12,000 | -70.73 | 115 | -73.11 | |||
| 2025-08-12 | 13F | LPL Financial LLC | Put | 10,000 | 96 | |||||
| 2025-08-21 | NP | BIZD - VanEck Vectors BDC Income ETF | 1,191,489 | 1.51 | 11,403 | -6.13 | ||||
| 2025-05-14 | 13F | Virtus ETF Advisers LLC | 0 | -100.00 | 0 | |||||
| 2025-08-04 | 13F | Spire Wealth Management | 3,931 | -75.82 | 38 | -77.98 | ||||
| 2025-07-11 | 13F | SILVER OAK SECURITIES, Inc | 28,461 | 2.19 | 272 | -6.53 | ||||
| 2025-08-06 | 13F | Bensler, LLC | 0 | -100.00 | 0 | |||||
| 2025-08-14 | 13F | Wealth Preservation Advisors, LLC | 3,061 | 0.00 | 29 | -6.45 | ||||
| 2025-07-28 | 13F | Harbour Investments, Inc. | 15,930 | 1.72 | 152 | -6.17 | ||||
| 2025-05-15 | 13F | D. E. Shaw & Co., Inc. | 0 | -100.00 | 0 | |||||
| 2025-08-14 | 13F | Gen-Wealth Partners Inc | 9,500 | -15.91 | 91 | -22.41 | ||||
| 2025-08-11 | 13F | HighTower Advisors, LLC | 35,778 | -9.42 | 342 | -16.18 | ||||
| 2025-07-17 | 13F | Paradigm Financial Partners, Llc | 69,500 | -0.52 | 665 | -8.02 | ||||
| 2025-06-25 | NP | VPC - Virtus Private Credit Strategy ETF | 82,437 | -8.78 | 818 | -22.85 | ||||
| 2025-05-15 | 13F | Hrt Financial Lp | 0 | -100.00 | 0 | |||||
| 2025-08-13 | 13F | Invesco Ltd. | 1,343,185 | 33.64 | 12,854 | 23.57 | ||||
| 2025-08-12 | 13F | Franklin Resources Inc | 0 | -100.00 | 0 | |||||
| 2025-08-11 | 13F | Tidemark, LLC | 2,134 | 0.00 | 20 | -9.09 | ||||
| 2025-08-12 | 13F | BlackRock, Inc. | 311,440 | 34.06 | 2,980 | 23.96 | ||||
| 2025-08-18 | 13F | Hollencrest Capital Management | 3,000 | 0.00 | 29 | -9.68 | ||||
| 2025-08-11 | 13F | Wealthspire Advisors, LLC | 16,687 | 0.00 | 160 | -7.56 | ||||
| 2025-08-06 | 13F | Wedbush Securities Inc | 20,400 | 24.77 | 0 | |||||
| 2025-08-11 | 13F | Citigroup Inc | 0 | -100.00 | 0 | |||||
| 2025-08-14 | 13F | Ameriprise Financial Inc | 49,018 | 20.04 | 469 | 11.14 | ||||
| 2025-08-12 | 13F | MAI Capital Management | 3,562 | 0.00 | 34 | -5.56 | ||||
| 2025-08-01 | 13F | Y-Intercept (Hong Kong) Ltd | 63,351 | 381.21 | 606 | 345.59 | ||||
| 2025-08-12 | 13F | Magnetar Financial LLC | 0 | -100.00 | 0 | |||||
| 2025-08-14 | 13F | Lazard Asset Management Llc | 0 | -100.00 | 0 | |||||
| 2025-08-04 | 13F | Assetmark, Inc | 0 | -100.00 | 0 | |||||
| 2025-08-06 | 13F | Legacy Wealth Managment, LLC/ID | 7,711 | 0.00 | 74 | -7.59 | ||||
| 2025-05-16 | 13F | Dynamic Technology Lab Private Ltd | 0 | -100.00 | 0 | |||||
| 2025-07-22 | 13F | BridgePort Financial Solutions, LLC | 15,987 | 0.00 | 153 | -7.88 | ||||
| 2025-07-25 | 13F | Cwm, Llc | 7,679 | 2.40 | 0 | |||||
| 2025-05-07 | 13F | First Heartland Consultants, Inc. | 0 | -100.00 | 0 | |||||
| 2025-07-07 | 13F | Thurston, Springer, Miller, Herd & Titak, Inc. | 1,068 | 167.00 | 10 | 150.00 | ||||
| 2025-08-14 | 13F | Tudor Investment Corp Et Al | 0 | -100.00 | 0 | |||||
| 2025-05-12 | 13F | Nomura Asset Management Co Ltd | 0 | -100.00 | 0 | |||||
| 2025-08-04 | 13F | Daymark Wealth Partners, Llc | 10,283 | 98 | ||||||
| 2025-08-06 | 13F | Founders Financial Securities Llc | 53,199 | 0.03 | 509 | -5.57 | ||||
| 2025-08-11 | 13F | Strategic Wealth Partners, Ltd. | 5,144 | 49 | ||||||
| 2025-08-13 | 13F | Renaissance Technologies Llc | 298,700 | -48.26 | 2,859 | -52.17 | ||||
| 2025-08-13 | 13F | Northern Trust Corp | 18,455 | 177 | ||||||
| 2025-08-14 | 13F | Sunbelt Securities, Inc. | 2,000 | 0.00 | 23 | 10.00 | ||||
| 2025-08-14 | 13F | Two Sigma Advisers, Lp | 479,900 | -19.83 | 4,593 | -25.88 | ||||
| 2025-07-25 | 13F | Atria Wealth Solutions, Inc. | 0 | -100.00 | 0 | |||||
| 2025-08-08 | 13F | Collaborative Wealth Managment Inc. | 19,402 | -8.17 | 186 | -15.14 | ||||
| 2025-05-14 | 13F | CIBC Private Wealth Group, LLC | 0 | -100.00 | 0 | |||||
| 2025-05-28 | NP | LUSIX - Lazard US Systematic Small Cap Equity Portfolio Institutional Shares | 8,381 | -10.87 | 87 | -19.63 | ||||
| 2025-08-05 | 13F | GPS Wealth Strategies Group, LLC | 15,479 | 0.84 | 148 | -6.33 | ||||
| 2025-08-14 | 13F | Quarry LP | 0 | -100.00 | 0 | |||||
| 2025-08-06 | 13F | Commonwealth Equity Services, Llc | 285,492 | -3.25 | 3 | -33.33 | ||||
| 2025-08-18 | 13F | Geneos Wealth Management Inc. | 8,802 | 21.73 | 84 | 13.51 | ||||
| 2025-08-14 | 13F | Two Sigma Investments, Lp | 231,253 | -30.43 | 2,213 | -35.67 | ||||
| 2025-07-17 | 13F | Beacon Capital Management, LLC | 33,404 | 7.65 | 320 | -0.62 | ||||
| 2025-07-24 | 13F | Strong Tower Advisory Services | 198,777 | 3.92 | 1,902 | 12.68 | ||||
| 2025-07-28 | 13F | Acorn Financial Advisory Services Inc /adv | 267,634 | 5.52 | 2,561 | -2.44 | ||||
| 2025-07-16 | 13F | Signaturefd, Llc | 3,309 | 0.00 | 32 | -8.82 | ||||
| 2025-07-31 | 13F | Whipplewood Advisors, LLC | 52,245 | 208,880.00 | 500 | 10.15 | ||||
| 2025-08-04 | 13F | Simon Quick Advisors, Llc | 25,526 | 8.05 | 244 | 0.00 | ||||
| 2025-08-14 | 13F | Stifel Financial Corp | 49,039 | 14.97 | 469 | 6.35 | ||||
| 2025-08-08 | 13F | Financial Gravity Companies, Inc. | 97,634 | 0.36 | 934 | -15.78 | ||||
| 2025-05-12 | 13F | Entropy Technologies, LP | 0 | -100.00 | 0 | |||||
| 2025-08-06 | 13F | AE Wealth Management LLC | 33,123 | 3.25 | 317 | -4.82 | ||||
| 2025-08-05 | 13F | Fullcircle Wealth Llc | 0 | -100.00 | 0 | |||||
| 2025-08-15 | 13F | Kestra Advisory Services, LLC | 310,326 | -1.33 | 2,970 | -8.79 | ||||
| 2025-08-12 | 13F | Founders Financial Alliance, LLC | 24,588 | -0.36 | 235 | -7.84 |
Other Listings
| IL:CION |