Mga Batayang Estadistika
| Saham Institusional (Jangka Panjang) | 9,211,463 - 19.46% (ex 13D/G) - change of 0.08MM shares 0.83% MRQ |
| Nilai Institusional (Jangka Panjang) | $ 251,973 USD ($1000) |
Kepemilikan Institusional dan Pemegang Saham
Dorchester Minerals, L.P. - Limited Partnership (US:DMLP) memiliki 169 pemilik institusional dan pemegang saham yang telah mengajukan formulir 13D/G atau 13F kepada Komisi Bursa Efek (Securities Exchange Commission/SEC). Lembaga-lembaga ini memegang total 9,211,463 saham. Pemegang saham terbesar meliputi Morgan Stanley, Horizon Kinetics Asset Management Llc, Adams Asset Advisors, LLC, Botty Investors LLC, DIV - Global X SuperDividend U.S. ETF, Royce & Associates Lp, Meixler Investment Management, Ltd., Round Rock Advisors, LLC, Delta Investment Management, LLC, and Royce Value Trust Inc .
Struktur kepemilikan institusional Dorchester Minerals, L.P. - Limited Partnership (NasdaqGS:DMLP) menunjukkan posisi terkini di perusahaan oleh institusi dan dana, serta perubahan terbaru dalam ukuran posisi. Pemegang saham utama dapat mencakup investor individu, reksa dana, dana lindung nilai, atau institusi. Jadwal 13D menunjukkan bahwa investor memegang (atau pernah memegang) lebih dari 5% saham perusahaan dan bermaksud (atau pernah bermaksud) untuk secara aktif mengejar perubahan strategi bisnis. Jadwal 13G menunjukkan investasi pasif lebih dari 5%.
The share price as of September 5, 2025 is 24.91 / share. Previously, on September 9, 2024, the share price was 29.02 / share. This represents a decline of 14.16% over that period.

Skor Sentimen Dana
Skor Sentimen Dana (sebelumnya dikenal sebagai Skor Akumulasi Kepemilikan) menemukan saham-saham yang paling banyak dibeli oleh dana. Ini adalah hasil dari model kuantitatif multi-faktor yang canggih yang mengidentifikasi perusahaan dengan tingkat akumulasi institusional tertinggi. Model penilaian menggunakan kombinasi dari total peningkatan pemilik yang diungkapkan, perubahan dalam alokasi portofolio pada pemilik tersebut, dan metrik lainnya. Angka berkisar dari 0 hingga 100, dengan angka yang lebih tinggi menunjukkan tingkat akumulasi yang lebih tinggi dibandingkan dengan perusahaan sejenisnya, dan 50 adalah rata-ratanya.
Frekuensi Pembaruan: Setiap Hari
Lihat Ownership Explorer, yang menyediakan daftar perusahaan dengan peringkat tertinggi.
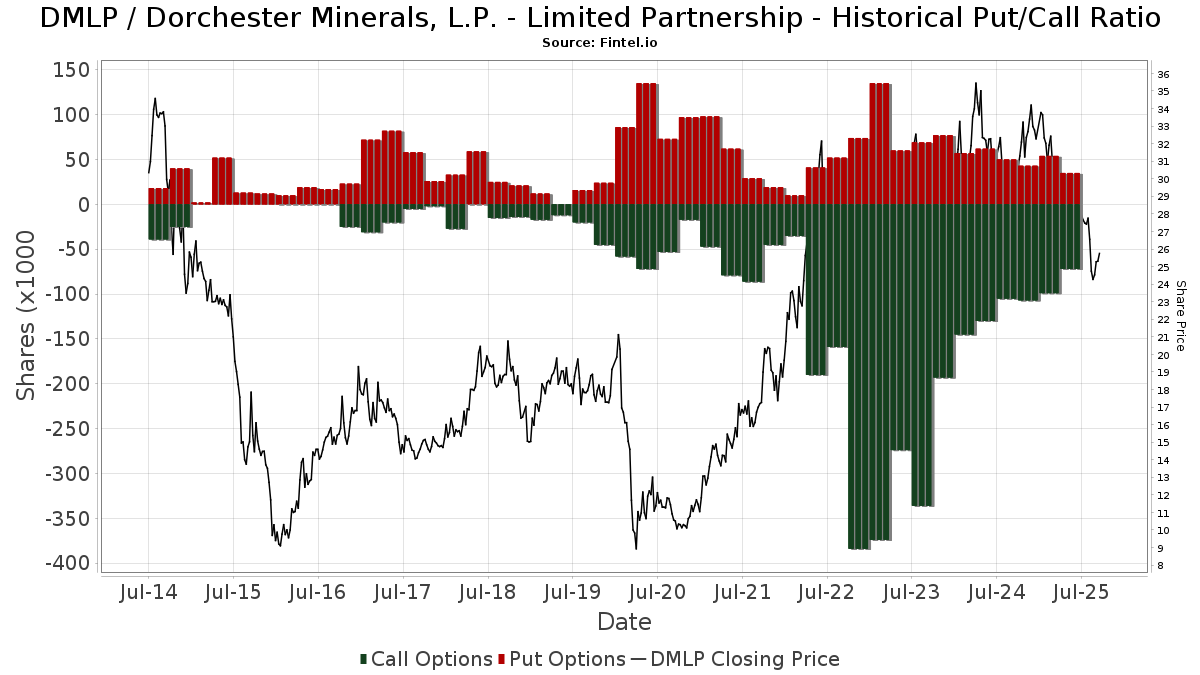
Rasio Put/Call Institusional
Selain melaporkan isu ekuitas dan utang standar, institusi dengan aset di bawah manajemen lebih dari 100 juta dolar AS juga harus mengungkapkan kepemilikan opsi put dan call mereka. Karena opsi put umumnya menunjukkan sentimen negatif, dan opsi call menunjukkan sentimen positif, kita dapat mengetahui sentimen institusional secara keseluruhan dengan memplot rasio put terhadap call. Grafik di sebelah kanan memplot rasio put/call historis untuk instrumen ini.
Menggunakan Rasio Put/Call sebagai indikator sentimen investor mengatasi salah satu kekurangan utama dari penggunaan total kepemilikan institusional, yaitu sejumlah besar aset yang dikelola diinvestasikan secara pasif untuk melacak indeks. Dana yang dikelola secara pasif biasanya tidak membeli opsi, sehingga indikator rasio put/call lebih akurat dalam melacak sentimen dana yang dikelola secara aktif.
Pengajuan 13D/G
Kami menyajikan pengajuan 13D/G secara terpisah dari pengajuan 13F karena perlakuan yang berbeda oleh SEC. Pengajuan 13D/G dapat diajukan oleh kelompok investor (dengan satu pemimpin), sedangkan pengajuan 13F tidak bisa. Hal ini mengakibatkan situasi di mana seorang investor dapat mengajukan 13D/G yang melaporkan satu nilai untuk total saham (mewakili semua saham yang dimiliki oleh kelompok investor), tetapi kemudian mengajukan 13F yang melaporkan nilai yang berbeda untuk total saham (mewakili kepemilikan mereka sendiri). Ini berarti bahwa kepemilikan saham dari pengajuan 13D/G dan pengajuan 13F seringkali tidak dapat dibandingkan secara langsung, sehingga kami menyajikannya secara terpisah.
Catatan: Mulai 16 Mei 2021, kami tidak lagi menampilkan pemilik yang belum mengajukan 13D/G dalam setahun terakhir. Sebelumnya, kami menampilkan riwayat lengkap pengajuan 13D/G. Secara umum, entitas yang diwajibkan untuk mengajukan pengajuan 13D/G harus mengajukan setidaknya setiap tahun sebelum mengirimkan pengajuan penutupan. Namun, terkadang dana keluar dari posisi tanpa mengirimkan pengajuan penutupan (misalnya, mereka menghentikan operasi), sehingga menampilkan riwayat lengkap terkadang menyebabkan kebingungan tentang kepemilikan saat ini. Untuk mencegah kebingungan, kami sekarang hanya menampilkan pemilik 'saat ini' - yaitu - pemilik yang telah mengajukan dalam setahun terakhir.
Upgrade to unlock premium data.
| Tanggal File | Formulir | Investor | Sebelumnya Saham |
Terbaru Saham |
Δ Saham (Persen) |
Kepemilikan (Persen) |
Δ Pagmamay-ari (Persen) |
|
|---|---|---|---|---|---|---|---|---|
| 2025-05-14 | DAVIDSON KEMPNER CAPITAL MANAGEMENT LP | 3,509,753 | 2,858,934 | -18.54 | 6.04 | -19.47 | ||
| 2024-12-23 | Carrollton Mineral Partners, LP | 2,536,118 | 1,609,742 | 3.40 | ||||
| 2024-11-25 | Carrollton Mineral Partners IV, LP | 3,211,391 | 2,536,118 | -21.03 | 5.36 | -20.94 |
Pengajuan 13F dan NPORT
Detail pada pengajuan 13F tersedia gratis. Detail pada pengajuan NP memerlukan keanggotaan premium. Baris berwarna hijau menunjukkan posisi baru. Baris berwarna merah menunjukkan posisi yang sudah ditutup. Klik tautan ini ikon untuk melihat riwayat transaksi selengkapnya.
Tingkatkan
untuk membuka data premium dan mengekspor ke Excel ![]() .
.
| Tanggal File | Sumber | Investor | Ketik | Presyo ng Avg (Silangan) |
Saham | Δ Saham (%) |
Dilaporkan Nilai ($1000) |
Nilai Δ (%) |
Alokasi Port (%) |
|
|---|---|---|---|---|---|---|---|---|---|---|
| 2025-07-31 | 13F | Oppenheimer & Co Inc | 0 | -100.00 | 0 | |||||
| 2025-08-08 | 13F | Geode Capital Management, Llc | 49,229 | 0.72 | 1,372 | -6.73 | ||||
| 2025-08-13 | 13F | Garner Asset Management Corp | 0 | -100.00 | 0 | |||||
| 2025-07-14 | 13F | Toth Financial Advisory Corp | 50 | 0.00 | 1 | 0.00 | ||||
| 2025-08-05 | 13F | GPS Wealth Strategies Group, LLC | 0 | -100.00 | 0 | |||||
| 2025-07-02 | 13F | Howard Financial Services, Ltd. | 34,191 | 0.02 | 953 | -7.39 | ||||
| 2025-08-11 | 13F | Pin Oak Investment Advisors Inc | 1,450 | 0.00 | 0 | |||||
| 2025-08-26 | NP | AZBAX - AllianzGI Small-Cap Fund Class A | 4,607 | 0.00 | 128 | -7.25 | ||||
| 2025-08-13 | 13F | Jump Financial, LLC | 0 | -100.00 | 0 | |||||
| 2025-06-30 | NP | CVY - Invesco Zacks Multi-Asset Income ETF This fund is a listed as child fund of Invesco Ltd. and if that institution has disclosed ownership in this security, then these positions will not be double counted when calculating total shares and total value | 39,063 | -14.79 | 1,120 | -22.29 | ||||
| 2025-07-10 | 13F | Baker Tilly Financial, Llc | 12,676 | 2.53 | 353 | -4.85 | ||||
| 2025-08-13 | 13F | Virtus Investment Advisers, Inc. | 6,187 | 32.17 | 172 | 22.86 | ||||
| 2025-08-14 | 13F | Sunbelt Securities, Inc. | 200 | 0.00 | 7 | 0.00 | ||||
| 2025-08-13 | 13F | Jones Financial Companies Lllp | 1,000 | 27 | ||||||
| 2025-08-13 | 13F | Botty Investors LLC | 539,559 | -0.31 | 15,032 | -7.67 | ||||
| 2025-06-27 | NP | DIV - Global X SuperDividend U.S. ETF This fund is a listed as child fund of Mirae Asset Global Investments Co., Ltd. and if that institution has disclosed ownership in this security, then these positions will not be double counted when calculating total shares and total value | 420,476 | 265.60 | 12,051 | 233.52 | ||||
| 2025-07-25 | 13F | Apollon Wealth Management, LLC | 8,929 | 3.55 | 249 | -4.25 | ||||
| 2025-08-12 | 13F | Choate Investment Advisors | 8,418 | 0.00 | 235 | -7.51 | ||||
| 2025-08-14 | 13F | Bnp Paribas Arbitrage, Sa | 790 | 117.03 | 22 | 120.00 | ||||
| 2025-08-14 | 13F | Graney & King, LLC | 855 | 0.00 | 24 | -8.00 | ||||
| 2025-08-14 | 13F | Fiduciary Trust Co | 8,750 | 0.00 | 244 | -7.60 | ||||
| 2025-08-19 | 13F | Advisory Services Network, LLC | 17,350 | 475 | ||||||
| 2025-08-08 | 13F | Smithfield Trust Co | 500 | 0.00 | 0 | |||||
| 2025-08-19 | 13F | Newbridge Financial Services Group, Inc. | 1,250 | 25.00 | 35 | 13.33 | ||||
| 2025-08-08 | 13F | Creative Planning | 9,713 | -7.70 | 271 | -14.56 | ||||
| 2025-08-14 | 13F | UBS Group AG | 39,220 | 39.26 | 1,093 | 28.93 | ||||
| 2025-07-31 | 13F | Mcdaniel Terry & Co | 52,423 | 0.00 | 1,461 | 145,900.00 | ||||
| 2025-07-11 | 13F | Farther Finance Advisors, LLC | 30 | 1 | ||||||
| 2025-07-28 | 13F/A | Penbrook Management LLC | 14,025 | -3.61 | 391 | -10.76 | ||||
| 2025-08-14 | 13F | Mercer Global Advisors Inc /adv | 19,330 | 92.24 | 539 | 78.15 | ||||
| 2025-08-14 | 13F | Stifel Financial Corp | 91,627 | 1.83 | 2,553 | -5.69 | ||||
| 2025-08-15 | 13F | State of Tennessee, Treasury Department | 18,088 | -32.02 | 504 | -37.12 | ||||
| 2025-07-08 | 13F | Arlington Trust Co LLC | 3,400 | 0.00 | 95 | -7.84 | ||||
| 2025-07-15 | 13F | Penn Davis Mcfarland Inc | 11,665 | 0.00 | 325 | -7.43 | ||||
| 2025-08-12 | 13F | Tableaux Llc | 1,667 | -82.52 | 483 | 68.88 | ||||
| 2025-08-11 | 13F | Royce & Associates Lp | 418,374 | -3.29 | 11,656 | -10.43 | ||||
| 2025-07-31 | 13F | Ingalls & Snyder Llc | 0 | -100.00 | 0 | |||||
| 2025-08-14 | 13F | Hrt Financial Lp | 77,065 | 64.94 | 2 | 100.00 | ||||
| 2025-07-23 | 13F | MADDEN SECURITIES Corp | 13,382 | 3.88 | 373 | -3.88 | ||||
| 2025-08-07 | 13F | King Luther Capital Management Corp | 0 | -100.00 | 0 | |||||
| 2025-07-17 | 13F | Oakworth Capital, Inc. | 325 | 0.00 | 9 | 0.00 | ||||
| 2025-08-06 | 13F | O'Brien Greene & Co. Inc | 40,618 | 28.46 | 1,132 | 18.93 | ||||
| 2025-08-08 | 13F | Everett Harris & Co /ca/ | 83,109 | 0.00 | 2,315 | -7.36 | ||||
| 2025-07-25 | 13F | We Are One Seven, LLC | 0 | -100.00 | 0 | |||||
| 2025-08-15 | 13F | Howland Capital Management Llc | 10,257 | 0.00 | 286 | -7.47 | ||||
| 2025-05-12 | 13F | Sandy Spring Bank | 1,200 | 0.00 | 36 | -7.69 | ||||
| 2025-07-24 | 13F | Us Bancorp \de\ | 2,000 | 0.00 | 56 | -8.33 | ||||
| 2025-08-14 | 13F | Susquehanna International Group, Llp | Call | 0 | -100.00 | 0 | ||||
| 2025-08-13 | 13F | Cresset Asset Management, LLC | 0 | -100.00 | 0 | |||||
| 2025-08-14 | 13F | Wiley Bros.-aintree Capital, Llc | 122,809 | 4.65 | 3,421 | -2.95 | ||||
| 2025-08-14 | 13F | Colony Group, LLC | 9,820 | 274 | ||||||
| 2025-08-13 | 13F | Robotti Robert | 7,525 | 0.00 | 210 | -7.52 | ||||
| 2025-08-15 | NP | RYVFX - Royce Small-Cap Value Fund Service Class | 19,643 | -17.31 | 547 | -23.39 | ||||
| 2025-08-01 | 13F | Chilton Capital Management Llc | 4,200 | 0.00 | 117 | -7.14 | ||||
| 2025-08-11 | 13F | Citigroup Inc | 60 | 0.00 | 2 | 0.00 | ||||
| 2025-04-29 | NP | DEEP - Roundhill Acquirers Deep Value ETF | 9,004 | -9.38 | 274 | -19.71 | ||||
| 2025-08-13 | 13F | Invesco Ltd. | 44,051 | 11.82 | 1,227 | 3.54 | ||||
| 2025-08-12 | 13F | LPL Financial LLC | 63,810 | 5.76 | 1,778 | -2.04 | ||||
| 2025-07-14 | 13F | AdvisorNet Financial, Inc | 700 | -7.89 | 20 | -13.64 | ||||
| 2025-04-11 | 13F | Perkins Coie Trust Co | 0 | -100.00 | 0 | |||||
| 2025-08-07 | 13F | Americana Partners, LLC | 33,306 | 1.52 | 928 | -5.98 | ||||
| 2025-08-12 | 13F | MAI Capital Management | 2,890 | 0.00 | 81 | -6.98 | ||||
| 2025-06-26 | NP | GYLD - Arrow Dow Jones Global Yield ETF | 4,494 | 10.39 | 129 | 0.79 | ||||
| 2025-08-11 | 13F | HighTower Advisors, LLC | 25,317 | -8.27 | 705 | -15.06 | ||||
| 2025-08-01 | 13F | Envestnet Asset Management Inc | 7,808 | 218 | ||||||
| 2025-07-10 | 13F | Capital Advisory Group Advisory Services, LLC | 0 | -100.00 | 0 | |||||
| 2025-08-04 | 13F | Creative Financial Designs Inc /adv | 33 | 0.00 | 1 | |||||
| 2025-08-04 | 13F | Flagship Harbor Advisors, Llc | 10,090 | 5.29 | 281 | -2.43 | ||||
| 2025-08-19 | 13F | State of Wyoming | 1,877 | -79.25 | 52 | -80.88 | ||||
| 2025-08-13 | 13F | Beacon Pointe Advisors, LLC | 40,809 | 1,137 | ||||||
| 2025-08-13 | 13F | Northwestern Mutual Wealth Management Co | 6,575 | 0.00 | 183 | -7.11 | ||||
| 2025-08-11 | 13F | Rothschild Investment Llc | 250 | 0.00 | 7 | -14.29 | ||||
| 2025-08-14 | 13F | Holt Capital Advisors, L.L.C. dba Holt Capital Partners, L.P. | 29,510 | -27.60 | 822 | -32.95 | ||||
| 2025-08-13 | 13F | Northern Trust Corp | 0 | -100.00 | 0 | |||||
| 2025-07-21 | 13F | West Financial Advisors, LLC | 28 | 3.70 | 1 | |||||
| 2025-08-15 | 13F | CI Private Wealth, LLC | 7,662 | 0.99 | 213 | -6.58 | ||||
| 2025-08-07 | 13F | Resources Investment Advisors, LLC. | 10,464 | 2.54 | 292 | -4.90 | ||||
| 2025-08-06 | 13F | Ing Groep Nv | 57,100 | 1,591 | ||||||
| 2025-08-12 | 13F | Virtu Financial LLC | 0 | -100.00 | 0 | |||||
| 2025-08-13 | 13F | Wealthedge Investment Advisors, Llc | 14,791 | 6.91 | 412 | -0.96 | ||||
| 2025-08-14 | 13F | Goldman Sachs Group Inc | 51,765 | 45.07 | 1,442 | 34.39 | ||||
| 2025-07-24 | NP | FNCMX - Fidelity Nasdaq Composite Index Fund This fund is a listed as child fund of Fmr Llc and if that institution has disclosed ownership in this security, then these positions will not be double counted when calculating total shares and total value | 32,261 | 0.00 | 864 | -12.03 | ||||
| 2025-07-16 | 13F | Signaturefd, Llc | 3,500 | 0.00 | 98 | -7.62 | ||||
| 2025-08-06 | 13F | Commonwealth Equity Services, Llc | 13,691 | -2.26 | 0 | |||||
| 2025-08-15 | 13F | Morgan Stanley | 975,833 | -4.36 | 27,187 | -11.42 | ||||
| 2025-08-28 | NP | INFL - Horizon Kinetics Inflation Beneficiaries ETF | 188,591 | 2.18 | 5,254 | -5.35 | ||||
| 2025-07-16 | 13F | Signature Resources Capital Management, LLC | 500 | 0.00 | 14 | -13.33 | ||||
| 2025-07-18 | 13F | Requisite Capital Management, LLC | 28,000 | 0.00 | 780 | -7.36 | ||||
| 2025-08-14 | 13F | Peapack Gladstone Financial Corp | 13,182 | 25.76 | 0 | |||||
| 2025-08-15 | 13F | Kestra Advisory Services, LLC | 10,800 | -1.95 | 301 | -9.37 | ||||
| 2025-07-11 | 13F | First PREMIER Bank | 2,210 | 0.00 | 0 | |||||
| 2025-08-06 | 13F | Texas Yale Capital Corp. | 173,150 | 41.98 | 4,824 | 31.49 | ||||
| 2025-08-14 | 13F | Jane Street Group, Llc | 66,574 | 1,855 | ||||||
| 2025-08-14 | 13F | Glenmede Investment Management, LP | 14,502 | 404 | ||||||
| 2025-08-15 | 13F | Tower Research Capital LLC (TRC) | 0 | -100.00 | 0 | |||||
| 2025-08-12 | 13F | Jpmorgan Chase & Co | 10,815 | 16.98 | 301 | 8.27 | ||||
| 2025-08-08 | 13F | Kingsview Wealth Management, LLC | 206,385 | -13.03 | 5,750 | -19.46 | ||||
| 2025-08-01 | 13F | Delta Investment Management, LLC | 294,260 | -1.95 | 8,198 | -9.17 | ||||
| 2025-08-05 | 13F | Freestone Capital Holdings, LLC | 22,500 | -28.71 | 627 | -34.04 | ||||
| 2025-07-09 | 13F | Towerpoint Wealth, LLC | 7,514 | 2.52 | 209 | -5.00 | ||||
| 2025-08-11 | 13F | Anfield Capital Management, LLC | 3,840 | 0.00 | 107 | -7.83 | ||||
| 2025-08-18 | 13F | Rexford Capital Inc | 14,102 | 393 | ||||||
| 2025-08-26 | NP | MDIV - Multi-Asset Diversified Income Index Fund This fund is a listed as child fund of First Trust Advisors Lp and if that institution has disclosed ownership in this security, then these positions will not be double counted when calculating total shares and total value | 163,577 | -4.18 | 4,557 | -11.24 | ||||
| 2025-08-06 | 13F | Moors & Cabot, Inc. | 85,400 | 0.65 | 2,379 | -6.78 | ||||
| 2025-08-14 | 13F | Eight 31 Financial Llc | 9,528 | 2.52 | 265 | -5.02 | ||||
| 2025-08-12 | 13F | Horizon Kinetics Asset Management Llc | 916,849 | 0.48 | 25,543 | -6.93 | ||||
| 2025-08-12 | 13F | Proequities, Inc. | Put | 0 | 0 | |||||
| 2025-08-12 | 13F | Argent Trust Co | 9,000 | 251 | ||||||
| 2025-08-12 | 13F | Proequities, Inc. | Call | 0 | 0 | |||||
| 2025-07-16 | 13F | Essex Financial Services, Inc. | 11,244 | 0.00 | 313 | -7.40 | ||||
| 2025-08-12 | 13F | Proequities, Inc. | 0 | 0 | ||||||
| 2025-08-06 | 13F | Highlander Partners, L.P. | 33,077 | 0.00 | 922 | -7.34 | ||||
| 2025-04-29 | 13F | Hm Payson & Co | 1,384 | -9.78 | 42 | -19.61 | ||||
| 2025-08-14 | 13F | Group One Trading, L.p. | Put | 16,900 | 31.01 | 471 | 21.13 | |||
| 2025-08-14 | 13F | Group One Trading, L.p. | Call | 14,800 | 17.46 | 412 | 8.71 | |||
| 2025-08-15 | NP | Royce Micro-cap Trust, Inc /md/ | 76,981 | 0.00 | 2,145 | -7.39 | ||||
| 2025-08-12 | 13F | BlackRock, Inc. | 2,783 | 0.00 | 78 | -7.23 | ||||
| 2025-08-12 | 13F | Pathstone Holdings, LLC | 8,480 | 0.00 | 236 | -7.45 | ||||
| 2025-08-14 | 13F | Group One Trading, L.p. | 7,357 | 535.87 | 205 | 500.00 | ||||
| 2025-08-06 | 13F | Atlantic Union Bankshares Corp | 1,200 | 33 | ||||||
| 2025-07-18 | 13F | Clarity Financial LLC | 10,520 | 0.00 | 293 | -7.28 | ||||
| 2025-07-24 | NP | ONEQ - Fidelity Nasdaq Composite Index Tracking Stock This fund is a listed as child fund of Fmr Llc and if that institution has disclosed ownership in this security, then these positions will not be double counted when calculating total shares and total value | 16,806 | 450 | ||||||
| 2025-08-15 | NP | Royce Value Trust Inc | 279,148 | 0.00 | 7,777 | -7.37 | ||||
| 2025-05-12 | 13F | National Bank Of Canada /fi/ | 0 | -100.00 | 0 | -100.00 | ||||
| 2025-08-12 | 13F | TCTC Holdings, LLC | 2,000 | 0.00 | 56 | -8.33 | ||||
| 2025-07-25 | 13F | Cwm, Llc | 20,541 | 1,784.50 | 1 | |||||
| 2025-08-14 | 13F | Macquarie Group Ltd | 12,154 | 0.81 | 339 | -6.61 | ||||
| 2025-07-30 | 13F | Crewe Advisors LLC | 729 | 20 | ||||||
| 2025-08-14 | 13F | Wells Fargo & Company/mn | 20,848 | -36.26 | 581 | -41.00 | ||||
| 2025-08-12 | 13F | Steward Partners Investment Advisory, Llc | 165 | 0.00 | 5 | 0.00 | ||||
| 2025-08-07 | 13F | Winch Advisory Services, LLC | 1,000 | 28 | ||||||
| 2025-08-14 | 13F | Principal Street Partners, LLC | 17,587 | -0.05 | 502 | -5.29 | ||||
| 2025-08-13 | 13F | First Trust Advisors Lp | 163,577 | -4.18 | 4,557 | -11.24 | ||||
| 2025-08-07 | 13F | Allworth Financial LP | 3,125 | 0.00 | 87 | -4.40 | ||||
| 2025-05-08 | 13F | XTX Topco Ltd | 0 | -100.00 | 0 | |||||
| 2025-08-08 | 13F | Pnc Financial Services Group, Inc. | 2,570 | 157.00 | 72 | 136.67 | ||||
| 2025-07-29 | 13F | Albert D Mason Inc | 21,441 | -1.19 | 597 | -8.44 | ||||
| 2025-08-15 | NP | RCPFX - Royce Capital Fund - Small-Cap Portfolio Investment Class | 42,602 | -19.20 | 1,187 | -25.17 | ||||
| 2025-07-17 | 13F | Sound Income Strategies, LLC | 287 | 0.00 | 8 | -12.50 | ||||
| 2025-07-16 | 13F | American National Bank | 21,241 | 0.00 | 592 | -7.37 | ||||
| 2025-08-04 | 13F | Canton Hathaway, LLC | 64,740 | 0.15 | 2 | 0.00 | ||||
| 2025-07-15 | 13F | Northside Capital Management, LLC | 21,860 | 0.00 | 609 | -7.31 | ||||
| 2025-08-12 | 13F | One Charles Private Wealth Services, LLC | 10,983 | 0.00 | 306 | -7.58 | ||||
| 2025-08-13 | 13F | EverSource Wealth Advisors, LLC | 61 | 0.00 | 2 | 0.00 | ||||
| 2025-08-14 | 13F | Susquehanna International Group, Llp | Put | 0 | -100.00 | 0 | ||||
| 2025-08-14 | 13F | Bank Of America Corp /de/ | 183,697 | 20.57 | 5,118 | 11.68 | ||||
| 2025-08-14 | 13F | Raymond James Financial Inc | 23,092 | -5.63 | 643 | -12.64 | ||||
| 2025-08-14 | 13F | Fmr Llc | 400 | 11 | ||||||
| 2025-08-14 | 13F | Beaird Harris Wealth Management, LLC | 150 | 4 | ||||||
| 2025-08-14 | 13F | Atomi Financial Group, Inc. | 8,674 | 4.28 | 242 | -3.60 | ||||
| 2025-07-22 | 13F | Autumn Glory Partners, LLC | 16,000 | 446 | ||||||
| 2025-08-28 | NP | Amplify ETF Trust - Amplify Natural Resources Dividend Income ETF | 6,018 | -64.25 | 168 | -67.00 | ||||
| 2025-07-10 | 13F | HWG Holdings LP | 0 | -100.00 | 0 | |||||
| 2025-08-06 | 13F | Round Rock Advisors, LLC | 309,817 | 10.98 | 8,632 | 2.80 | ||||
| 2025-08-05 | 13F | Meixler Investment Management, Ltd. | 413,323 | -0.06 | 11,515 | -7.44 | ||||
| 2025-07-08 | 13F/A | Adams Asset Advisors, LLC | 617,108 | 10.29 | 17,193 | 2.15 | ||||
| 2025-08-11 | 13F | Independent Advisor Alliance | 74,200 | 5.47 | 2,067 | -2.32 | ||||
| 2025-07-15 | 13F | Mather Group, Llc. | 0 | -100.00 | 0 | |||||
| 2025-08-13 | 13F | Natixis | 240,600 | -1.07 | 6,703 | -8.88 | ||||
| 2025-08-14 | 13F | Quantinno Capital Management LP | 17,492 | 487 | ||||||
| 2025-08-14 | 13F | Concorde Financial Corp | 45,751 | -6.92 | 1,275 | -13.80 | ||||
| 2025-06-25 | NP | VRAI - Virtus Real Asset Income ETF | 5,169 | 11.62 | 148 | 2.07 | ||||
| 2025-07-31 | 13F/A | Avion Wealth | 312 | 0 | ||||||
| 2025-08-13 | 13F | Virtus ETF Advisers LLC | 0 | -100.00 | 0 | |||||
| 2025-07-17 | 13F | GraniteShares Advisors LLC | 83,205 | 6.67 | 2,318 | -1.19 | ||||
| 2025-08-13 | 13F | Fort Sheridan Advisors Llc | 13,794 | -14.41 | 384 | -20.66 | ||||
| 2025-05-09 | 13F | Pathway Financial Advisers, LLC | 0 | -100.00 | 0 | |||||
| 2025-08-05 | 13F | Simplex Trading, Llc | Put | 300 | 0 | |||||
| 2025-08-05 | 13F | Simplex Trading, Llc | Call | 24,600 | -22.88 | 1 | ||||
| 2025-07-24 | 13F | Lee Financial Co | 24,605 | 0.00 | 685 | -7.43 | ||||
| 2025-07-23 | 13F | Mraz, Amerine & Associates, Inc. | 44,519 | -1.05 | 1,240 | -8.22 | ||||
| 2025-08-14 | 13F | MIRAE ASSET GLOBAL ETFS HOLDINGS Ltd. | 0 | -100.00 | 0 | |||||
| 2025-08-14 | 13F | Toroso Investments, LLC | 0 | -100.00 | 0 | |||||
| 2025-08-14 | 13F | Susquehanna International Group, Llp | 15,761 | 14.83 | 439 | 6.55 | ||||
| 2025-08-29 | NP | GraniteShares ETF Trust - GraniteShares HIPS US High Income ETF | 83,205 | 6.67 | 2,318 | -1.19 | ||||
| 2025-08-18 | 13F | Geneos Wealth Management Inc. | 2,675 | 127.66 | 75 | 111.43 | ||||
| 2025-07-31 | 13F | Cambridge Investment Research Advisors, Inc. | 0 | -100.00 | 0 | |||||
| 2025-08-26 | NP | Ivy Variable Insurance Portfolios - Ivy VIP Energy Class II | 12,154 | 0.81 | 339 | -6.63 | ||||
| 2025-08-13 | 13F | Lido Advisors, LLC | 15,650 | 0.00 | 436 | -7.23 | ||||
| 2025-07-29 | 13F | Burford Brothers, Inc. | 36,210 | -13.93 | 1,009 | -20.32 | ||||
| 2025-08-14 | 13F | Citadel Advisors Llc | Call | 32,800 | -16.33 | 914 | -22.56 | |||
| 2025-08-14 | 13F | Royal Bank Of Canada | 74,166 | -0.41 | 2,067 | -7.72 | ||||
| 2025-08-12 | 13F | Inscription Capital, LLC | 66,000 | 62.96 | 1,839 | 34.65 | ||||
| 2025-08-14 | 13F | Citadel Advisors Llc | 97,038 | -34.88 | 2,703 | -39.69 | ||||
| 2025-08-14 | 13F | Citadel Advisors Llc | Put | 18,700 | -24.90 | 521 | -30.48 | |||
| 2025-09-04 | 13F/A | Advisor Group Holdings, Inc. | 3,748 | 14.09 | 104 | 6.12 | ||||
| 2025-08-26 | NP | GAFCX - Virtus AlphaSimplex Global Alternatives Fund Class C | 2,623 | 33.76 | 73 | 25.86 | ||||
| 2025-05-14 | 13F | Fisher Asset Management, LLC | 0 | -100.00 | 0 | |||||
| 2025-07-25 | 13F | Community Bank, N.A. | 50,010 | 0.00 | 1,393 | -7.32 | ||||
| 2025-05-15 | 13F | TCG Advisory Services, LLC | 0 | -100.00 | 0 | |||||
| 2025-07-18 | 13F | Trust Co Of Vermont | 13,766 | -4.81 | 384 | -11.75 | ||||
| 2025-04-17 | 13F | Exchange Traded Concepts, Llc | 0 | -100.00 | 0 | |||||
| 2025-08-14 | 13F/A | Barclays Plc | 141 | 0 | ||||||
| 2025-07-24 | 13F | IFP Advisors, Inc | 500 | 0.00 | 14 | -13.33 | ||||
| 2025-08-07 | 13F | Kestra Private Wealth Services, Llc | 9,057 | -1.24 | 252 | -8.36 | ||||
| 2025-05-08 | 13F | Harbour Investments, Inc. | 0 | -100.00 | 0 | |||||
| 2025-08-06 | 13F | S&t Bank/pa | 7,300 | 0.00 | 203 | -7.31 | ||||
| 2025-08-14 | 13F | Bbr Partners, Llc | 19,456 | 0.00 | 542 | -7.35 | ||||
| 2025-08-27 | NP | Mason Capital Fund Trust - Fundamentals First ETF | 1,528 | 0.00 | 43 | -6.67 | ||||
| 2025-08-18 | 13F | N.E.W. Advisory Services LLC | 11,599 | 0.00 | 323 | -7.18 | ||||
| 2025-07-23 | 13F | Sax Wealth Advisors, Llc | 9,650 | 0.00 | 269 | -7.59 | ||||
| 2025-08-08 | 13F | Cetera Investment Advisers | 10,513 | 293 |