Mga Batayang Estadistika
| Pemilik Institusional | 220 total, 220 long only, 0 short only, 0 long/short - change of 0.46% MRQ |
| Alokasi Portofolio Rata-rata | 0.8344 % - change of 19.74% MRQ |
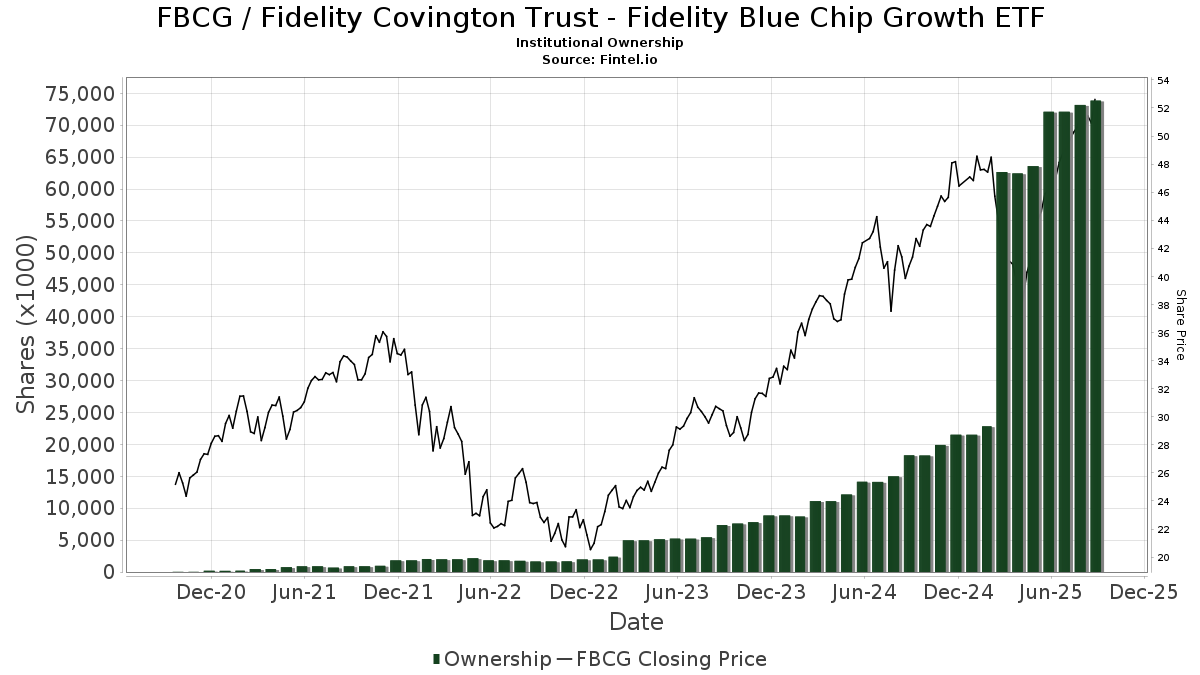
| Saham Institusional (Jangka Panjang) | 73,853,136 (ex 13D/G) - change of 1.75MM shares 2.42% MRQ |
| Nilai Institusional (Jangka Panjang) | $ 3,174,055 USD ($1000) |
Kepemilikan Institusional dan Pemegang Saham
Fidelity Covington Trust - Fidelity Blue Chip Growth ETF (US:FBCG) memiliki 220 pemilik institusional dan pemegang saham yang telah mengajukan formulir 13D/G atau 13F kepada Komisi Bursa Efek (Securities Exchange Commission/SEC). Lembaga-lembaga ini memegang total 73,853,136 saham. Pemegang saham terbesar meliputi Fmr Llc, Jpmorgan Chase & Co, Sagespring Wealth Partners, Llc, Dynasty Wealth Management, Llc, FASMX - Fidelity Asset Manager 50%, FASGX - Fidelity Asset Manager 70%, FAMRX - Fidelity Asset Manager 85%, Commonwealth Equity Services, Llc, FSANX - Fidelity Asset Manager 60%, and Variable Insurance Products Fund V - FundsManager 60% Portfolio Investor Class .
Struktur kepemilikan institusional Fidelity Covington Trust - Fidelity Blue Chip Growth ETF (BATS:FBCG) menunjukkan posisi terkini di perusahaan oleh institusi dan dana, serta perubahan terbaru dalam ukuran posisi. Pemegang saham utama dapat mencakup investor individu, reksa dana, dana lindung nilai, atau institusi. Jadwal 13D menunjukkan bahwa investor memegang (atau pernah memegang) lebih dari 5% saham perusahaan dan bermaksud (atau pernah bermaksud) untuk secara aktif mengejar perubahan strategi bisnis. Jadwal 13G menunjukkan investasi pasif lebih dari 5%.
The share price as of September 5, 2025 is 51.37 / share. Previously, on September 9, 2024, the share price was 39.49 / share. This represents an increase of 30.08% over that period.
Skor Sentimen Dana
Skor Sentimen Dana (sebelumnya dikenal sebagai Skor Akumulasi Kepemilikan) menemukan saham-saham yang paling banyak dibeli oleh dana. Ini adalah hasil dari model kuantitatif multi-faktor yang canggih yang mengidentifikasi perusahaan dengan tingkat akumulasi institusional tertinggi. Model penilaian menggunakan kombinasi dari total peningkatan pemilik yang diungkapkan, perubahan dalam alokasi portofolio pada pemilik tersebut, dan metrik lainnya. Angka berkisar dari 0 hingga 100, dengan angka yang lebih tinggi menunjukkan tingkat akumulasi yang lebih tinggi dibandingkan dengan perusahaan sejenisnya, dan 50 adalah rata-ratanya.
Frekuensi Pembaruan: Setiap Hari
Lihat Ownership Explorer, yang menyediakan daftar perusahaan dengan peringkat tertinggi.
Rasio Put/Call Institusional
Selain melaporkan isu ekuitas dan utang standar, institusi dengan aset di bawah manajemen lebih dari 100 juta dolar AS juga harus mengungkapkan kepemilikan opsi put dan call mereka. Karena opsi put umumnya menunjukkan sentimen negatif, dan opsi call menunjukkan sentimen positif, kita dapat mengetahui sentimen institusional secara keseluruhan dengan memplot rasio put terhadap call. Grafik di sebelah kanan memplot rasio put/call historis untuk instrumen ini.
Menggunakan Rasio Put/Call sebagai indikator sentimen investor mengatasi salah satu kekurangan utama dari penggunaan total kepemilikan institusional, yaitu sejumlah besar aset yang dikelola diinvestasikan secara pasif untuk melacak indeks. Dana yang dikelola secara pasif biasanya tidak membeli opsi, sehingga indikator rasio put/call lebih akurat dalam melacak sentimen dana yang dikelola secara aktif.
Pengajuan 13F dan NPORT
Detail pada pengajuan 13F tersedia gratis. Detail pada pengajuan NP memerlukan keanggotaan premium. Baris berwarna hijau menunjukkan posisi baru. Baris berwarna merah menunjukkan posisi yang sudah ditutup. Klik tautan ini ikon untuk melihat riwayat transaksi selengkapnya.
Tingkatkan
untuk membuka data premium dan mengekspor ke Excel ![]() .
.
| Tanggal File | Sumber | Investor | Ketik | Presyo ng Avg (Silangan) |
Saham | Δ Saham (%) |
Dilaporkan Nilai ($1000) |
Nilai Δ (%) |
Alokasi Port (%) |
|
|---|---|---|---|---|---|---|---|---|---|---|
| 2025-08-08 | 13F | Foundations Investment Advisors, LLC | 5,926 | 286 | ||||||
| 2025-08-12 | 13F | Jpmorgan Chase & Co | 9,239,076 | -4.61 | 445,693 | 15.13 | ||||
| 2025-07-14 | 13F | McGlone Suttner Wealth Management, Inc. | 28,507 | 0.00 | 1,375 | 20.72 | ||||
| 2025-07-17 | 13F | Janney Montgomery Scott LLC | 158,537 | -1.49 | 8 | 16.67 | ||||
| 2025-07-24 | 13F | Accredited Investor Services, Llc | 439,551 | 2.91 | 21,204 | 24.20 | ||||
| 2025-07-09 | 13F | Keystone Wealth Services, LLC | 94,383 | 4.73 | 4,553 | 26.40 | ||||
| 2025-08-05 | 13F | Plante Moran Financial Advisors, LLC | 0 | -100.00 | 0 | |||||
| 2025-08-14 | 13F | Two Sigma Securities, Llc | 0 | -100.00 | 0 | |||||
| 2025-08-08 | 13F | Capital Investment Advisory Services, LLC | 350 | 0.00 | 17 | 23.08 | ||||
| 2025-08-11 | 13F | United Advisor Group, LLC | 0 | -100.00 | 0 | |||||
| 2025-07-25 | 13F | Investment Advisory Group, LLC | 17,722 | -1.02 | 855 | 19.44 | ||||
| 2025-04-21 | 13F | Nelson, Van Denburg & Campbell Wealth Management Group, LLC | 0 | -100.00 | 0 | |||||
| 2025-07-18 | 13F | First United Bank Trust/ | 250 | 0.00 | 12 | 33.33 | ||||
| 2025-08-14 | 13F | Fmr Llc | 20,584,359 | 2.58 | 992,989 | 23.80 | ||||
| 2025-08-22 | NP | Variable Insurance Products Fund V - FundsManager 30% Portfolio Service Class | 2,360 | 5.55 | 114 | 26.97 | ||||
| 2025-08-22 | NP | Variable Insurance Products Fund V - FundsManager 60% Portfolio Investor Class | 1,726,656 | 3.90 | 83,294 | 25.39 | ||||
| 2025-08-15 | 13F/A | Florida Financial Advisors, Llc | 10,001 | 29.61 | 482 | 56.49 | ||||
| 2025-08-14 | 13F | Stifel Financial Corp | 103,375 | 110.38 | 4,987 | 153.87 | ||||
| 2025-08-07 | 13F | Kestra Private Wealth Services, Llc | 183,734 | -13.49 | 8,863 | 4.41 | ||||
| 2025-07-31 | 13F | MN Wealth Advisors, LLC | 75,087 | 7.15 | 3,622 | 29.31 | ||||
| 2025-08-14 | 13F | Broadleaf Partners, LLC | 136,407 | 14.86 | 6,580 | 38.64 | ||||
| 2025-07-14 | 13F | Sowell Financial Services LLC | 157,832 | 7,614 | ||||||
| 2025-08-14 | 13F | Snowden Capital Advisors LLC | 6,197 | -1.27 | 299 | 19.20 | ||||
| 2025-08-14 | 13F | Menora Mivtachim Holdings Ltd. | 108,710 | 56.53 | 5,244 | 88.97 | ||||
| 2025-08-19 | 13F | Cape Investment Advisory, Inc. | 114 | 0.00 | 6 | 25.00 | ||||
| 2025-08-14 | 13F | UBS Group AG | 874,474 | -6.27 | 42,185 | 13.12 | ||||
| 2025-08-14 | 13F | Susquehanna International Group, Llp | 13,472 | -89.82 | 650 | -87.73 | ||||
| 2025-07-15 | 13F | Avaii Wealth Management, Llc | 20,021 | 35.63 | 966 | 63.56 | ||||
| 2025-07-21 | 13F | Ameritas Advisory Services, LLC | 4,446 | 214 | ||||||
| 2025-08-15 | 13F | Captrust Financial Advisors | 70,408 | 179.45 | 3,396 | 237.24 | ||||
| 2025-08-01 | 13F | Envestnet Asset Management Inc | 723,997 | 25.40 | 34,926 | 51.35 | ||||
| 2025-08-14 | 13F | CoreCap Advisors, LLC | 9,107 | 26.68 | 439 | 52.96 | ||||
| 2025-08-22 | NP | FHLKX - Fidelity Health Savings Fund Class K This fund is a listed as child fund of Fmr Llc and if that institution has disclosed ownership in this security, then these positions will not be double counted when calculating total shares and total value | 14,330 | -7.98 | 691 | 11.09 | ||||
| 2025-08-11 | 13F | Nations Financial Group Inc, /ia/ /adv | 346,598 | 12.30 | 16,720 | 35.54 | ||||
| 2025-05-01 | 13F | Quest 10 Wealth Builders, Inc. | 0 | -100.00 | 0 | |||||
| 2025-05-02 | 13F | Wealthfront Advisers Llc | 0 | -100.00 | 0 | -100.00 | ||||
| 2025-08-06 | 13F | Moors & Cabot, Inc. | 0 | -100.00 | 0 | |||||
| 2025-08-05 | 13F | Sigma Planning Corp | 105,456 | 0.08 | 5,087 | 20.80 | ||||
| 2025-08-13 | 13F | Per Stirling Capital Management, LLC. | 124,476 | -9.93 | 6,005 | 8.71 | ||||
| 2025-08-22 | NP | Variable Insurance Products Fund V - FundsManager 50% Portfolio Investor Class | 797,661 | 3.15 | 38,479 | 24.50 | ||||
| 2025-07-17 | 13F | San Luis Wealth Advisors LLC | 10,878 | 18.26 | 1 | |||||
| 2025-05-15 | 13F/A | Orion Portfolio Solutions, LLC | 8,444 | -39.69 | 338 | -47.91 | ||||
| 2025-07-02 | 13F | Central Pacific Bank - Trust Division | 180 | 0.00 | 9 | 14.29 | ||||
| 2025-09-04 | 13F/A | Advisor Group Holdings, Inc. | 70,394 | 70.85 | 3,389 | 105.77 | ||||
| 2025-07-28 | 13F | Sagespring Wealth Partners, Llc | 6,228,360 | 0.55 | 300,456 | 21.36 | ||||
| 2025-07-25 | 13F | Yarger Wealth Strategies, Llc | 17,206 | 0.00 | 830 | 20.82 | ||||
| 2025-04-08 | 13F | Parallel Advisors, LLC | 0 | -100.00 | 0 | |||||
| 2025-07-02 | 13F | Dentgroup LLC | 68,529 | 157.00 | 3,306 | 210.33 | ||||
| 2025-07-22 | 13F | SOL Capital Management CO | 12,630 | 16.62 | 1 | |||||
| 2025-07-30 | 13F | Advantage Trust Co | 179,751 | 7.59 | 8,671 | 29.86 | ||||
| 2025-08-04 | 13F | Spire Wealth Management | 511 | -1.35 | 25 | 20.00 | ||||
| 2025-08-14 | 13F | Goodwin Investment Advisory | 938,001 | 46.18 | 45,249 | 76.43 | ||||
| 2025-08-15 | 13F | Tower Research Capital LLC (TRC) | 0 | -100.00 | 0 | |||||
| 2025-07-16 | 13F | Kerntke Otto McGlone Wealth Management Group | 12,668 | 16.03 | 611 | 40.14 | ||||
| 2025-07-31 | 13F | Sequent Asset Management, LLC | 31,019 | -0.49 | 1,496 | 20.16 | ||||
| 2025-08-12 | 13F | BlackRock, Inc. | 1,780 | -11.97 | 86 | 6.25 | ||||
| 2025-08-14 | 13F | Clg Llc | 90,057 | 55.36 | 4,344 | 87.56 | ||||
| 2025-08-14 | 13F | GWM Advisors LLC | 20,491 | -11.04 | 988 | 7.39 | ||||
| 2025-08-22 | NP | FASGX - Fidelity Asset Manager 70% This fund is a listed as child fund of Fmr Llc and if that institution has disclosed ownership in this security, then these positions will not be double counted when calculating total shares and total value | 4,076,229 | 1.92 | 196,637 | 23.00 | ||||
| 2025-04-22 | 13F | Synergy Financial Management, LLC | 0 | -100.00 | 0 | |||||
| 2025-08-22 | NP | Variable Insurance Products Fund V - Asset Manager Portfolio Initial Class | 414,236 | 1.39 | 19,983 | 22.37 | ||||
| 2025-08-08 | 13F | Pnc Financial Services Group, Inc. | 110,724 | 11.69 | 5,341 | 34.81 | ||||
| 2025-05-12 | 13F | Condor Capital Management | 0 | -100.00 | 0 | |||||
| 2025-08-14 | 13F | Dagco, Inc. | 1,879 | 0.00 | 91 | 20.00 | ||||
| 2025-07-29 | 13F | AssuredPartners Investment Advisors, LLC | 406,951 | -5.43 | 19,631 | 14.13 | ||||
| 2025-08-05 | 13F | Carolinas Wealth Consulting Llc | 0 | -100.00 | 0 | -100.00 | ||||
| 2025-08-11 | 13F | Elequin Capital Lp | 11,145 | -65.00 | 538 | -57.78 | ||||
| 2025-07-22 | 13F | Unique Wealth, Llc | 369,737 | 20.03 | 17,836 | 44.87 | ||||
| 2025-07-28 | 13F | Mitchell Mcleod Pugh & Williams Inc | 110,479 | 21.83 | 5,330 | 47.05 | ||||
| 2025-04-10 | 13F | Brand Asset Management Group, Inc. | 0 | -100.00 | 0 | |||||
| 2025-07-24 | 13F | Cyndeo Wealth Partners, LLC | 119,094 | 1.07 | 5,745 | 22.00 | ||||
| 2025-07-24 | 13F | Tandem Capital Management Corp /adv | 16,195 | -0.98 | 781 | 19.60 | ||||
| 2025-07-28 | 13F | Variant Private Wealth, LLC | 103,467 | 0.68 | 4,991 | 21.52 | ||||
| 2025-07-18 | 13F | Bartlett & Co. Wealth Management Llc | 355 | 0.00 | 17 | 21.43 | ||||
| 2025-08-04 | 13F | Bay Colony Advisory Group, Inc d/b/a Bay Colony Advisors | 4,177 | 202 | ||||||
| 2025-04-25 | 13F | WASHINGTON TRUST Co | 0 | -100.00 | 0 | |||||
| 2025-07-18 | 13F | Childress Capital Advisors, Llc | 82,590 | 20.59 | 3,984 | 45.56 | ||||
| 2025-08-13 | 13F | IAG Wealth Partners, LLC | 115 | 0.00 | 6 | 25.00 | ||||
| 2025-08-14 | 13F | Atomi Financial Group, Inc. | 0 | -100.00 | 0 | |||||
| 2025-08-13 | 13F | Milestone Investment Advisors LLC | 30,080 | 88.90 | 1,451 | 128.14 | ||||
| 2025-08-13 | 13F | EverSource Wealth Advisors, LLC | 0 | -100.00 | 0 | |||||
| 2025-07-28 | 13F | Mutual Advisors, LLC | 43,461 | 3.60 | 2,174 | 28.20 | ||||
| 2025-08-12 | 13F | Proequities, Inc. | 0 | 0 | ||||||
| 2025-08-13 | 13F | Jones Financial Companies Lllp | 92,004 | 29.66 | 4,420 | 55.33 | ||||
| 2025-07-14 | 13F | Sentinel Pension Advisors Inc | 16,621 | 3.45 | 802 | 24.77 | ||||
| 2025-05-09 | 13F | Pathway Financial Advisers, LLC | 0 | -100.00 | 0 | -100.00 | ||||
| 2025-08-12 | 13F | O'shaughnessy Asset Management, Llc | 1,804 | 1,102.67 | 87 | 1,640.00 | ||||
| 2025-07-16 | 13F/A | CX Institutional | 13 | 0 | ||||||
| 2025-08-08 | 13F | Ogorek Anthony Joseph /ny/ /adv | 1,932 | 0.00 | 0 | |||||
| 2025-08-14 | 13F | Bank Of America Corp /de/ | 1,523,298 | 9.55 | 73,484 | 32.21 | ||||
| 2025-07-23 | 13F | Elm3 Financial Group, LLC | 11,623 | 5.58 | 561 | 27.27 | ||||
| 2025-08-13 | 13F | Summit Wealth Group Llc / Co | 56,921 | 2,746 | ||||||
| 2025-07-31 | 13F | Cambridge Investment Research Advisors, Inc. | 442,839 | 12.22 | 21 | 40.00 | ||||
| 2025-08-08 | 13F | Cetera Investment Advisers | 426,266 | 12.42 | 20,563 | 35.69 | ||||
| 2025-07-16 | 13F | Meridian Financial, LLC | 17,379 | -3.61 | 838 | 16.39 | ||||
| 2025-07-23 | 13F | Clear Creek Financial Management, LLC | 55,733 | 11.08 | 2,689 | 34.06 | ||||
| 2025-08-07 | 13F | McClarren Financial Advisors, Inc. | 0 | -100.00 | 0 | |||||
| 2025-08-12 | 13F | MWA Asset Management | 4,935 | 238 | ||||||
| 2025-07-24 | 13F | IFP Advisors, Inc | 28,846 | -27.18 | 1,392 | -12.13 | ||||
| 2025-07-21 | 13F | Portfolio Strategies, Inc. | 748,753 | 11.07 | 36,118 | 34.05 | ||||
| 2025-07-25 | 13F | Johnson Investment Counsel Inc | 0 | -100.00 | 0 | |||||
| 2025-08-04 | 13F | Adell Harriman & Carpenter Inc | 38,935 | 6.93 | 1,878 | 29.07 | ||||
| 2025-07-28 | 13F | Kiker Wealth Management, LLC | 491 | 24 | ||||||
| 2025-07-01 | 13F | Harbor Investment Advisory, Llc | 6,650 | -2.92 | 321 | 17.22 | ||||
| 2025-08-08 | 13F | Creative Planning | 271,941 | -76.51 | 13,118 | -71.65 | ||||
| 2025-07-18 | 13F | Victrix Investment Advisors | 5,980 | 0.00 | 288 | 20.50 | ||||
| 2025-05-14 | 13F | Renaissance Technologies Llc | 0 | -100.00 | 0 | |||||
| 2025-05-05 | 13F | Transce3nd, LLC | 0 | -100.00 | 0 | |||||
| 2025-07-28 | 13F | Harbour Investments, Inc. | 61,195 | 6.76 | 2,952 | 28.85 | ||||
| 2025-08-13 | 13F | WCG Wealth Advisors LLC | 43,193 | -3.65 | 2,084 | 16.30 | ||||
| 2025-08-14 | 13F | Raymond James Financial Inc | 4,198 | 203 | ||||||
| 2025-07-25 | 13F | Cwm, Llc | 851,538 | 19.05 | 41 | 46.43 | ||||
| 2025-08-22 | NP | Variable Insurance Products Fund V - FundsManager 70% Portfolio Investor Class | 678,009 | 4.29 | 32,707 | 25.87 | ||||
| 2025-08-04 | 13F | Hicks Capital Management Llc | 0 | -100.00 | 0 | |||||
| 2025-07-22 | 13F | Wealthcare Advisory Partners LLC | 7,504 | 6.38 | 362 | 28.47 | ||||
| 2025-08-12 | 13F | GDS Wealth Management | 0 | -100.00 | 0 | |||||
| 2025-08-05 | 13F | Dahring | Cusmano Llc | 107,832 | 20.01 | 5,202 | 44.83 | ||||
| 2025-08-14 | 13F | Wells Fargo & Company/mn | 654,428 | 0.31 | 31,570 | 21.07 | ||||
| 2025-08-08 | 13F | Gts Securities Llc | 23,422 | -78.49 | 1,130 | -74.06 | ||||
| 2025-07-15 | 13F | FLP Wealth Management, LLC | 0 | -100.00 | 0 | -100.00 | ||||
| 2025-08-15 | 13F | CI Private Wealth, LLC | 0 | -100.00 | 0 | |||||
| 2025-08-01 | 13F | Chilton Capital Management Llc | 300 | 0.00 | 14 | 27.27 | ||||
| 2025-05-09 | 13F | Liberty Wealth Management Llc | 42,625 | 290.12 | 325 | -35.64 | ||||
| 2025-08-13 | 13F | Bare Financial Services, Inc | 155 | 0.00 | 7 | 16.67 | ||||
| 2025-07-09 | 13F | Inspirion Wealth Advisors, Llc | 5,343 | 0.00 | 258 | 20.66 | ||||
| 2025-07-22 | 13F | IVC Wealth Advisors LLC | 6,745 | 0.60 | 325 | 21.72 | ||||
| 2025-08-22 | NP | FFNCX - Fidelity Asset Manager 40% Fidelity Advisor Asset Manager 40%: Class C This fund is a listed as child fund of Fmr Llc and if that institution has disclosed ownership in this security, then these positions will not be double counted when calculating total shares and total value | 854,307 | 0.29 | 41,212 | 21.05 | ||||
| 2025-08-14 | 13F | Hrt Financial Lp | 0 | -100.00 | 0 | |||||
| 2025-08-14 | 13F | Jane Street Group, Llc | 6,931 | -98.68 | 334 | -98.41 | ||||
| 2025-08-22 | NP | FASMX - Fidelity Asset Manager 50% This fund is a listed as child fund of Fmr Llc and if that institution has disclosed ownership in this security, then these positions will not be double counted when calculating total shares and total value | 4,379,716 | 1.30 | 211,277 | 22.26 | ||||
| 2025-08-08 | 13F | Larson Financial Group LLC | 6,398 | -13.13 | 309 | 4.76 | ||||
| 2025-08-14 | 13F | Mercer Global Advisors Inc /adv | 0 | -100.00 | 0 | |||||
| 2025-07-29 | 13F | International Assets Investment Management, Llc | 14,337 | 16.78 | 692 | 41.02 | ||||
| 2025-08-12 | 13F | Guerra Advisors Inc | 26,701 | 0.00 | 1,288 | 20.71 | ||||
| 2025-07-10 | 13F | Worth Asset Management, LLC | 4,301 | -39.85 | 207 | -27.37 | ||||
| 2025-07-30 | 13F | LGT Financial Advisors LLC | 11,000 | 0.00 | 531 | 20.73 | ||||
| 2025-08-12 | 13F | PKS Advisory Services, LLC | 86,813 | -20.86 | 4,188 | -4.49 | ||||
| 2025-07-29 | 13F | Salus Financial Advisors, LLC | 216,821 | 23.72 | 10,459 | 49.33 | ||||
| 2025-07-07 | 13F | Centurion Wealth Management LLC | 36,848 | 3.82 | 1,778 | 8.29 | ||||
| 2025-08-14 | 13F | Citadel Advisors Llc | 0 | -100.00 | 0 | |||||
| 2025-07-11 | 13F | Farther Finance Advisors, LLC | 400 | 19 | ||||||
| 2025-07-28 | 13F | BRYN MAWR TRUST Co | 54 | 0.00 | 3 | 0.00 | ||||
| 2025-08-14 | 13F | D. E. Shaw & Co., Inc. | 14,118 | 0.00 | 681 | 20.74 | ||||
| 2025-07-18 | 13F | Truist Financial Corp | 7,798 | -1.87 | 376 | 18.61 | ||||
| 2025-07-14 | 13F | Armstrong Advisory Group, Inc | 1,609 | -2.31 | 78 | 1.32 | ||||
| 2025-08-26 | 13F/A | Thrivent Financial For Lutherans | 1,592,192 | 77 | ||||||
| 2025-04-16 | 13F/A | Western Wealth Management, LLC | 0 | -100.00 | 0 | |||||
| 2025-07-07 | 13F | Roxbury Financial LLC | 90,514 | 3.40 | 4,366 | 10.98 | ||||
| 2025-08-22 | NP | Variable Insurance Products Fund V - FundsManager 20% Portfolio Investor Class | 52,472 | 0.80 | 2,531 | 21.68 | ||||
| 2025-07-25 | 13F | Atria Wealth Solutions, Inc. | 6,090 | -90.37 | 294 | -88.41 | ||||
| 2025-07-17 | 13F | Fifth Third Securities, Inc. | 13,646 | 17.36 | 658 | 41.81 | ||||
| 2025-08-14 | 13F | Qube Research & Technologies Ltd | 0 | -100.00 | 0 | |||||
| 2025-07-24 | 13F | KFA Private Wealth Group, LLC | 848,456 | 1.45 | 40,930 | 22.44 | ||||
| 2025-08-22 | NP | Variable Insurance Products Fund V - Asset Manager Growth Portfolio Investor Class | 169,821 | 2.78 | 8,192 | 24.05 | ||||
| 2025-07-15 | 13F | Centerline Wealth Advisors, LLC | 459,691 | 18.92 | 22,175 | 43.53 | ||||
| 2025-08-22 | NP | FSANX - Fidelity Asset Manager 60% This fund is a listed as child fund of Fmr Llc and if that institution has disclosed ownership in this security, then these positions will not be double counted when calculating total shares and total value | 2,189,221 | 1.78 | 105,608 | 22.85 | ||||
| 2025-08-27 | 13F/A | Brinker Capital Investments, LLC | 18,147 | 114.91 | 875 | 159.64 | ||||
| 2025-08-13 | 13F | Cerity Partners LLC | 0 | -100.00 | 0 | |||||
| 2025-08-12 | 13F | Vestor Capital, Llc | 59,000 | 1,503.26 | 1 | |||||
| 2025-08-08 | 13F | Meridian Wealth Management, LLC | 28,316 | 0.00 | 1,366 | 20.69 | ||||
| 2025-07-30 | 13F | Onyx Bridge Wealth Group LLC | 71,547 | 58.01 | 3,451 | 90.77 | ||||
| 2025-08-14 | 13F | Mml Investors Services, Llc | 1,158,247 | 2.09 | 56 | 22.22 | ||||
| 2025-08-22 | NP | FAMRX - Fidelity Asset Manager 85% This fund is a listed as child fund of Fmr Llc and if that institution has disclosed ownership in this security, then these positions will not be double counted when calculating total shares and total value | 3,118,185 | 2.77 | 150,421 | 24.03 | ||||
| 2025-07-10 | 13F | Global Financial Private Client, LLC | 0 | -100.00 | 0 | |||||
| 2025-08-14 | 13F | Two Sigma Investments, Lp | 622,700 | 45.87 | 30,039 | 76.05 | ||||
| 2025-07-22 | 13F | PUREfi Wealth, LLC | 31,639 | 75.24 | 1,526 | 111.65 | ||||
| 2025-08-05 | 13F | Bank of New York Mellon Corp | 18,163 | 23.21 | 876 | 48.73 | ||||
| 2025-08-08 | 13F | Avantax Advisory Services, Inc. | 408,846 | 21.23 | 19,723 | 46.32 | ||||
| 2025-08-12 | 13F | 17 Capital Partners, Llc | 14,033 | 21.54 | 677 | 46.64 | ||||
| 2025-07-24 | 13F | Stonebridge Financial Group, LLC | 0 | -100.00 | 0 | |||||
| 2025-08-13 | 13F | Capital Analysts, Inc. | 300,369 | 53.30 | 14 | 100.00 | ||||
| 2025-04-23 | 13F | Win Advisors, Inc | 0 | -100.00 | 0 | |||||
| 2025-07-10 | 13F | Wealth Enhancement Advisory Services, Llc | 69,162 | -70.45 | 3,367 | -64.01 | ||||
| 2025-07-31 | 13F | FSM Wealth Advisors, LLC | 11,189 | 540 | ||||||
| 2025-08-07 | 13F | Rollins Financial Advisors, LLC | 67,171 | -18.96 | 3,240 | -2.17 | ||||
| 2025-08-07 | 13F | Resources Investment Advisors, LLC. | 328,306 | 15,837 | ||||||
| 2025-07-24 | 13F | Us Bancorp \de\ | 500 | 24 | ||||||
| 2025-08-15 | 13F | First Heartland Consultants, Inc. | 191,556 | 12.08 | 9,241 | 35.27 | ||||
| 2025-08-11 | 13F | HighTower Advisors, LLC | 344,333 | -29.89 | 16,611 | -15.39 | ||||
| 2025-08-07 | 13F | Traynor Capital Management, Inc. | 24,291 | 35.40 | 1,160 | 61.65 | ||||
| 2025-08-14 | 13F | Ancora Advisors, LLC | 1,085 | 52 | ||||||
| 2025-07-16 | 13F | Essex Financial Services, Inc. | 76,357 | -21.63 | 3,683 | -5.42 | ||||
| 2025-08-12 | 13F | MAI Capital Management | 211 | 0.00 | 10 | 25.00 | ||||
| 2025-08-12 | 13F | J.w. Cole Advisors, Inc. | 244,565 | 47.26 | 11,798 | 77.75 | ||||
| 2025-08-19 | 13F | National Asset Management, Inc. | 52,875 | -6.20 | 2,551 | -2.19 | ||||
| 2025-07-29 | 13F | Sowa Financial Group, Inc. | 550,146 | 15.31 | 27 | 36.84 | ||||
| 2025-08-11 | 13F | Private Advisor Group, LLC | 47,060 | -11.87 | 2,270 | 6.37 | ||||
| 2025-08-13 | 13F | Cary Street Partners Financial Llc | 34,519 | -3.21 | 1,665 | 16.84 | ||||
| 2025-07-23 | 13F | Sachetta, LLC | 25,493 | -5.44 | 1,230 | 14.11 | ||||
| 2025-08-08 | 13F | Mv Capital Management, Inc. | 220,412 | -0.80 | 10,633 | 19.73 | ||||
| 2025-08-15 | 13F | Sugar Maple Asset Management, LLC | 0 | -100.00 | 0 | |||||
| 2025-08-04 | 13F | Assetmark, Inc | 366 | -34.05 | 18 | -22.73 | ||||
| 2025-08-14 | 13F | Wiley Bros.-aintree Capital, Llc | 279,005 | -1.06 | 13,459 | 19.02 | ||||
| 2025-07-31 | 13F | Hobart Private Capital, LLC | 13,683 | -26.34 | 660 | -11.05 | ||||
| 2025-08-13 | 13F | Marshall Wace, Llp | 21,554 | 1,040 | ||||||
| 2025-08-14 | 13F | Certified Advisory Corp | 29,331 | 14.32 | 1,415 | 37.95 | ||||
| 2025-08-13 | 13F | Twin Peaks Wealth Advisors, LLC | 66 | 3 | ||||||
| 2025-08-06 | 13F | Mark Sheptoff Financial Planning, Llc | 599 | -27.83 | 29 | -15.15 | ||||
| 2025-07-30 | 13F | Canvas Wealth Advisors, LLC | 10,426 | 5.01 | 524 | 41.62 | ||||
| 2025-08-06 | 13F | Forbes Financial Planning, Inc. | 81,200 | 3,917 | ||||||
| 2025-08-12 | 13F | LPL Financial LLC | 102,754 | 302.25 | 4,957 | 385.41 | ||||
| 2025-08-14 | 13F | Comerica Bank | 4,826 | -9.10 | 233 | 9.43 | ||||
| 2025-08-13 | 13F | Johnson Financial Group, Inc. | 300 | -39.15 | 14 | -26.32 | ||||
| 2025-07-14 | 13F | Abound Wealth Management | 329 | 0.00 | 16 | 15.38 | ||||
| 2025-08-05 | 13F | Bank Of Montreal /can/ | 1,240 | -25.97 | 60 | -10.61 | ||||
| 2025-08-14 | 13F | Ausdal Financial Partners, Inc. | 6,195 | 23.33 | 299 | 49.00 | ||||
| 2025-07-30 | 13F | Bogart Wealth, LLC | 0 | -100.00 | 0 | |||||
| 2025-08-14 | 13F | Sunbelt Securities, Inc. | 18,645 | -4.62 | 863 | 10.37 | ||||
| 2025-08-06 | 13F | Commonwealth Equity Services, Llc | 2,892,574 | 8.65 | 140 | 31.13 | ||||
| 2025-08-14 | 13F | Mariner, LLC | 170,546 | 6.96 | 8,227 | 29.09 | ||||
| 2025-05-06 | 13F | Proficio Capital Partners LLC | 0 | -100.00 | 0 | |||||
| 2025-07-29 | 13F | Harbor Asset Planning, Inc. | 2,729 | 132 | ||||||
| 2025-07-31 | 13F | LJI Wealth Management, LLC | 9,596 | 0.00 | 463 | 20.63 | ||||
| 2025-08-06 | 13F | AE Wealth Management LLC | 16,455 | 1,027.05 | 794 | 1,267.24 | ||||
| 2025-08-14 | 13F | Investmark Advisory Group LLC | 4,717 | 228 | ||||||
| 2025-08-08 | 13F | Wealth Quarterback LLC | 58,202 | -17.48 | 2,808 | -0.39 | ||||
| 2025-08-13 | 13F | Holos Integrated Wealth LLC | 69,382 | 1.45 | 3,552 | 29.93 | ||||
| 2025-08-04 | 13F | Clear Investment Research, Llc | 22,284 | 2.34 | 1,075 | 23.45 | ||||
| 2025-04-10 | 13F | SMI Advisory Services, LLC | 0 | -100.00 | 0 | |||||
| 2025-08-13 | 13F | Fort Sheridan Advisors Llc | 7,160 | 11.35 | 345 | 34.24 | ||||
| 2025-08-15 | 13F | Kestra Advisory Services, LLC | 187,820 | 5.13 | 9,060 | 26.87 | ||||
| 2025-08-01 | 13F | Schmidt P J Investment Management Inc | 17,744 | 219.60 | 856 | 286.88 | ||||
| 2025-07-30 | 13F | BG Investment Services, Inc. | 151,318 | 9.56 | 7,354 | 33.59 | ||||
| 2025-07-11 | 13F | SILVER OAK SECURITIES, Inc | 5,114 | 2.55 | 247 | 23.62 | ||||
| 2025-08-06 | 13F | Atlantic Union Bankshares Corp | 68 | 3 | ||||||
| 2025-08-08 | 13F | POM Investment Strategies, LLC | 417 | 20 | ||||||
| 2025-08-14 | 13F | Goldman Sachs Group Inc | 14,465 | 698 | ||||||
| 2025-08-04 | 13F | Creative Financial Designs Inc /adv | 756 | 221.70 | 36 | 300.00 | ||||
| 2025-05-12 | 13F | Sandy Spring Bank | 68 | 3 | ||||||
| 2025-07-22 | 13F | Beacon Financial Advisory LLC | 11,300 | 545 | ||||||
| 2025-08-04 | 13F | Arkadios Wealth Advisors | 137,174 | 6,617 | ||||||
| 2025-08-05 | 13F | Dynasty Wealth Management, Llc | 5,507,411 | -17.55 | 265,678 | -0.49 | ||||
| 2025-07-14 | 13F | CRA Financial Services, LLC | 52,896 | 19.91 | 2,552 | 44.70 | ||||
| 2025-08-12 | 13F | Allen Capital Group, LLC | 26,321 | 180.37 | 1,270 | 238.40 | ||||
| 2025-07-15 | 13F | Bfsg, Llc | 127,860 | 3.40 | 6,168 | 24.79 | ||||
| 2025-07-28 | 13F | RFG Advisory, LLC | 239,964 | 11,576 | ||||||
| 2025-08-12 | 13F | Trexquant Investment LP | 6,418 | -14.46 | 310 | 3.34 | ||||
| 2025-07-10 | 13F | Sovran Advisors, LLC | 103,044 | 21.42 | 4,971 | 56.78 | ||||
| 2025-07-17 | 13F | Sound Income Strategies, LLC | 485 | 0.00 | 23 | 21.05 | ||||
| 2025-08-22 | NP | FTANX - Fidelity Asset Manager 30% This fund is a listed as child fund of Fmr Llc and if that institution has disclosed ownership in this security, then these positions will not be double counted when calculating total shares and total value | 576,122 | -1.35 | 27,792 | 19.06 | ||||
| 2025-07-18 | 13F | CHURCHILL MANAGEMENT Corp | 0 | -100.00 | 0 | |||||
| 2025-08-13 | 13F | Russell Investments Group, Ltd. | 105 | -93.48 | 5 | -92.19 | ||||
| 2025-07-23 | 13F | Sax Wealth Advisors, Llc | 106,797 | 28.25 | 5,152 | 54.78 | ||||
| 2025-07-15 | 13F | Wealth Effects Llc | 9,761 | -2.98 | 471 | 16.92 | ||||
| 2025-07-25 | 13F | Northwest Capital Management Inc | 1,068 | 52 | ||||||
| 2025-07-29 | 13F | Quotient Wealth Partners, LLC | 48,937 | 12.88 | 2,361 | 36.26 | ||||
| 2025-07-25 | 13F | LRI Investments, LLC | 200 | 0.00 | 10 | 28.57 | ||||
| 2025-08-14 | 13F | Royal Bank Of Canada | 2,110 | 0.33 | 102 | 21.43 | ||||
| 2025-08-22 | NP | Variable Insurance Products Fund V - FundsManager 40% Portfolio Service Class | 5,234 | 41.42 | 252 | 71.43 | ||||
| 2025-08-22 | NP | FASIX - Fidelity Asset Manager 20% This fund is a listed as child fund of Fmr Llc and if that institution has disclosed ownership in this security, then these positions will not be double counted when calculating total shares and total value | 1,163,045 | -3.87 | 56,105 | 16.03 | ||||
| 2025-08-22 | NP | Variable Insurance Products Fund V - Target Volatility Portfolio Service Class | 39,901 | -3.05 | 1,925 | 16.96 | ||||
| 2025-08-14 | 13F | Colony Group, LLC | 511,044 | -2.14 | 24,653 | 18.11 | ||||
| 2025-07-08 | 13F | Advance Capital Management, Inc. | 0 | -100.00 | 0 | -100.00 | ||||
| 2025-08-22 | NP | Variable Insurance Products Fund V - FundsManager 85% Portfolio Investor Class | 346,594 | 3.81 | 16,720 | 25.28 | ||||
| 2025-07-21 | 13F | Fairvoy Private Wealth, LLC | 30,347 | -9.44 | 1,464 | 9.26 | ||||
| 2025-08-07 | 13F | CENTRAL TRUST Co | 112,869 | -0.53 | 5,445 | 20.04 | ||||
| 2025-08-13 | 13F | Northern Trust Corp | 9,080 | 0.00 | 438 | 20.99 | ||||
| 2025-08-15 | 13F | Morgan Stanley | 947,790 | -15.37 | 45,721 | 2.14 | ||||
| 2025-08-11 | 13F | Principal Securities, Inc. | 23,181 | 405.25 | 1,118 | 427.36 | ||||
| 2025-07-16 | 13F | Castleview Partners, Llc | 8,961 | 432 | ||||||
| 2025-08-13 | 13F | Northwestern Mutual Wealth Management Co | 622,816 | 21.43 | 30,045 | 46.55 | ||||
| 2025-08-07 | 13F | Vise Technologies, Inc. | 0 | -100.00 | 0 | -100.00 |