Mga Batayang Estadistika
| Pemilik Institusional | 134 total, 131 long only, 0 short only, 3 long/short - change of 3.08% MRQ |
| Alokasi Portofolio Rata-rata | 0.1477 % - change of -2.79% MRQ |
| Saham Institusional (Jangka Panjang) | 37,666,287 (ex 13D/G) - change of 27.85MM shares 283.56% MRQ |
| Nilai Institusional (Jangka Panjang) | $ 186,071 USD ($1000) |
Kepemilikan Institusional dan Pemegang Saham
Fidus Investment Corporation (US:FDUS) memiliki 134 pemilik institusional dan pemegang saham yang telah mengajukan formulir 13D/G atau 13F kepada Komisi Bursa Efek (Securities Exchange Commission/SEC). Lembaga-lembaga ini memegang total 37,666,287 saham. Pemegang saham terbesar meliputi Kingstone Capital Partners Texas, LLC, Van Eck Associates Corp, Raymond James Financial Inc, BIZD - VanEck Vectors BDC Income ETF, Invesco Ltd., KBWD - Invesco KBW High Dividend Yield Financial ETF, Two Sigma Advisers, Lp, Cetera Investment Advisers, Envestnet Asset Management Inc, and Columbus Macro, LLC .
Struktur kepemilikan institusional Fidus Investment Corporation (NasdaqGS:FDUS) menunjukkan posisi terkini di perusahaan oleh institusi dan dana, serta perubahan terbaru dalam ukuran posisi. Pemegang saham utama dapat mencakup investor individu, reksa dana, dana lindung nilai, atau institusi. Jadwal 13D menunjukkan bahwa investor memegang (atau pernah memegang) lebih dari 5% saham perusahaan dan bermaksud (atau pernah bermaksud) untuk secara aktif mengejar perubahan strategi bisnis. Jadwal 13G menunjukkan investasi pasif lebih dari 5%.
The share price as of September 5, 2025 is 21.39 / share. Previously, on September 6, 2024, the share price was 19.99 / share. This represents an increase of 7.00% over that period.

Skor Sentimen Dana
Skor Sentimen Dana (sebelumnya dikenal sebagai Skor Akumulasi Kepemilikan) menemukan saham-saham yang paling banyak dibeli oleh dana. Ini adalah hasil dari model kuantitatif multi-faktor yang canggih yang mengidentifikasi perusahaan dengan tingkat akumulasi institusional tertinggi. Model penilaian menggunakan kombinasi dari total peningkatan pemilik yang diungkapkan, perubahan dalam alokasi portofolio pada pemilik tersebut, dan metrik lainnya. Angka berkisar dari 0 hingga 100, dengan angka yang lebih tinggi menunjukkan tingkat akumulasi yang lebih tinggi dibandingkan dengan perusahaan sejenisnya, dan 50 adalah rata-ratanya.
Frekuensi Pembaruan: Setiap Hari
Lihat Ownership Explorer, yang menyediakan daftar perusahaan dengan peringkat tertinggi.
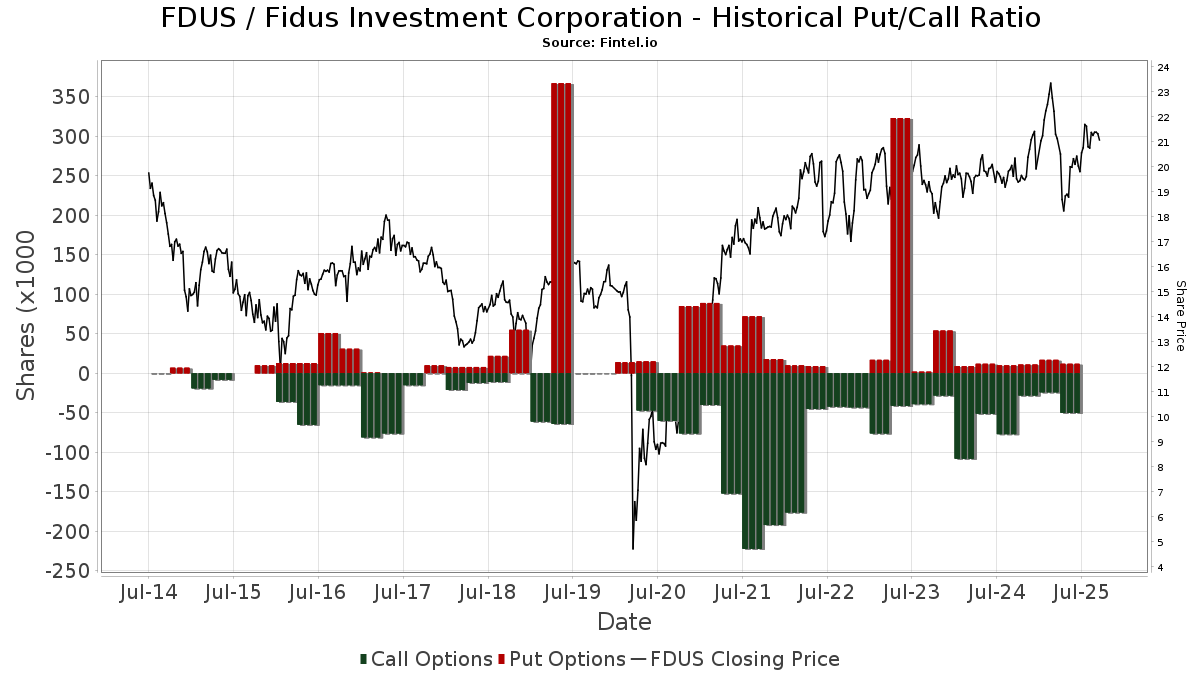
Rasio Put/Call Institusional
Selain melaporkan isu ekuitas dan utang standar, institusi dengan aset di bawah manajemen lebih dari 100 juta dolar AS juga harus mengungkapkan kepemilikan opsi put dan call mereka. Karena opsi put umumnya menunjukkan sentimen negatif, dan opsi call menunjukkan sentimen positif, kita dapat mengetahui sentimen institusional secara keseluruhan dengan memplot rasio put terhadap call. Grafik di sebelah kanan memplot rasio put/call historis untuk instrumen ini.
Menggunakan Rasio Put/Call sebagai indikator sentimen investor mengatasi salah satu kekurangan utama dari penggunaan total kepemilikan institusional, yaitu sejumlah besar aset yang dikelola diinvestasikan secara pasif untuk melacak indeks. Dana yang dikelola secara pasif biasanya tidak membeli opsi, sehingga indikator rasio put/call lebih akurat dalam melacak sentimen dana yang dikelola secara aktif.
Pengajuan 13F dan NPORT
Detail pada pengajuan 13F tersedia gratis. Detail pada pengajuan NP memerlukan keanggotaan premium. Baris berwarna hijau menunjukkan posisi baru. Baris berwarna merah menunjukkan posisi yang sudah ditutup. Klik tautan ini ikon untuk melihat riwayat transaksi selengkapnya.
Tingkatkan
untuk membuka data premium dan mengekspor ke Excel ![]() .
.
| Tanggal File | Sumber | Investor | Ketik | Presyo ng Avg (Silangan) |
Saham | Δ Saham (%) |
Dilaporkan Nilai ($1000) |
Nilai Δ (%) |
Alokasi Port (%) |
|
|---|---|---|---|---|---|---|---|---|---|---|
| 2025-08-06 | 13F | First Horizon Advisors, Inc. | 2,658 | 154.84 | 54 | 152.38 | ||||
| 2025-05-05 | 13F | IFP Advisors, Inc | 0 | -100.00 | 0 | |||||
| 2025-08-14 | 13F | Group One Trading, L.p. | Call | 1,800 | 36 | |||||
| 2025-08-01 | 13F | Envestnet Asset Management Inc | 359,415 | 10.84 | 7,260 | 9.80 | ||||
| 2025-08-13 | 13F | Plan Group Financial, LLC | 49,763 | 38.85 | 1,005 | 37.67 | ||||
| 2025-07-22 | 13F | DAVENPORT & Co LLC | 36,237 | 0.00 | 732 | -0.95 | ||||
| 2025-08-08 | 13F | Capital Investment Advisory Services, LLC | 84,524 | 13.97 | 1,707 | 12.90 | ||||
| 2025-07-10 | 13F | Atticus Wealth Management, Llc | 3,816 | 77 | ||||||
| 2025-08-14 | 13F | Group One Trading, L.p. | Put | 100 | 2 | |||||
| 2025-08-14 | 13F | Quarry LP | 2,366 | 71.45 | 48 | 67.86 | ||||
| 2025-08-04 | 13F | Muzinich & Co., Inc. | 190,228 | 106.50 | 3,843 | 104.58 | ||||
| 2025-07-31 | 13F | Caitong International Asset Management Co., Ltd | 4 | 100.00 | 0 | |||||
| 2025-08-11 | 13F | Hexagon Capital Partners LLC | 0 | -100.00 | 0 | |||||
| 2025-08-14 | 13F | GWM Advisors LLC | 91,113 | -10.24 | 1,840 | -11.07 | ||||
| 2025-08-07 | 13F | Campbell & CO Investment Adviser LLC | 23,049 | -34.36 | 466 | -35.06 | ||||
| 2025-07-28 | NP | KBWD - Invesco KBW High Dividend Yield Financial ETF This fund is a listed as child fund of Invesco Ltd. and if that institution has disclosed ownership in this security, then these positions will not be double counted when calculating total shares and total value | 430,044 | -21.66 | 8,812 | -31.08 | ||||
| 2025-08-14 | 13F | Verition Fund Management LLC | 14,100 | 285 | ||||||
| 2025-08-12 | 13F | Legal & General Group Plc | 228,512 | 0.94 | 4,616 | -0.02 | ||||
| 2025-07-21 | 13F | Ameritas Advisory Services, LLC | 200 | 4 | ||||||
| 2025-08-12 | 13F | Cornerstone Wealth Management, LLC | 27,173 | 7.80 | 549 | 6.82 | ||||
| 2025-08-13 | 13F | Level Four Advisory Services, Llc | 30,487 | -13.98 | 616 | -14.82 | ||||
| 2025-08-04 | 13F | MeadowBrook Investment Advisors LLC | 2,850 | 90.00 | 58 | 90.00 | ||||
| 2025-08-29 | NP | JAFEX - Total Stock Market Index Trust NAV | 641 | 19.37 | 13 | 9.09 | ||||
| 2025-05-14 | 13F | Virtus ETF Advisers LLC | 0 | -100.00 | 0 | |||||
| 2025-07-10 | 13F | Capital Advisory Group Advisory Services, LLC | 77,618 | 1.98 | 1,568 | 1.03 | ||||
| 2025-08-08 | 13F | Hartland & Co., LLC | 20,661 | 0.44 | 417 | -0.48 | ||||
| 2025-05-16 | 13F | McIlrath & Eck, LLC | 0 | -100.00 | 0 | |||||
| 2025-07-18 | 13F | Truist Financial Corp | 45,703 | -2.67 | 909 | -5.12 | ||||
| 2025-07-29 | 13F | TrueMark Investments, LLC | 0 | -100.00 | 0 | |||||
| 2025-08-11 | 13F | Brown Brothers Harriman & Co | 5,337 | 0.00 | 108 | -0.93 | ||||
| 2025-07-17 | 13F | Janney Montgomery Scott LLC | 10,463 | 0.00 | 0 | |||||
| 2025-08-14 | 13F | Stifel Financial Corp | 13,995 | -21.95 | 283 | -22.74 | ||||
| 2025-08-13 | 13F | Virtus Investment Advisers, Inc. | 41,255 | -2.66 | 833 | -3.59 | ||||
| 2025-08-14 | 13F | Quantinno Capital Management LP | 27,165 | 549 | ||||||
| 2025-08-14 | 13F | Bnp Paribas Arbitrage, Sa | 38 | 1 | ||||||
| 2025-06-18 | NP | Putnam ETF Trust - Putnam BDC ETF - | 166,576 | 17.21 | 3,148 | -2.02 | ||||
| 2025-05-02 | 13F | Hager Investment Management Services, Llc | 0 | -100.00 | 0 | |||||
| 2025-07-23 | 13F | Morey & Quinn Wealth Partners, LLC | 14,778 | 0.00 | 299 | -1.00 | ||||
| 2025-08-14 | 13F | Smartleaf Asset Management LLC | 7 | 0.00 | 0 | |||||
| 2025-07-23 | 13F | 1 North Wealth Services Llc | 600 | 0.00 | 12 | 0.00 | ||||
| 2025-08-13 | 13F | Advisory Research Inc | 10,574 | 6.14 | 214 | 4.93 | ||||
| 2025-08-14 | 13F | Summit Trail Advisors, Llc | 22,502 | 455 | ||||||
| 2025-08-14 | 13F | Mercer Global Advisors Inc /adv | 29,783 | 602 | ||||||
| 2025-07-07 | 13F | Enterprise Bank & Trust Co | 55,912 | 0.00 | 1,129 | -0.96 | ||||
| 2025-07-24 | 13F | Capital Advisors, Ltd. LLC | 2,250 | 0.00 | 0 | |||||
| 2025-08-01 | 13F | Y-Intercept (Hong Kong) Ltd | 62,361 | 472.96 | 1,260 | 469.68 | ||||
| 2025-07-08 | 13F | Davis Investment Partners, LLC | 77,104 | -5.57 | 1,570 | 5.73 | ||||
| 2025-07-16 | 13F | Eagle Global Advisors Llc | 22,325 | 56.01 | 451 | 54.64 | ||||
| 2025-05-30 | NP | ERNZ - TrueShares Active Yield ETF | 11,462 | -85.27 | 234 | -85.75 | ||||
| 2025-08-05 | 13F | Palogic Value Management, L.P. | 69,101 | 2.65 | 1,396 | 1.68 | ||||
| 2025-08-13 | 13F | Mackenzie Financial Corp | 0 | -100.00 | 0 | |||||
| 2025-08-11 | 13F | Private Advisor Group, LLC | 14,734 | 29.12 | 298 | 28.02 | ||||
| 2025-08-21 | NP | BIZD - VanEck Vectors BDC Income ETF | 793,209 | 6.18 | 16,023 | 5.19 | ||||
| 2025-08-01 | 13F | Koss-Olinger Consulting, LLC | 16,153 | 326 | ||||||
| 2025-05-14 | 13F | Credit Agricole S A | 47,649 | 0.00 | 972 | -3.00 | ||||
| 2025-07-16 | 13F | ORG Partners LLC | 1,416 | 0.00 | 29 | -3.45 | ||||
| 2025-08-25 | 13F/A | Promus Capital, LLC | 2,023 | 0.00 | 41 | -2.44 | ||||
| 2025-07-31 | 13F | MQS Management LLC | 36,583 | -20.28 | 739 | -21.07 | ||||
| 2025-07-11 | 13F | Farther Finance Advisors, LLC | 7,346 | -2.92 | 148 | -5.13 | ||||
| 2025-08-12 | 13F | Jpmorgan Chase & Co | 4,398 | -66.67 | 89 | -67.29 | ||||
| 2025-08-08 | 13F | Pnc Financial Services Group, Inc. | 750 | 0.00 | 15 | 0.00 | ||||
| 2025-08-13 | 13F | Natixis | 26,751 | 0.00 | 539 | -1.47 | ||||
| 2025-07-24 | 13F | Blair William & Co/il | 0 | -100.00 | 0 | |||||
| 2025-05-05 | 13F | Transce3nd, LLC | 0 | -100.00 | 0 | |||||
| 2025-07-11 | 13F | Kingstone Capital Partners Texas, LLC | 27,409,759 | 549 | ||||||
| 2025-07-31 | 13F | Oak Harbor Wealth Partners, Llc | 17,981 | 0.00 | 363 | -0.82 | ||||
| 2025-07-25 | 13F | Atria Wealth Solutions, Inc. | 10,089 | 204 | ||||||
| 2025-06-27 | NP | LBO - WHITEWOLF Publicly Listed Private Equity ETF | 676 | 14.19 | 13 | -7.69 | ||||
| 2025-08-12 | 13F | Steward Partners Investment Advisory, Llc | 25,284 | 7.89 | 511 | 6.92 | ||||
| 2025-08-13 | 13F | Quantbot Technologies LP | 9,047 | -7.65 | 183 | -8.54 | ||||
| 2025-08-14 | 13F | Bank Of America Corp /de/ | 17,673 | -2.65 | 357 | -3.78 | ||||
| 2025-07-31 | 13F | Sumitomo Mitsui Trust Holdings, Inc. | 152,463 | 68.49 | 3,080 | 66.88 | ||||
| 2025-08-14 | 13F | Royal Bank Of Canada | 12,088 | 5.72 | 244 | 4.72 | ||||
| 2025-08-07 | 13F | Hennion & Walsh Asset Management, Inc. | 44,016 | 0.05 | 889 | -0.89 | ||||
| 2025-08-12 | 13F | BlackRock, Inc. | 193,153 | 30.75 | 3,902 | 29.52 | ||||
| 2025-08-13 | 13F | Millstone Evans Group, LLC | 3,686 | 0.00 | 74 | -1.33 | ||||
| 2025-08-14 | 13F | Jane Street Group, Llc | 0 | -100.00 | 0 | |||||
| 2025-08-15 | 13F | Morgan Stanley | 267,445 | -12.38 | 5,402 | -13.19 | ||||
| 2025-08-15 | 13F | Great West Life Assurance Co /can/ | 33,094 | 4.65 | 1 | |||||
| 2025-08-18 | 13F | N.E.W. Advisory Services LLC | 62 | 0.00 | 1 | 0.00 | ||||
| 2025-08-14 | 13F | Millennium Management Llc | 0 | -100.00 | 0 | |||||
| 2025-08-06 | 13F | Prospera Financial Services Inc | 20,171 | 0.02 | 407 | -0.97 | ||||
| 2025-08-13 | 13F | Beacon Pointe Advisors, LLC | 22,628 | 457 | ||||||
| 2025-08-18 | 13F | Geneos Wealth Management Inc. | 51 | 0.00 | 1 | 0.00 | ||||
| 2025-08-14 | 13F | Van Eck Associates Corp | 846,994 | 10.94 | 17 | 13.33 | ||||
| 2025-07-14 | 13F | Golden State Equity Partners | 15,740 | 318 | ||||||
| 2025-07-10 | 13F | Wealth Enhancement Advisory Services, Llc | 20,462 | 13.39 | 425 | 15.80 | ||||
| 2025-08-13 | 13F | Baird Financial Group, Inc. | 313,002 | 10.57 | 6,323 | 9.53 | ||||
| 2025-08-08 | 13F | Cetera Investment Advisers | 370,335 | 10.38 | 7,481 | 9.36 | ||||
| 2025-07-14 | 13F | AdvisorNet Financial, Inc | 1,728 | 137.36 | 35 | 142.86 | ||||
| 2025-08-12 | 13F | Virtu Financial LLC | 0 | -100.00 | 0 | |||||
| 2025-08-08 | 13F | Accredited Investors Inc. | 20,000 | 404 | ||||||
| 2025-08-14 | 13F | Wells Fargo & Company/mn | 23,887 | -14.58 | 483 | -15.44 | ||||
| 2025-07-31 | 13F | Optimum Investment Advisors | 20,393 | 9.32 | 412 | 8.16 | ||||
| 2025-07-31 | 13F | Cambridge Investment Research Advisors, Inc. | 26,905 | 10.85 | 1 | |||||
| 2025-08-08 | 13F | Cedar Wealth Management, LLC | 992 | 0.00 | 20 | 0.00 | ||||
| 2025-08-05 | 13F | GPS Wealth Strategies Group, LLC | 2,739 | -36.96 | 55 | -37.50 | ||||
| 2025-06-25 | NP | VPC - Virtus Private Credit Strategy ETF | 38,715 | -12.90 | 732 | -27.19 | ||||
| 2025-05-14 | 13F | Comerica Bank | 0 | -100.00 | 0 | |||||
| 2025-07-31 | 13F | Peterson Wealth Services | 122 | 0.83 | 2 | 0.00 | ||||
| 2025-05-13 | 13F | Neuberger Berman Group LLC | 0 | -100.00 | 0 | |||||
| 2025-07-29 | 13F | Stratos Wealth Partners, LTD. | 26,200 | 61.73 | 529 | 60.30 | ||||
| 2025-08-04 | 13F | Spire Wealth Management | 0 | -100.00 | 0 | |||||
| 2025-08-14 | 13F | Bragg Financial Advisors, Inc | 13,011 | 0.00 | 263 | -1.13 | ||||
| 2025-08-14 | 13F | Aquatic Capital Management LLC | 0 | -100.00 | 0 | |||||
| 2025-08-14 | 13F | Raymond James Financial Inc | 813,702 | -13.26 | 16,437 | -14.07 | ||||
| 2025-07-09 | 13F | Fiduciary Alliance LLC | 13,025 | 0.00 | 263 | -0.75 | ||||
| 2025-07-17 | 13F | GraniteShares Advisors LLC | 132,532 | 6.67 | 2,677 | 5.68 | ||||
| 2025-08-14 | 13F | Citadel Advisors Llc | Call | 24,800 | 10.22 | 501 | 9.17 | |||
| 2025-08-13 | 13F | Northwestern Mutual Wealth Management Co | 150 | 3 | ||||||
| 2025-08-25 | NP | TMVAX - RBC Microcap Value Fund A Shares | 4,400 | 0.00 | 89 | -1.12 | ||||
| 2025-04-21 | 13F | Nelson, Van Denburg & Campbell Wealth Management Group, LLC | 0 | -100.00 | 0 | |||||
| 2025-08-12 | 13F | Advisors Asset Management, Inc. | 154,610 | -27.54 | 3,123 | -28.21 | ||||
| 2025-07-23 | 13F | Columbus Macro, LLC | 322,543 | 12.14 | 6,515 | 11.10 | ||||
| 2025-07-31 | 13F | Oppenheimer & Co Inc | 20,323 | 6.82 | 411 | 5.94 | ||||
| 2025-08-06 | 13F | Ethos Financial Group, LLC | 137,365 | 2.22 | 2,775 | 1.24 | ||||
| 2025-08-12 | 13F | Dynamic Technology Lab Private Ltd | 0 | -100.00 | 0 | |||||
| 2025-08-12 | 13F | MAI Capital Management | 3,132 | 0.00 | 63 | 0.00 | ||||
| 2025-08-15 | 13F | Tower Research Capital LLC (TRC) | 699 | 2,812.50 | 14 | |||||
| 2025-08-12 | 13F | Franklin Resources Inc | 167,016 | -0.42 | 3,374 | -1.35 | ||||
| 2025-07-25 | 13F | Cwm, Llc | 749 | 1,602.27 | 0 | |||||
| 2025-08-14 | 13F | Mariner, LLC | 11,515 | 13.68 | 233 | 12.62 | ||||
| 2025-08-11 | 13F | HighTower Advisors, LLC | 90,865 | 0.22 | 1,835 | -0.70 | ||||
| 2025-08-12 | 13F | Laurel Wealth Advisors LLC | 31,755 | 7,588.86 | 2 | -87.50 | ||||
| 2025-07-17 | 13F | HB Wealth Management, LLC | 13,599 | 0.00 | 275 | -1.08 | ||||
| 2025-08-11 | 13F | Citigroup Inc | 0 | -100.00 | 0 | |||||
| 2025-08-12 | 13F | Trexquant Investment LP | 76,533 | 56.54 | 1,546 | 55.12 | ||||
| 2025-08-13 | 13F | Legacy Capital Wealth Partners, LLC | 66,037 | -2.68 | 1,334 | -3.62 | ||||
| 2025-08-12 | 13F | Global Retirement Partners, LLC | 788 | 16 | ||||||
| 2025-08-14 | 13F | Two Sigma Investments, Lp | 287,879 | -27.85 | 5,815 | -28.52 | ||||
| 2025-07-29 | 13F | Novare Capital Management Llc | 190,275 | 0.60 | 3,844 | -0.34 | ||||
| 2025-08-14 | 13F | Qube Research & Technologies Ltd | 64,929 | 39.81 | 1,312 | 38.58 | ||||
| 2025-09-04 | 13F/A | Advisor Group Holdings, Inc. | 13,092 | 7.56 | 264 | 6.45 | ||||
| 2025-08-29 | NP | GraniteShares ETF Trust - GraniteShares HIPS US High Income ETF | 132,532 | 6.67 | 2,677 | 5.68 | ||||
| 2025-08-06 | 13F | Commonwealth Equity Services, Llc | 35,124 | 20.65 | 1 | |||||
| 2025-07-08 | 13F | Nbc Securities, Inc. | 0 | -100.00 | 0 | |||||
| 2025-08-12 | 13F | LPL Financial LLC | 82,993 | -3.48 | 1,676 | -4.39 | ||||
| 2025-07-22 | 13F | Sage Investment Counsel LLC | 12,070 | 0.00 | 244 | -1.22 | ||||
| 2025-07-15 | 13F | Riverbridge Partners Llc | 38,975 | 3.92 | 787 | 3.01 | ||||
| 2025-08-07 | 13F | PFG Advisors | 188,495 | 3.76 | 3,808 | 2.81 | ||||
| 2025-08-12 | 13F | Proequities, Inc. | Put | 0 | 0 | |||||
| 2025-08-12 | 13F | Proequities, Inc. | Call | 0 | 0 | |||||
| 2025-08-12 | 13F | Proequities, Inc. | 0 | 0 | ||||||
| 2025-08-14 | 13F | Citadel Advisors Llc | Put | 0 | -100.00 | 0 | ||||
| 2025-08-13 | 13F | Russell Investments Group, Ltd. | 72 | 0.00 | 1 | 0.00 | ||||
| 2025-08-14 | 13F | UBS Group AG | 298,390 | 50.83 | 6,027 | 49.44 | ||||
| 2025-08-14 | 13F | Susquehanna International Group, Llp | 0 | -100.00 | 0 | |||||
| 2025-08-14 | 13F | Hrt Financial Lp | 54,066 | 26.75 | 1 | |||||
| 2025-08-14 | 13F | Susquehanna International Group, Llp | Call | 24,000 | 485 | |||||
| 2025-08-14 | 13F | IHT Wealth Management, LLC | 69,581 | 10.12 | 1,406 | 9.08 | ||||
| 2025-08-14 | 13F | Susquehanna International Group, Llp | Put | 12,000 | -7.69 | 242 | -8.68 | |||
| 2025-08-13 | 13F | Invesco Ltd. | 446,703 | 2.20 | 9,023 | 1.26 | ||||
| 2025-05-13 | 13F | EverSource Wealth Advisors, LLC | 0 | -100.00 | 0 | |||||
| 2025-08-14 | 13F | Ameriprise Financial Inc | 92,080 | -13.40 | 1,858 | -13.14 | ||||
| 2025-08-14 | 13F | MGB Wealth Management, LLC | 89,775 | 2.07 | 1,807 | 0.61 | ||||
| 2025-08-11 | 13F | Greenland Capital Management LP | 53,190 | -9.39 | 1,074 | -10.20 | ||||
| 2025-07-17 | 13F | Sound Income Strategies, LLC | 1,898 | -63.27 | 38 | -63.81 | ||||
| 2025-07-30 | 13F | D.a. Davidson & Co. | 115,872 | 159.06 | 2,341 | 156.86 | ||||
| 2025-08-05 | 13F | Simplex Trading, Llc | Put | 200 | 100.00 | 0 | ||||
| 2025-08-05 | 13F | Simplex Trading, Llc | 16,458 | 0 | ||||||
| 2025-08-05 | 13F | Simplex Trading, Llc | Call | 100 | -95.65 | 0 | ||||
| 2025-08-14 | 13F | Two Sigma Advisers, Lp | 380,613 | -8.49 | 7,688 | -9.34 | ||||
| 2025-08-13 | 13F | Northern Trust Corp | 20,202 | 408 | ||||||
| 2025-08-14 | 13F | Citadel Advisors Llc | 0 | -100.00 | 0 | |||||
| 2025-05-06 | 13F | WT Wealth Management | 53,376 | -3.72 | 1,088 | -6.61 |