Mga Batayang Estadistika
| Pemilik Institusional | 172 total, 172 long only, 0 short only, 0 long/short - change of 16.11% MRQ |
| Alokasi Portofolio Rata-rata | 0.3793 % - change of 26.85% MRQ |
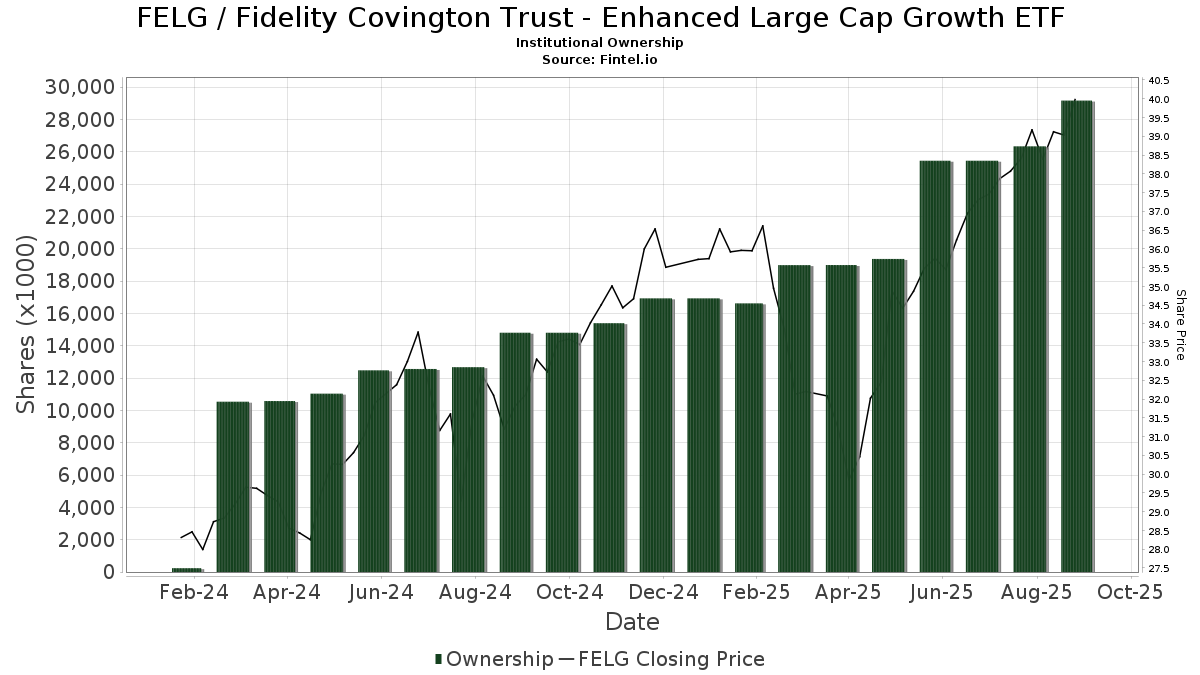
| Saham Institusional (Jangka Panjang) | 29,171,785 (ex 13D/G) - change of 3.72MM shares 14.63% MRQ |
| Nilai Institusional (Jangka Panjang) | $ 703,097 USD ($1000) |
Kepemilikan Institusional dan Pemegang Saham
Fidelity Covington Trust - Enhanced Large Cap Growth ETF (US:FELG) memiliki 172 pemilik institusional dan pemegang saham yang telah mengajukan formulir 13D/G atau 13F kepada Komisi Bursa Efek (Securities Exchange Commission/SEC). Lembaga-lembaga ini memegang total 29,171,785 saham. Pemegang saham terbesar meliputi Mml Investors Services, Llc, Envestnet Asset Management Inc, Commonwealth Equity Services, Llc, LPL Financial LLC, Equitable Holdings, Inc., Independence Financial Advisors, LLC, Raymond James Financial Inc, Advisor Group Holdings, Inc., Spectrum Investment Advisors, Inc., and Cambridge Investment Research Advisors, Inc. .
Struktur kepemilikan institusional Fidelity Covington Trust - Enhanced Large Cap Growth ETF (ARCA:FELG) menunjukkan posisi terkini di perusahaan oleh institusi dan dana, serta perubahan terbaru dalam ukuran posisi. Pemegang saham utama dapat mencakup investor individu, reksa dana, dana lindung nilai, atau institusi. Jadwal 13D menunjukkan bahwa investor memegang (atau pernah memegang) lebih dari 5% saham perusahaan dan bermaksud (atau pernah bermaksud) untuk secara aktif mengejar perubahan strategi bisnis. Jadwal 13G menunjukkan investasi pasif lebih dari 5%.
The share price as of September 5, 2025 is 39.28 / share. Previously, on September 9, 2024, the share price was 30.84 / share. This represents an increase of 27.37% over that period.
Skor Sentimen Dana
Skor Sentimen Dana (sebelumnya dikenal sebagai Skor Akumulasi Kepemilikan) menemukan saham-saham yang paling banyak dibeli oleh dana. Ini adalah hasil dari model kuantitatif multi-faktor yang canggih yang mengidentifikasi perusahaan dengan tingkat akumulasi institusional tertinggi. Model penilaian menggunakan kombinasi dari total peningkatan pemilik yang diungkapkan, perubahan dalam alokasi portofolio pada pemilik tersebut, dan metrik lainnya. Angka berkisar dari 0 hingga 100, dengan angka yang lebih tinggi menunjukkan tingkat akumulasi yang lebih tinggi dibandingkan dengan perusahaan sejenisnya, dan 50 adalah rata-ratanya.
Frekuensi Pembaruan: Setiap Hari
Lihat Ownership Explorer, yang menyediakan daftar perusahaan dengan peringkat tertinggi.
Rasio Put/Call Institusional
Selain melaporkan isu ekuitas dan utang standar, institusi dengan aset di bawah manajemen lebih dari 100 juta dolar AS juga harus mengungkapkan kepemilikan opsi put dan call mereka. Karena opsi put umumnya menunjukkan sentimen negatif, dan opsi call menunjukkan sentimen positif, kita dapat mengetahui sentimen institusional secara keseluruhan dengan memplot rasio put terhadap call. Grafik di sebelah kanan memplot rasio put/call historis untuk instrumen ini.
Menggunakan Rasio Put/Call sebagai indikator sentimen investor mengatasi salah satu kekurangan utama dari penggunaan total kepemilikan institusional, yaitu sejumlah besar aset yang dikelola diinvestasikan secara pasif untuk melacak indeks. Dana yang dikelola secara pasif biasanya tidak membeli opsi, sehingga indikator rasio put/call lebih akurat dalam melacak sentimen dana yang dikelola secara aktif.
Pengajuan 13F dan NPORT
Detail pada pengajuan 13F tersedia gratis. Detail pada pengajuan NP memerlukan keanggotaan premium. Baris berwarna hijau menunjukkan posisi baru. Baris berwarna merah menunjukkan posisi yang sudah ditutup. Klik tautan ini ikon untuk melihat riwayat transaksi selengkapnya.
Tingkatkan
untuk membuka data premium dan mengekspor ke Excel ![]() .
.
| Tanggal File | Sumber | Investor | Ketik | Presyo ng Avg (Silangan) |
Saham | Δ Saham (%) |
Dilaporkan Nilai ($1000) |
Nilai Δ (%) |
Alokasi Port (%) |
|
|---|---|---|---|---|---|---|---|---|---|---|
| 2025-08-11 | 13F | Cornerstone Planning Group LLC | 1,082 | 0.00 | 41 | 28.13 | ||||
| 2025-08-14 | 13F | GWM Advisors LLC | 22,225 | 31.19 | 823 | 54.41 | ||||
| 2025-08-14 | 13F | Geneva Partners, LLC | 19,154 | -43.18 | 709 | -32.86 | ||||
| 2025-07-17 | 13F | Janney Montgomery Scott LLC | 14,666 | -1.60 | 1 | |||||
| 2025-08-06 | 13F | Wedbush Securities Inc | 13,099 | 4.93 | 0 | |||||
| 2025-04-28 | 13F | CarsonAllaria Wealth Management, Ltd. | 0 | -100.00 | 0 | |||||
| 2025-08-07 | 13F | Kestra Private Wealth Services, Llc | 22,006 | 37.93 | 815 | 62.15 | ||||
| 2025-07-21 | 13F | Ameritas Advisory Services, LLC | 2,801 | 104 | ||||||
| 2025-05-14 | 13F | PKS Advisory Services, LLC | 0 | -100.00 | 0 | |||||
| 2025-08-18 | 13F/A | Kestra Investment Management, LLC | 462,790 | -41.23 | 17,137 | -30.91 | ||||
| 2025-07-15 | 13F | Fifth Third Bancorp | 231 | 0.00 | 9 | 14.29 | ||||
| 2025-08-07 | 13F | Proficio Capital Partners LLC | 0 | -100.00 | 0 | |||||
| 2025-07-14 | 13F | Sowell Financial Services LLC | 26,372 | 977 | ||||||
| 2025-08-04 | 13F | Integrity Alliance, Llc. | 0 | -100.00 | 0 | |||||
| 2025-05-06 | 13F | Assetmark, Inc | 0 | -100.00 | 0 | |||||
| 2025-08-14 | 13F | Stifel Financial Corp | 24,697 | 90.75 | 915 | 124.57 | ||||
| 2025-08-08 | 13F | Advisors Capital Management, LLC | 190,632 | 89.46 | 7,059 | 122.75 | ||||
| 2025-08-14 | 13F | Menora Mivtachim Holdings Ltd. | 211,326 | 55.32 | 7,825 | 82.61 | ||||
| 2025-08-11 | 13F | Nations Financial Group Inc, /ia/ /adv | 7,647 | 283 | ||||||
| 2025-08-15 | 13F | Captrust Financial Advisors | 10,634 | 11.58 | 394 | 31.00 | ||||
| 2025-08-14 | 13F | Quantinno Capital Management LP | 10,979 | 407 | ||||||
| 2025-07-09 | 13F | Baron Wealth Management LLC | 11,426 | 423 | ||||||
| 2025-08-14 | 13F | UBS Group AG | 1,651 | 0.00 | 61 | 17.31 | ||||
| 2025-08-01 | 13F | Envestnet Asset Management Inc | 5,941,796 | 7.70 | 220,025 | 26.60 | ||||
| 2025-07-21 | 13F | Pacific Financial Group Inc | 6,044 | 224 | ||||||
| 2025-07-18 | 13F | Rogco, Lp | 1,521 | 56 | ||||||
| 2025-08-15 | 13F | Kestra Advisory Services, LLC | 550,317 | 15.08 | 20,378 | 35.29 | ||||
| 2025-08-07 | 13F | Allworth Financial LP | 3,462 | 0.03 | 128 | 18.52 | ||||
| 2025-08-11 | 13F | Regal Investment Advisors LLC | 11,193 | 2.87 | 414 | 21.05 | ||||
| 2025-07-18 | 13F | Madrona Financial Services, LLC | 11,706 | 46.03 | 433 | 71.83 | ||||
| 2025-07-29 | 13F | Fundamentun, Llc | 7,857 | 291 | ||||||
| 2025-08-08 | 13F | Creative Planning | 42,648 | 0.96 | 1,579 | 18.72 | ||||
| 2025-07-15 | 13F | Charter Capital Management, LLC\DE | 8,938 | 331 | ||||||
| 2025-07-09 | 13F | Act Wealth Management, Llc | 10,667 | 0.12 | 395 | 17.61 | ||||
| 2025-08-08 | 13F | Thoroughbred Financial Services, Llc | 6,289 | -38.63 | 0 | |||||
| 2025-08-14 | 13F | EP Wealth Advisors, Inc. | 6,086 | 69.01 | 225 | 99.12 | ||||
| 2025-08-27 | NP | ACGRX - Advisors Capital Growth Fund | 153,700 | 128.38 | 5,692 | 168.57 | ||||
| 2025-07-15 | 13F | Bay Capital Advisors, LLC | 19,219 | 13.23 | 712 | 33.15 | ||||
| 2025-07-25 | 13F | Ball & Co Wealth Management Inc. | 20,497 | -45.42 | 1 | -100.00 | ||||
| 2025-07-15 | 13F | Beacon Investment Advisory Services, Inc. | 10,021 | 0.00 | 371 | 17.78 | ||||
| 2025-07-18 | 13F | Rolek Wealth Management LLC | 31,558 | -20.72 | 1,169 | -4.50 | ||||
| 2025-07-25 | 13F | Verdence Capital Advisors LLC | 11,182 | 0.13 | 414 | 17.95 | ||||
| 2025-08-14 | 13F | Citadel Advisors Llc | 0 | -100.00 | 0 | |||||
| 2025-08-12 | 13F | Steward Partners Investment Advisory, Llc | 1,687 | 313.48 | 62 | 416.67 | ||||
| 2025-08-12 | 13F | Jpmorgan Chase & Co | 499,432 | 0.87 | 18,494 | 18.58 | ||||
| 2025-07-10 | 13F | Oliver Lagore Vanvalin Investment Group | 1 | 0.00 | 0 | |||||
| 2025-08-12 | 13F | SRS Capital Advisors, Inc. | 3,343 | 124 | ||||||
| 2025-07-17 | 13F | Halbert Hargrove Global Advisors, Llc | 253 | 0.00 | 9 | 28.57 | ||||
| 2025-05-28 | 13F | Intrua Financial, LLC | 0 | -100.00 | 0 | -100.00 | ||||
| 2025-07-29 | 13F | Spectrum Investment Advisors, Inc. | 690,417 | 4.06 | 25,566 | 22.34 | ||||
| 2025-08-13 | 13F | Fisher Asset Management, LLC | 6,336 | 235 | ||||||
| 2025-08-12 | 13F | Proequities, Inc. | 0 | 0 | ||||||
| 2025-08-13 | 13F | Colonial Trust Advisors | 1,121 | 42 | ||||||
| 2025-05-01 | 13F | Iron Horse Wealth Management, LLC | 0 | -100.00 | 0 | |||||
| 2025-08-15 | 13F | Tower Research Capital LLC (TRC) | 11,458 | 424 | ||||||
| 2025-07-25 | 13F | Hazlett, Burt & Watson, Inc. | 593 | 0.17 | 0 | |||||
| 2025-08-07 | 13F | Cahill Financial Advisors Inc | 5,887 | 218 | ||||||
| 2025-08-13 | 13F | IAG Wealth Partners, LLC | 28 | 1 | ||||||
| 2025-07-31 | 13F | Cambridge Investment Research Advisors, Inc. | 550,661 | 45.33 | 20 | 81.82 | ||||
| 2025-08-06 | 13F | AE Wealth Management LLC | 3,678 | -8.12 | 136 | 7.94 | ||||
| 2025-08-01 | 13F | Transcend Wealth Collective, Llc | 7,644 | 283 | ||||||
| 2025-08-14 | 13F | Foronjy Financial Llc | 7,758 | 287 | ||||||
| 2025-08-11 | 13F | Heritage Wealth Advisors | 552 | 0.00 | 20 | 17.65 | ||||
| 2025-07-23 | 13F | Element Wealth, LLC | 8,993 | 333 | ||||||
| 2025-07-14 | 13F | Sentinel Pension Advisors Inc | 381,516 | 40.05 | 14,128 | 64.63 | ||||
| 2025-08-08 | 13F | Cetera Investment Advisers | 196,778 | 24.39 | 7,287 | 46.22 | ||||
| 2025-08-05 | 13F | Sigma Planning Corp | 11,822 | -1.34 | 438 | 15.92 | ||||
| 2025-08-13 | 13F | Summit Wealth Group Llc / Co | 31,127 | 1,153 | ||||||
| 2025-08-12 | 13F | O'shaughnessy Asset Management, Llc | 0 | -100.00 | 0 | |||||
| 2025-07-23 | 13F | Clear Creek Financial Management, LLC | 24,841 | -29.85 | 920 | -17.58 | ||||
| 2025-08-14 | 13F | CoreCap Advisors, LLC | 1,671 | 97.99 | 62 | 134.62 | ||||
| 2025-08-06 | 13F | Golden State Wealth Management, LLC | 4,479 | 52.92 | 166 | 79.35 | ||||
| 2025-08-12 | 13F | Wood Tarver Financial Group, LLC | 5,707 | 0.00 | 0 | -100.00 | ||||
| 2025-07-22 | 13F | Wealthcare Advisory Partners LLC | 7,497 | -2.20 | 278 | 14.94 | ||||
| 2025-07-28 | 13F | Duncker Streett & Co Inc | 0 | -100.00 | 0 | |||||
| 2025-08-14 | 13F | Susquehanna International Group, Llp | 34,945 | -13.34 | 1,294 | 1.89 | ||||
| 2025-08-14 | 13F | Hilltop Holdings Inc. | 40,943 | -1.77 | 1,516 | 15.55 | ||||
| 2025-08-14 | 13F | Fmr Llc | 441,654 | 14.85 | 16,354 | 35.01 | ||||
| 2025-07-07 | 13F | Investors Research Corp | 1,208 | -19.89 | 45 | -6.38 | ||||
| 2025-07-23 | 13F | Richardson Capital Management LLC | 5,777 | 0.00 | 214 | 17.68 | ||||
| 2025-08-14 | 13F | Hrt Financial Lp | 8,843 | 0 | ||||||
| 2025-07-23 | 13F | Elm3 Financial Group, LLC | 11,548 | 65.23 | 428 | 94.09 | ||||
| 2025-08-07 | 13F | Flagship Wealth Advisors, Llc | 133,223 | 15.49 | 4,933 | 35.78 | ||||
| 2025-08-05 | 13F | Sage Capital Management, LLC | 12,344 | 0.10 | 457 | 17.78 | ||||
| 2025-05-14 | 13F | Jane Street Group, Llc | 0 | -100.00 | 0 | |||||
| 2025-07-29 | 13F | BKD Wealth Advisors, LLC | 0 | -100.00 | 0 | |||||
| 2025-08-14 | 13F | Great Valley Advisor Group, Inc. | 14,217 | 2.05 | 527 | 20.09 | ||||
| 2025-07-25 | 13F | Cwm, Llc | 2,325 | 0 | ||||||
| 2025-08-19 | 13F | Advisory Services Network, LLC | 9,533 | -10.14 | 364 | 8.98 | ||||
| 2025-08-14 | 13F | Raymond James Financial Inc | 824,707 | -0.30 | 30,539 | 17.20 | ||||
| 2025-07-10 | 13F | Family Legacy Financial Solutions, LLC | 17 | 1 | ||||||
| 2025-08-14 | 13F | Wells Fargo & Company/mn | 148,583 | 3,074.17 | 5,502 | 3,642.86 | ||||
| 2025-07-30 | 13F | Drive Wealth Management, Llc | 6,620 | 0.65 | 245 | 18.36 | ||||
| 2025-07-24 | 13F | IFP Advisors, Inc | 3,720 | 0.11 | 138 | 17.09 | ||||
| 2025-05-09 | 13F | Keeler THomas Management LLC | 0 | -100.00 | 0 | -100.00 | ||||
| 2025-08-06 | 13F | Bensler, LLC | 11,185 | -5.03 | 414 | 11.59 | ||||
| 2025-07-07 | 13F | Nova Wealth Management, Inc. | 59,048 | 3.05 | 2,187 | 21.11 | ||||
| 2025-07-22 | 13F | Valeo Financial Advisors, LLC | 17,504 | -5.24 | 648 | 11.53 | ||||
| 2025-07-08 | 13F | Lowe Wealth Advisors, LLC | 101 | 0.00 | 4 | 0.00 | ||||
| 2025-08-05 | 13F | Carolinas Wealth Consulting Llc | 0 | -100.00 | 0 | -100.00 | ||||
| 2025-08-05 | 13F | Key FInancial Inc | 26,144 | 0.00 | 968 | 17.62 | ||||
| 2025-08-04 | 13F | IFG Advisory, LLC | 21,618 | 9.26 | 801 | 28.41 | ||||
| 2025-07-29 | 13F | Private Trust Co Na | 1,435 | -49.83 | 53 | -41.11 | ||||
| 2025-07-18 | 13F | Truist Financial Corp | 200,469 | -1.99 | 7,423 | 15.23 | ||||
| 2025-08-15 | 13F | Morgan Stanley | 14,954 | -26.48 | 554 | -13.59 | ||||
| 2025-07-21 | 13F | Greenwood Capital Associates Llc | 51,998 | 21.36 | 1,925 | 42.70 | ||||
| 2025-08-26 | 13F/A | Thrivent Financial For Lutherans | 34,390 | -93.88 | 1 | -94.74 | ||||
| 2025-08-14 | 13F | D. E. Shaw & Co., Inc. | 8,100 | 17.39 | 300 | 37.79 | ||||
| 2025-04-21 | 13F | Nelson, Van Denburg & Campbell Wealth Management Group, LLC | 0 | -100.00 | 0 | |||||
| 2025-08-13 | 13F | Flow Traders U.s. Llc | 0 | -100.00 | 0 | |||||
| 2025-09-04 | 13F/A | Advisor Group Holdings, Inc. | 721,700 | -30.49 | 26,723 | -18.31 | ||||
| 2025-07-29 | 13F | Salus Financial Advisors, LLC | 6,772 | -17.68 | 251 | -3.47 | ||||
| 2025-04-21 | 13F | ORG Partners LLC | 0 | -100.00 | 0 | |||||
| 2025-08-04 | 13F | Creekmur Asset Management LLC | 21,071 | 0.04 | 780 | 17.65 | ||||
| 2025-08-14 | 13F | Mml Investors Services, Llc | 5,981,257 | 20.36 | 221 | 41.67 | ||||
| 2025-08-04 | 13F | Atria Investments Llc | 111,039 | 2.60 | 4,112 | 20.59 | ||||
| 2025-08-12 | 13F | Vestor Capital, Llc | 12,665 | 45.74 | 1 | |||||
| 2025-07-22 | 13F | Merit Financial Group, LLC | 24,561 | 84.70 | 909 | 117.46 | ||||
| 2025-07-28 | 13F | Harbour Investments, Inc. | 35,388 | -2.01 | 1,310 | 15.22 | ||||
| 2025-04-21 | 13F | Envestnet Portfolio Solutions, Inc. | 0 | -100.00 | 0 | |||||
| 2025-08-14 | 13F | Redwood Financial Network Corp | 24,448 | 4.33 | 905 | 22.63 | ||||
| 2025-08-08 | 13F | Avantax Advisory Services, Inc. | 275,017 | 123.96 | 10,184 | 163.26 | ||||
| 2025-08-14 | 13F | Mercer Global Advisors Inc /adv | 6,593 | 244 | ||||||
| 2025-08-08 | 13F | Advyzon Investment Management, LLC | 12,282 | 455 | ||||||
| 2025-07-11 | 13F | Farther Finance Advisors, LLC | 1,072 | 40 | ||||||
| 2025-08-11 | 13F | CBIZ Investment Advisory Services, LLC | 0 | -100.00 | 0 | -100.00 | ||||
| 2025-07-15 | 13F | Perennial Advisors, LLC | 12,675 | 0.00 | 469 | 17.54 | ||||
| 2025-08-13 | 13F | Capital Analysts, Inc. | 472 | -98.76 | 0 | -100.00 | ||||
| 2025-08-11 | 13F | HighTower Advisors, LLC | 19,745 | 0.13 | 731 | 17.71 | ||||
| 2025-05-09 | 13F | Atria Wealth Solutions, Inc. | 0 | -100.00 | 0 | |||||
| 2025-08-11 | 13F | Private Advisor Group, LLC | 169,996 | -38.78 | 6,295 | -28.04 | ||||
| 2025-08-12 | 13F | J.w. Cole Advisors, Inc. | 11,935 | -51.75 | 442 | -43.39 | ||||
| 2025-08-14 | 13F | Bank Of America Corp /de/ | 8,651 | 251.10 | 320 | 315.58 | ||||
| 2025-08-08 | 13F | Independence Financial Advisors, LLC | 830,356 | 1,399.41 | 30,748 | 1,663.07 | ||||
| 2025-08-14 | 13F | RMB Capital Management, LLC | 5,822 | 216 | ||||||
| 2025-07-17 | 13F | Prepared Retirement Institute LLC | 239,293 | 64.32 | 8,861 | 93.18 | ||||
| 2025-07-18 | 13F | Pure Financial Advisors, Inc. | 21,944 | 3.04 | 813 | 21.19 | ||||
| 2025-08-15 | 13F | CI Private Wealth, LLC | 6,967 | 0.00 | 258 | 17.35 | ||||
| 2025-08-25 | 13F | Silverlake Wealth Management Llc | 81,009 | -17.10 | 3,000 | -2.57 | ||||
| 2025-07-24 | 13F | Us Bancorp \de\ | 4,087 | -9.92 | 151 | 6.34 | ||||
| 2025-08-13 | 13F | Marshall Wace, Llp | 34,819 | 1,289 | ||||||
| 2025-08-06 | 13F | Commonwealth Equity Services, Llc | 3,520,372 | 47.86 | 130 | 75.68 | ||||
| 2025-07-30 | 13F | Roman Butler Fullerton & Co | 7,078 | 0.13 | 270 | 23.96 | ||||
| 2025-08-04 | 13F | Creative Financial Designs Inc /adv | 101 | 0.00 | 4 | 0.00 | ||||
| 2025-08-13 | 13F | Northwestern Mutual Wealth Management Co | 497,331 | 8.68 | 18,416 | 27.76 | ||||
| 2025-08-01 | 13F | Gwn Securities Inc. | 5,567 | -84.52 | 206 | -83.28 | ||||
| 2025-07-14 | 13F | Abound Wealth Management | 1,093 | 40 | ||||||
| 2025-07-31 | 13F | First Business Financial Services, Inc. | 5,700 | 211 | ||||||
| 2025-07-14 | 13F | Infinity Wealth Counsel, LLC | 23,225 | 10.07 | 860 | 29.52 | ||||
| 2025-07-15 | 13F | Financial Partners Group, Inc | 58,112 | -7.34 | 2,152 | 8.91 | ||||
| 2025-05-14 | 13F | Ameriprise Financial Inc | 0 | -100.00 | 0 | -100.00 | ||||
| 2025-08-14 | 13F | Comerica Bank | 856 | 152.51 | 32 | 210.00 | ||||
| 2025-07-15 | 13F | Regatta Capital Group, Llc | 7,157 | 0.13 | 265 | 17.78 | ||||
| 2025-08-13 | 13F | Maia Wealth LLC | 10,183 | -4.33 | 377 | 15.29 | ||||
| 2025-08-14 | 13F | Investmark Advisory Group LLC | 53,740 | 448.14 | 1,990 | 546.10 | ||||
| 2025-08-14 | 13F | Integrated Wealth Concepts LLC | 153,232 | 4.52 | 5,674 | 22.89 | ||||
| 2025-07-23 | 13F | Traphagen Investment Advisors Llc | 18,187 | 0.12 | 673 | 17.66 | ||||
| 2025-08-14 | 13F | Mariner, LLC | 22,698 | 6.06 | 840 | 24.63 | ||||
| 2025-05-12 | 13F | Sandy Spring Bank | 3,051 | 96 | ||||||
| 2025-08-14 | 13F | Royal Bank Of Canada | 41,284 | -9.77 | 1,529 | 6.03 | ||||
| 2025-08-06 | 13F | Atlantic Union Bankshares Corp | 3,051 | 113 | ||||||
| 2025-08-12 | 13F | Pathstone Holdings, LLC | 10,344 | 0.12 | 383 | 17.85 | ||||
| 2025-08-12 | 13F | SlateStone Wealth, LLC | 5,564 | 0 | ||||||
| 2025-08-12 | 13F | Global Retirement Partners, LLC | 20,017 | 47,559.52 | 741 | 74,000.00 | ||||
| 2025-08-14 | 13F | Goldman Sachs Group Inc | 7,335 | 272 | ||||||
| 2025-08-13 | 13F | Truvestments Capital Llc | 300 | 0.00 | 11 | 22.22 | ||||
| 2025-08-07 | 13F | Rollins Financial Advisors, LLC | 53,948 | -15.16 | 1,998 | -0.25 | ||||
| 2025-07-10 | 13F | Wealth Enhancement Advisory Services, Llc | 12,493 | 466 | ||||||
| 2025-08-13 | 13F | Lido Advisors, LLC | 72,557 | 3.42 | 2,687 | 21.59 | ||||
| 2025-07-15 | 13F | FMA Wealth Management, LLC | 10,965 | 32.68 | 406 | 42.46 | ||||
| 2025-05-15 | 13F | National Wealth Management Group, LLC | 9,642 | 0.00 | 304 | -10.88 | ||||
| 2025-07-23 | 13F | Venturi Wealth Management, LLC | 8,000 | 0.00 | 296 | 17.46 | ||||
| 2025-07-17 | 13F | Sound Income Strategies, LLC | 1,006 | 0.00 | 37 | 19.35 | ||||
| 2025-08-14 | 13F | Qube Research & Technologies Ltd | 1,891 | -39.85 | 70 | -29.29 | ||||
| 2025-08-13 | 13F | Kuhn & Co Investment Counsel | 15,372 | 2.88 | 569 | 21.06 | ||||
| 2025-07-23 | 13F | Valmark Advisers, Inc. | 102,329 | 64.90 | 3,789 | 93.91 | ||||
| 2025-08-15 | 13F | Equitable Holdings, Inc. | 948,919 | -30.16 | 35,138 | -17.90 | ||||
| 2025-07-10 | 13F | Security National Bank | 11,175 | 0.00 | 414 | 17.33 | ||||
| 2025-08-13 | 13F | Russell Investments Group, Ltd. | 1,082 | 40 | ||||||
| 2025-07-14 | 13F | AdvisorNet Financial, Inc | 1,621 | 0.00 | 60 | 17.65 | ||||
| 2025-08-14 | 13F | Coastal Bridge Advisors, LLC | 10,793 | 0.12 | 400 | 17.70 | ||||
| 2025-07-23 | 13F | InTrack Investment Management Inc | 39,816 | 1,474 | ||||||
| 2025-08-11 | 13F | Principal Securities, Inc. | 185,403 | 10,263.50 | 6,865 | 10,796.83 | ||||
| 2025-07-25 | 13F | Gibson Capital, LLC | 16,230 | 0.00 | 601 | 17.61 | ||||
| 2025-07-30 | 13F | Cullen/frost Bankers, Inc. | 5,308 | 90.52 | 197 | 125.29 | ||||
| 2025-08-08 | 13F | Larson Financial Group LLC | 641 | 75.62 | 24 | 109.09 | ||||
| 2025-08-14 | 13F | LaSalle St. Investment Advisors, LLC | 13,775 | -2.73 | 1 | |||||
| 2025-08-18 | 13F | Geneos Wealth Management Inc. | 250 | 0.00 | 9 | 28.57 | ||||
| 2025-08-14 | 13F | Sunbelt Securities, Inc. | 5,969 | -17.56 | 211 | -7.46 | ||||
| 2025-08-07 | 13F | CENTRAL TRUST Co | 440 | 0.00 | 16 | 23.08 | ||||
| 2025-07-10 | 13F | Sovran Advisors, LLC | 26,496 | 162.47 | 980 | 226.33 | ||||
| 2025-07-16 | 13F | Castleview Partners, Llc | 92,003 | 3,407 | ||||||
| 2025-08-06 | 13F | New Millennium Group LLC | 0 | 0 | ||||||
| 2025-07-31 | 13F | Glass Jacobson Investment Advisors llc | 0 | -100.00 | 0 | |||||
| 2025-08-12 | 13F | LPL Financial LLC | 1,836,582 | 47.64 | 68,009 | 73.56 | ||||
| 2025-08-13 | 13F | EverSource Wealth Advisors, LLC | 9,313 | -1.64 | 345 | 15.44 |