Mga Batayang Estadistika
| Pemilik Institusional | 169 total, 169 long only, 0 short only, 0 long/short - change of 18.06% MRQ |
| Alokasi Portofolio Rata-rata | 0.6805 % - change of -23.12% MRQ |
| Saham Institusional (Jangka Panjang) | 31,531,669 (ex 13D/G) - change of -1.61MM shares -4.85% MRQ |
| Nilai Institusional (Jangka Panjang) | $ 991,423 USD ($1000) |
Kepemilikan Institusional dan Pemegang Saham
Franklin Templeton ETF Trust - Franklin FTSE Japan ETF (US:FLJP) memiliki 169 pemilik institusional dan pemegang saham yang telah mengajukan formulir 13D/G atau 13F kepada Komisi Bursa Efek (Securities Exchange Commission/SEC). Lembaga-lembaga ini memegang total 31,531,669 saham. Pemegang saham terbesar meliputi Bank Of America Corp /de/, Morgan Stanley, LPL Financial LLC, Janus Henderson Group Plc, Clayton Street Trust - Protective Life Dynamic Allocation Series - Moderate Portfolio, Bank Of Montreal /can/, Envestnet Asset Management Inc, RiverFront Investment Group, LLC, Arvest Bank Trust Division, and Agf Management Ltd .
Struktur kepemilikan institusional Franklin Templeton ETF Trust - Franklin FTSE Japan ETF (ARCA:FLJP) menunjukkan posisi terkini di perusahaan oleh institusi dan dana, serta perubahan terbaru dalam ukuran posisi. Pemegang saham utama dapat mencakup investor individu, reksa dana, dana lindung nilai, atau institusi. Jadwal 13D menunjukkan bahwa investor memegang (atau pernah memegang) lebih dari 5% saham perusahaan dan bermaksud (atau pernah bermaksud) untuk secara aktif mengejar perubahan strategi bisnis. Jadwal 13G menunjukkan investasi pasif lebih dari 5%.
The share price as of September 5, 2025 is 34.19 / share. Previously, on September 9, 2024, the share price was 29.53 / share. This represents an increase of 15.78% over that period.

Skor Sentimen Dana
Skor Sentimen Dana (sebelumnya dikenal sebagai Skor Akumulasi Kepemilikan) menemukan saham-saham yang paling banyak dibeli oleh dana. Ini adalah hasil dari model kuantitatif multi-faktor yang canggih yang mengidentifikasi perusahaan dengan tingkat akumulasi institusional tertinggi. Model penilaian menggunakan kombinasi dari total peningkatan pemilik yang diungkapkan, perubahan dalam alokasi portofolio pada pemilik tersebut, dan metrik lainnya. Angka berkisar dari 0 hingga 100, dengan angka yang lebih tinggi menunjukkan tingkat akumulasi yang lebih tinggi dibandingkan dengan perusahaan sejenisnya, dan 50 adalah rata-ratanya.
Frekuensi Pembaruan: Setiap Hari
Lihat Ownership Explorer, yang menyediakan daftar perusahaan dengan peringkat tertinggi.
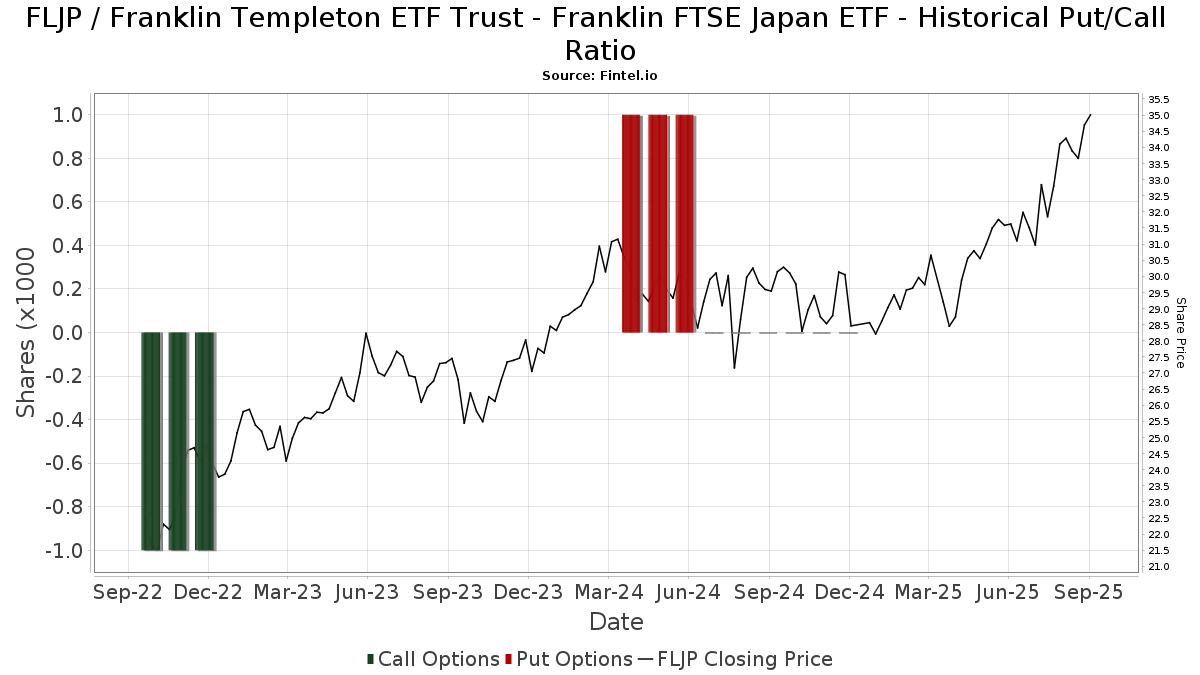
Rasio Put/Call Institusional
Selain melaporkan isu ekuitas dan utang standar, institusi dengan aset di bawah manajemen lebih dari 100 juta dolar AS juga harus mengungkapkan kepemilikan opsi put dan call mereka. Karena opsi put umumnya menunjukkan sentimen negatif, dan opsi call menunjukkan sentimen positif, kita dapat mengetahui sentimen institusional secara keseluruhan dengan memplot rasio put terhadap call. Grafik di sebelah kanan memplot rasio put/call historis untuk instrumen ini.
Menggunakan Rasio Put/Call sebagai indikator sentimen investor mengatasi salah satu kekurangan utama dari penggunaan total kepemilikan institusional, yaitu sejumlah besar aset yang dikelola diinvestasikan secara pasif untuk melacak indeks. Dana yang dikelola secara pasif biasanya tidak membeli opsi, sehingga indikator rasio put/call lebih akurat dalam melacak sentimen dana yang dikelola secara aktif.
Pengajuan 13F dan NPORT
Detail pada pengajuan 13F tersedia gratis. Detail pada pengajuan NP memerlukan keanggotaan premium. Baris berwarna hijau menunjukkan posisi baru. Baris berwarna merah menunjukkan posisi yang sudah ditutup. Klik tautan ini ikon untuk melihat riwayat transaksi selengkapnya.
Tingkatkan
untuk membuka data premium dan mengekspor ke Excel ![]() .
.
| Tanggal File | Sumber | Investor | Ketik | Presyo ng Avg (Silangan) |
Saham | Δ Saham (%) |
Dilaporkan Nilai ($1000) |
Nilai Δ (%) |
Alokasi Port (%) |
|
|---|---|---|---|---|---|---|---|---|---|---|
| 2025-07-29 | 13F | Yoffe Investment Management, LLC | 11,410 | 0.00 | 367 | 9.25 | ||||
| 2025-08-14 | 13F | Mml Investors Services, Llc | 81,805 | 12.00 | 3 | 0.00 | ||||
| 2025-05-14 | 13F | Itau Unibanco Holding S.A. | 0 | -100.00 | 0 | |||||
| 2025-07-16 | 13F | Signaturefd, Llc | 60 | -58.33 | 2 | -75.00 | ||||
| 2025-08-14 | 13F | Ancora Advisors, LLC | 0 | -100.00 | 0 | |||||
| 2025-08-07 | 13F | Compass Financial Group, Inc. | 0 | -100.00 | 0 | |||||
| 2025-08-07 | 13F | Resources Investment Advisors, LLC. | 28,628 | -59.52 | 920 | -55.73 | ||||
| 2025-07-24 | 13F | Us Bancorp \de\ | 221 | -12.99 | 7 | 0.00 | ||||
| 2025-08-11 | 13F | HighTower Advisors, LLC | 52,137 | -0.22 | 1,676 | 9.11 | ||||
| 2025-08-14 | 13F | Bank Of America Corp /de/ | 11,359,669 | -0.64 | 365,213 | 8.66 | ||||
| 2025-07-24 | 13F | IFP Advisors, Inc | 9,722 | 60.85 | 313 | 76.27 | ||||
| 2025-05-14 | 13F | Visionary Wealth Advisors | 0 | -100.00 | 0 | |||||
| 2025-07-08 | 13F | Parallel Advisors, LLC | 30 | 0.00 | 1 | |||||
| 2025-08-05 | 13F | Bank Of Montreal /can/ | 662,168 | 288.04 | 21,289 | 324.40 | ||||
| 2025-07-28 | 13F | Harbour Investments, Inc. | 7,780 | 67.02 | 250 | 83.82 | ||||
| 2025-08-29 | NP | N/A - Protective Life Dynamic Allocation Series - Conservative Portfolio | 32,389 | -5.77 | 1,041 | 3.07 | ||||
| 2025-08-12 | 13F | MAI Capital Management | 500 | -7.92 | 16 | 6.67 | ||||
| 2025-05-06 | 13F | Venturi Wealth Management, LLC | 0 | -100.00 | 0 | |||||
| 2025-04-17 | 13F | Sound Income Strategies, LLC | 0 | -100.00 | 0 | |||||
| 2025-08-13 | 13F/A | StoneX Group Inc. | 200,000 | 5,420 | ||||||
| 2025-08-12 | 13F | Atlas Capital Advisors Llc | 206,781 | -6.27 | 6,648 | 2.51 | ||||
| 2025-07-10 | 13F | Wealth Enhancement Advisory Services, Llc | 25,607 | 26.92 | 820 | 38.28 | ||||
| 2025-08-05 | 13F | Huntington National Bank | 31 | 7.14 | ||||||
| 2025-08-07 | 13F | WESCAP Management Group, Inc. | 18,098 | -1.31 | 582 | 7.79 | ||||
| 2025-08-08 | 13F | Creative Planning | 10,923 | 54.76 | 351 | 69.57 | ||||
| 2025-07-24 | 13F | Ronald Blue Trust, Inc. | 194 | 0.00 | 6 | 20.00 | ||||
| 2025-08-13 | 13F | Northwestern Mutual Wealth Management Co | 2,899 | 29.07 | 93 | 40.91 | ||||
| 2025-08-11 | 13F | Madison Asset Management, LLC | 396,238 | -40.95 | 12,739 | -35.42 | ||||
| 2025-08-12 | 13F | RiverFront Investment Group, LLC | 632,962 | 3.00 | 20,350 | 12.63 | ||||
| 2025-07-23 | 13F | Spectrum Asset Management, Inc. (NB/CA) | 58,219 | 1,872 | ||||||
| 2025-08-14 | 13F | Wells Fargo & Company/mn | 275 | -27.06 | 9 | -27.27 | ||||
| 2025-08-29 | NP | Clayton Street Trust - Protective Life Dynamic Allocation Series - Growth Portfolio | 59,766 | -11.22 | 1,921 | -2.93 | ||||
| 2025-08-14 | 13F | Main Street Financial Solutions, LLC | 14,251 | 458 | ||||||
| 2025-08-14 | 13F | DZ BANK AG Deutsche Zentral Genossenschafts Bank, Frankfurt am Main | 24,388 | -97.45 | 784 | -97.21 | ||||
| 2025-08-07 | 13F | Evoke Wealth, Llc | 52,572 | 0.00 | 1,690 | 9.39 | ||||
| 2025-08-13 | 13F | Baird Financial Group, Inc. | 10,778 | 7.38 | 347 | 17.29 | ||||
| 2025-04-25 | 13F | New Millennium Group LLC | 0 | -100.00 | 0 | |||||
| 2025-08-14 | 13F | Janus Henderson Group Plc | 820,571 | -6.23 | 26,381 | 1.67 | ||||
| 2025-06-27 | NP | INTL - Main International ETF | 0 | -100.00 | 0 | -100.00 | ||||
| 2025-06-26 | NP | SSXU - Day Hagan/Ned Davis Research Smart Sector International ETF | 171,793 | -31.68 | 5,250 | -28.28 | ||||
| 2025-08-29 | NP | Clayton Street Trust - Protective Life Dynamic Allocation Series - Moderate Portfolio | 738,036 | -4.58 | 23,728 | 4.35 | ||||
| 2025-04-25 | 13F | Saxon Interests, Inc. | 0 | -100.00 | 0 | |||||
| 2025-05-14 | 13F | Level Four Advisory Services, Llc | 0 | -100.00 | 0 | |||||
| 2025-08-14 | 13F | EP Wealth Advisors, Inc. | 18,738 | -93.71 | 602 | -93.13 | ||||
| 2025-08-12 | 13F | Winnow Wealth Llc | 119,965 | 3,857 | ||||||
| 2025-05-09 | 13F | CoreCap Advisors, LLC | 0 | -100.00 | 0 | |||||
| 2025-08-04 | 13F | Simon Quick Advisors, Llc | 249,307 | 8,015 | ||||||
| 2025-08-12 | 13F | Proequities, Inc. | 0 | 0 | ||||||
| 2025-08-14 | 13F | Ameriprise Financial Inc | 249,268 | -38.86 | 8,014 | -33.09 | ||||
| 2025-08-11 | 13F | Brown Brothers Harriman & Co | 619 | 20 | ||||||
| 2025-07-11 | 13F | Adirondack Trust Co | 539 | 17 | ||||||
| 2025-08-13 | 13F | Kilter Group LLC | 101 | 3 | ||||||
| 2025-08-14 | 13F | Raymond James Financial Inc | 311,468 | -2.75 | 10,014 | 6.35 | ||||
| 2025-08-04 | 13F | Spire Wealth Management | 59 | -14.49 | 2 | -50.00 | ||||
| 2025-08-14 | 13F | UBS Group AG | 271,576 | -29.55 | 8,731 | -22.97 | ||||
| 2025-08-14 | 13F | Kovitz Investment Group Partners, LLC | 35,421 | -0.71 | 1,139 | 8.59 | ||||
| 2025-04-01 | 13F | Confluence Investment Management Llc | 0 | -100.00 | 0 | |||||
| 2025-08-11 | 13F | Principal Securities, Inc. | 44 | 1 | ||||||
| 2025-08-14 | 13F | Quantinno Capital Management LP | 38,608 | -1.74 | 1,241 | 7.45 | ||||
| 2025-04-25 | 13F | Stonebridge Financial Group, LLC | 0 | -100.00 | 0 | |||||
| 2025-08-06 | 13F | Agf Management Ltd | 430,131 | 6.71 | 13,829 | 16.69 | ||||
| 2025-05-09 | 13F | Wealthspire Advisors, LLC | 0 | -100.00 | 0 | |||||
| 2025-08-14 | 13F | Goldman Sachs Group Inc | 243,380 | 7,825 | ||||||
| 2025-07-14 | 13F | Toth Financial Advisory Corp | 0 | -100.00 | 0 | |||||
| 2025-06-17 | NP | MCNAX - Madison Conservative Allocation Fund Conservative Allocation Fund Class A | 31,703 | 10.04 | 969 | 15.51 | ||||
| 2025-08-14 | 13F | Hrt Financial Lp | 34,942 | 1 | ||||||
| 2025-08-19 | 13F | Newbridge Financial Services Group, Inc. | 80 | 0.00 | 3 | 0.00 | ||||
| 2025-07-28 | 13F | Fairman Group, LLC | 67 | 0.00 | 2 | 100.00 | ||||
| 2025-07-29 | 13F | Koshinski Asset Management, Inc. | 8,285 | 9.81 | 266 | 20.36 | ||||
| 2025-08-04 | 13F | Virtus Family Office LLC | 17,800 | 39.88 | 572 | 52.94 | ||||
| 2025-08-01 | 13F | New York Life Investment Management Llc | 0 | -100.00 | 0 | |||||
| 2025-08-13 | 13F | EverSource Wealth Advisors, LLC | 31,945 | 1.76 | 1,027 | 11.39 | ||||
| 2025-08-05 | 13F | Mma Asset Management Llc | 146,675 | 4,716 | ||||||
| 2025-08-04 | 13F | Pensionmark Financial Group, Llc | 13,748 | 2.83 | 442 | 12.47 | ||||
| 2025-08-05 | 13F | Carolinas Wealth Consulting Llc | 0 | -100.00 | 0 | -100.00 | ||||
| 2025-07-16 | 13F | Paragon Capital Management Ltd | 152,205 | 118.35 | 4,893 | 138.80 | ||||
| 2025-08-14 | 13F | Sunbelt Securities, Inc. | 200 | 0.00 | 6 | 0.00 | ||||
| 2025-08-13 | 13F | Cerity Partners LLC | 11,336 | -23.41 | 364 | -16.32 | ||||
| 2025-07-17 | 13F | Keystone Global Partners, LLC | 0 | -100.00 | 0 | |||||
| 2025-08-08 | 13F | Gts Securities Llc | 324,654 | 10,438 | ||||||
| 2025-08-12 | 13F | AlphaCore Capital LLC | 79 | 71.74 | 3 | 100.00 | ||||
| 2025-07-17 | 13F | Janney Montgomery Scott LLC | 75,474 | -2.34 | 2 | 0.00 | ||||
| 2025-09-04 | 13F/A | Advisor Group Holdings, Inc. | 19,766 | 9.16 | 636 | 19.36 | ||||
| 2025-08-12 | 13F | O'shaughnessy Asset Management, Llc | 5,904 | -6.46 | 190 | 2.16 | ||||
| 2025-05-15 | 13F | GWM Advisors LLC | 0 | -100.00 | 0 | |||||
| 2025-07-25 | 13F | Almanack Investment Partners, LLC. | 30,475 | 4.33 | 980 | 14.10 | ||||
| 2025-08-08 | 13F | Pnc Financial Services Group, Inc. | 4,702 | 0.00 | 151 | 9.42 | ||||
| 2025-08-08 | 13F | Mittelman Wealth Management | 108,395 | 13.55 | 3,485 | 24.16 | ||||
| 2025-08-14 | 13F | Comerica Bank | 36,978 | 123.72 | 1,189 | 144.95 | ||||
| 2025-07-22 | 13F | Belpointe Asset Management LLC | 19,820 | 637 | ||||||
| 2025-08-08 | 13F | Rockefeller Capital Management L.P. | 0 | -100.00 | 0 | |||||
| 2025-08-12 | 13F | Franklin Resources Inc | 7,547 | -98.15 | 243 | -97.98 | ||||
| 2025-08-14 | 13F | Mariner, LLC | 47,319 | 0.35 | 1,521 | 9.74 | ||||
| 2025-08-14 | 13F | Paces Ferry Wealth Advisors, Llc | 10,260 | -1.89 | 330 | 7.17 | ||||
| 2025-07-23 | 13F | Vontobel Holding Ltd. | 144,100 | -5.88 | 4,633 | 2.98 | ||||
| 2025-05-15 | 13F | Proquility Private Wealth Partners, LLC | 242,846 | 43.90 | 7,140 | 47.87 | ||||
| 2025-07-15 | 13F | Armis Advisers, LLC | 169,366 | 5,274 | ||||||
| 2025-08-13 | 13F | Rsm Us Wealth Management Llc | 8,644 | -1.90 | 278 | 6.95 | ||||
| 2025-07-21 | 13F | Ameritas Advisory Services, LLC | 200 | 6 | ||||||
| 2025-07-23 | 13F | Clear Creek Financial Management, LLC | 41,405 | 1,331 | ||||||
| 2025-08-06 | 13F | Innealta Capital, Llc | 220,030 | -17.43 | 7,074 | -9.71 | ||||
| 2025-07-31 | 13F | Brinker Capital Investments, LLC | 0 | -100.00 | 0 | -100.00 | ||||
| 2025-07-31 | 13F | Sage Mountain Advisors LLC | 2,125 | 0.00 | 68 | 9.68 | ||||
| 2025-08-14 | 13F | Jane Street Group, Llc | 67,027 | 2,155 | ||||||
| 2025-07-14 | 13F | Armstrong Advisory Group, Inc | 3,383 | 109 | ||||||
| 2025-07-28 | 13F | SFG Wealth Management, LLC. | 0 | -100.00 | 0 | |||||
| 2025-08-04 | 13F | Impact Partnership Wealth, LLC | 262,140 | 3.60 | 8,428 | 13.28 | ||||
| 2025-06-17 | NP | MMDAX - Madison Moderate Allocation Fund Moderate Allocation Fund Class A | 124,124 | 11.04 | 3,793 | 16.60 | ||||
| 2025-06-17 | NP | MAGSX - Madison Aggressive Allocation Fund Aggressive Allocation Fund Class A | 96,500 | 8.60 | 2,949 | 14.04 | ||||
| 2025-05-05 | 13F | Eagle Bay Advisors LLC | 0 | -100.00 | 0 | |||||
| 2025-07-31 | 13F | Opes Wealth Management LLC | 185,706 | 5.60 | 5,970 | 15.47 | ||||
| 2025-08-14 | 13F | Knightsbridge Asset Management, Llc | 51,415 | 9.47 | 1,653 | 19.71 | ||||
| 2025-08-12 | 13F | LPL Financial LLC | 867,229 | -12.70 | 27,881 | -4.54 | ||||
| 2025-07-10 | 13F | Farmers & Merchants Trust Co of Chambersburg PA | 369 | 0.00 | 0 | |||||
| 2025-05-15 | 13F | Citadel Advisors Llc | Put | 0 | -100.00 | 0 | -100.00 | |||
| 2025-07-14 | 13F | GAMMA Investing LLC | 259 | 0.00 | 8 | 14.29 | ||||
| 2025-08-14 | 13F | Fmr Llc | 4,527 | -7.73 | 146 | 0.69 | ||||
| 2025-08-29 | NP | GDMA - Gadsden Dynamic Multi-Asset ETF | 230,062 | -10.19 | 7,396 | -1.79 | ||||
| 2025-08-18 | NP | ULTRA SERIES FUND - Aggressive Allocation Fund Class I | 65,269 | -8.93 | 2,098 | -0.43 | ||||
| 2025-08-06 | 13F | Commonwealth Equity Services, Llc | 10,560 | 40.63 | 0 | |||||
| 2025-05-15 | 13F | Citadel Advisors Llc | Call | 0 | -100.00 | 0 | -100.00 | |||
| 2025-07-07 | 13F | General Partner, Inc. | 30,295 | 0.00 | 974 | 9.33 | ||||
| 2025-07-31 | 13F | Leavell Investment Management, Inc. | 87,815 | 4.13 | 2,823 | 13.88 | ||||
| 2025-08-18 | 13F/A | National Bank Of Canada /fi/ | 5,627 | 85.96 | 181 | 104.55 | ||||
| 2025-08-14 | 13F | Old Mission Capital Llc | 14,987 | 482 | ||||||
| 2025-08-18 | NP | ULTRA SERIES FUND - Conservative Allocation Fund Class I | 30,115 | -18.79 | 968 | -11.19 | ||||
| 2025-05-09 | 13F | Connable Office Inc | 0 | -100.00 | 0 | |||||
| 2025-08-12 | NP | DFNDX - Kensington Defender Fund Institutional Class | 120,172 | -51.15 | 3,864 | -45.40 | ||||
| 2025-07-10 | 13F | Atticus Wealth Management, Llc | 125 | 4 | ||||||
| 2025-08-05 | 13F | Harel Insurance Investments & Financial Services Ltd. | 3,400 | 385.71 | 0 | |||||
| 2025-08-12 | 13F | Accordant Advisory Group Inc | 119,965 | 3,857 | ||||||
| 2025-08-13 | 13F | Berkshire Asset Management Llc/pa | 6,586 | 0.00 | 212 | 4.46 | ||||
| 2025-08-14 | 13F | Stifel Financial Corp | 22,890 | 0.94 | 736 | 10.36 | ||||
| 2025-08-12 | 13F | Archer Investment Corp | 313 | 0.00 | 10 | 11.11 | ||||
| 2025-08-13 | 13F | Flow Traders U.s. Llc | 32,801 | 1 | ||||||
| 2025-08-11 | 13F | Empowered Funds, LLC | 230,687 | -9.94 | 7,417 | -1.53 | ||||
| 2025-08-06 | 13F | AE Wealth Management LLC | 825 | -7.20 | 27 | 0.00 | ||||
| 2025-08-13 | 13F | GeoWealth Management, LLC | 5,919 | 190 | ||||||
| 2025-05-27 | NP | MAINSTAY VP FUNDS TRUST - MainStay VP IQ Hedge Multi-Strategy Portfolio Initial Class | 2,445 | -13.36 | 72 | -11.25 | ||||
| 2025-08-13 | 13F | Avestar Capital, LLC | 321,882 | 10,349 | ||||||
| 2025-03-28 | NP | QAI - IQ Hedge Multi-Strategy Tracker ETF | 7,639 | 5.41 | 222 | 6.22 | ||||
| 2025-08-18 | NP | ULTRA SERIES FUND - Moderate Allocation Fund Class I | 114,414 | -20.62 | 3,678 | -13.19 | ||||
| 2025-05-12 | 13F | Benjamin Edwards Inc | 0 | -100.00 | 0 | |||||
| 2025-07-15 | 13F | Td Private Client Wealth Llc | 1,132 | -42.24 | 36 | -36.84 | ||||
| 2025-08-14 | 13F | Fiduciary Trust Co | 15,055 | 0.00 | 484 | 9.50 | ||||
| 2025-07-17 | 13F | Clean Yield Group | 1,750 | 0.00 | 56 | 9.80 | ||||
| 2025-07-29 | 13F | Crux Wealth Advisors | 23,686 | -28.08 | 762 | -21.38 | ||||
| 2025-08-11 | 13F | Inspire Advisors, LLC | 37,405 | 87.22 | 1,203 | 104.77 | ||||
| 2025-04-10 | 13F | Hennion & Walsh Asset Management, Inc. | 0 | -100.00 | 0 | |||||
| 2025-08-01 | 13F | Rossby Financial, LCC | 50 | 0.00 | 2 | 0.00 | ||||
| 2025-08-01 | 13F | Envestnet Asset Management Inc | 659,760 | 0.01 | 21,211 | 9.37 | ||||
| 2025-07-25 | 13F | Cwm, Llc | 11,651 | 1,072.13 | 0 | |||||
| 2025-08-08 | 13F | Principal Financial Group Inc | 0 | -100.00 | 0 | |||||
| 2025-08-18 | 13F | Geneos Wealth Management Inc. | 389 | 13 | ||||||
| 2025-08-08 | 13F | Kingsview Wealth Management, LLC | 7,371 | 237 | ||||||
| 2025-08-07 | 13F | Altman Advisors, Inc. | 57,432 | 3.86 | 1,836 | 8.64 | ||||
| 2025-05-16 | 13F | Jones Financial Companies Lllp | 0 | -100.00 | 0 | |||||
| 2025-08-07 | 13F | Allworth Financial LP | 70 | -85.26 | 2 | -85.71 | ||||
| 2025-08-29 | NP | RAA - SMI 3Fourteen Real Asset Allocation ETF SMI 3Fourteen REAL Asset Allocation ETF | 152,121 | 4,891 | ||||||
| 2025-08-12 | 13F | Steward Partners Investment Advisory, Llc | 313,151 | 0.50 | 10,068 | 9.90 | ||||
| 2025-08-14 | 13F | Toroso Investments, LLC | 136,325 | 12.91 | 4,383 | 23.47 | ||||
| 2025-08-01 | 13F | Bessemer Group Inc | 0 | -100.00 | 0 | |||||
| 2025-05-15 | 13F | Main Management LLC | 0 | -100.00 | 0 | |||||
| 2025-08-13 | 13F | Bare Financial Services, Inc | 432 | 0.00 | 14 | 8.33 | ||||
| 2025-08-15 | 13F | Morgan Stanley | 4,441,003 | 7.07 | 142,778 | 17.08 | ||||
| 2025-08-12 | 13F | Kensington Asset Management, LLC | 120,172 | 3,864 | ||||||
| 2025-07-29 | 13F | Private Trust Co Na | 168 | -9.19 | 5 | 0.00 | ||||
| 2025-06-27 | NP | DAAVX - Dunham Dynamic Macro Fund Class A | 153,100 | 3.80 | 4,679 | 8.97 | ||||
| 2025-08-14 | 13F | Alaska Permanent Fund Corp | 0 | -100.00 | 0 | |||||
| 2025-05-12 | 13F | Sandy Spring Bank | 100 | 3 | ||||||
| 2025-08-14 | 13F | Hara Capital LLC | 120 | 0.00 | 4 | 0.00 | ||||
| 2025-08-28 | NP | ICCIX - Dynamic International Opportunity Fund Class I | 219,688 | -17.46 | 7,063 | -9.74 | ||||
| 2025-08-12 | 13F | Global Retirement Partners, LLC | 10,218 | -4.92 | 329 | 6.84 | ||||
| 2025-05-13 | 13F | Heck Capital Advisors, LLC | 0 | -100.00 | 0 | -100.00 | ||||
| 2025-08-14 | 13F | Principia Wealth Advisory, LLC | 2,401 | 77 | ||||||
| 2025-08-08 | 13F | Tortoise Investment Management, LLC | 4,400 | 0.00 | 141 | 9.30 | ||||
| 2025-05-15 | 13F | SRS Capital Advisors, Inc. | 0 | -100.00 | 0 | |||||
| 2025-08-11 | 13F | HHM Wealth Advisors, LLC | 100 | 3 | ||||||
| 2025-07-28 | 13F | BRYN MAWR TRUST Co | 7,636 | -8.32 | 245 | 0.41 | ||||
| 2025-05-14 | 13F | Susquehanna International Group, Llp | 0 | -100.00 | 0 | |||||
| 2025-08-11 | 13F | Annis Gardner Whiting Capital Advisors, LLC | 731 | 24 | ||||||
| 2025-08-13 | 13F | Townsquare Capital Llc | 0 | -100.00 | 0 | |||||
| 2025-08-14 | 13F | Qube Research & Technologies Ltd | 5,732 | 184 | ||||||
| 2025-08-12 | 13F | Jpmorgan Chase & Co | 71,615 | 125.63 | 2,302 | 146.73 | ||||
| 2025-07-07 | 13F | Nova Wealth Management, Inc. | 70 | 2 | ||||||
| 2025-05-13 | 13F | Bokf, Na | 0 | -100.00 | 0 | |||||
| 2025-08-14 | 13F | Royal Bank Of Canada | 174,874 | 23.41 | 5,621 | 34.93 | ||||
| 2025-08-04 | 13F | Assetmark, Inc | 80 | 3 | ||||||
| 2025-08-13 | 13F | Green Harvest Asset Management LLC | 50,151 | 44.17 | 1,612 | 57.73 | ||||
| 2025-08-13 | 13F | Capital Analysts, Inc. | 121 | 0.00 | 0 | |||||
| 2025-07-31 | 13F | Wealthfront Advisers Llc | 15,481 | 2.31 | 498 | 11.94 | ||||
| 2025-08-15 | 13F | Chapman Financial Group, Llc | 15,425 | -3.74 | 496 | 8.08 | ||||
| 2025-07-16 | 13F | BOS Asset Management, LLC | 8,232 | 265 | ||||||
| 2025-07-30 | 13F | Strategic Investment Management, Llc | 0 | -100.00 | 0 | |||||
| 2025-08-08 | 13F | Cetera Investment Advisers | 43,242 | 31.16 | 1,390 | 43.45 | ||||
| 2025-05-15 | 13F | Main Management ETF Advisors, LLC | 0 | -100.00 | 0 | |||||
| 2025-08-11 | 13F | Private Advisor Group, LLC | 11,185 | -5.28 | 360 | 3.46 | ||||
| 2025-07-08 | 13F | Boltwood Capital Management | 12,200 | 34.07 | 392 | 46.82 | ||||
| 2025-08-14 | 13F | Coastal Bridge Advisors, LLC | 9,273 | 0.00 | 298 | 9.56 | ||||
| 2025-08-01 | 13F | Y-Intercept (Hong Kong) Ltd | 9,663 | 311 | ||||||
| 2025-08-08 | 13F | Arvest Bank Trust Division | 530,359 | -0.91 | 17,051 | 8.36 | ||||
| 2025-07-11 | 13F | Farther Finance Advisors, LLC | 1,284 | -65.58 | 41 | -62.04 | ||||
| 2025-07-03 | 13F | Arvest Investments, Inc. | 205,030 | -1.99 | 6,592 | 7.17 | ||||
| 2025-08-13 | 13F | Congress Wealth Management LLC / DE / | 321,981 | -1.00 | 10,352 | 8.26 | ||||
| 2025-05-14 | 13F | Bnp Paribas Arbitrage, Sa | 0 | -100.00 | 0 | |||||
| 2025-07-18 | 13F | Truist Financial Corp | 15,965 | -5.36 | 513 | 3.64 | ||||
| 2025-08-13 | 13F | Hsbc Holdings Plc | 15,510 | 499 | ||||||
| 2025-08-14 | 13F | D. E. Shaw & Co., Inc. | 32,437 | 1,043 | ||||||
| 2025-07-28 | 13F | Rainwater Charitable Foundation | 328,743 | 0.00 | 10,569 | 9.35 | ||||
| 2025-08-14 | 13F | Citadel Advisors Llc | 165,020 | 5,305 | ||||||
| 2025-07-31 | 13F | Cambridge Investment Research Advisors, Inc. | 6,358 | -14.42 | 0 | |||||
| 2025-08-26 | 13F/A | Thrivent Financial For Lutherans | 347,380 | -8.15 | 11 | 0.00 |
Other Listings
| MX:FLJP |