Mga Batayang Estadistika
| Pemilik Institusional | 177 total, 177 long only, 0 short only, 0 long/short - change of 5.99% MRQ |
| Alokasi Portofolio Rata-rata | 0.1197 % - change of -3.13% MRQ |
| Saham Institusional (Jangka Panjang) | 3,147,225 (ex 13D/G) - change of -0.07MM shares -2.21% MRQ |
| Nilai Institusional (Jangka Panjang) | $ 420,773 USD ($1000) |
Kepemilikan Institusional dan Pemegang Saham
First Trust Exchange-Traded Fund - First Trust US Equity Opportunities ETF (US:FPX) memiliki 177 pemilik institusional dan pemegang saham yang telah mengajukan formulir 13D/G atau 13F kepada Komisi Bursa Efek (Securities Exchange Commission/SEC). Lembaga-lembaga ini memegang total 3,147,225 saham. Pemegang saham terbesar meliputi Morgan Stanley, LPL Financial LLC, Wells Fargo & Company/mn, Raymond James Financial Inc, Bank Of America Corp /de/, Congress Wealth Management LLC / DE /, Cetera Investment Advisers, Commonwealth Equity Services, Llc, Cassia Capital Partners, LLC, and Cambridge Investment Research Advisors, Inc. .
Struktur kepemilikan institusional First Trust Exchange-Traded Fund - First Trust US Equity Opportunities ETF (ARCA:FPX) menunjukkan posisi terkini di perusahaan oleh institusi dan dana, serta perubahan terbaru dalam ukuran posisi. Pemegang saham utama dapat mencakup investor individu, reksa dana, dana lindung nilai, atau institusi. Jadwal 13D menunjukkan bahwa investor memegang (atau pernah memegang) lebih dari 5% saham perusahaan dan bermaksud (atau pernah bermaksud) untuk secara aktif mengejar perubahan strategi bisnis. Jadwal 13G menunjukkan investasi pasif lebih dari 5%.
The share price as of September 5, 2025 is 150.80 / share. Previously, on September 9, 2024, the share price was 100.49 / share. This represents an increase of 50.07% over that period.

Skor Sentimen Dana
Skor Sentimen Dana (sebelumnya dikenal sebagai Skor Akumulasi Kepemilikan) menemukan saham-saham yang paling banyak dibeli oleh dana. Ini adalah hasil dari model kuantitatif multi-faktor yang canggih yang mengidentifikasi perusahaan dengan tingkat akumulasi institusional tertinggi. Model penilaian menggunakan kombinasi dari total peningkatan pemilik yang diungkapkan, perubahan dalam alokasi portofolio pada pemilik tersebut, dan metrik lainnya. Angka berkisar dari 0 hingga 100, dengan angka yang lebih tinggi menunjukkan tingkat akumulasi yang lebih tinggi dibandingkan dengan perusahaan sejenisnya, dan 50 adalah rata-ratanya.
Frekuensi Pembaruan: Setiap Hari
Lihat Ownership Explorer, yang menyediakan daftar perusahaan dengan peringkat tertinggi.
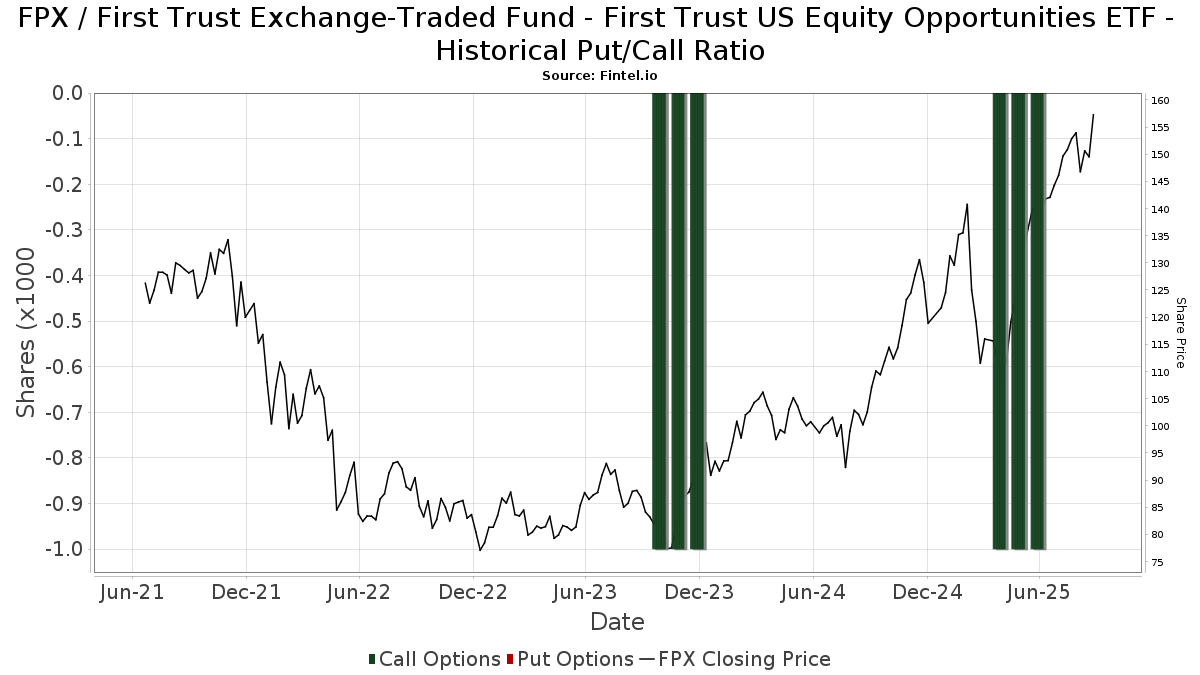
Rasio Put/Call Institusional
Selain melaporkan isu ekuitas dan utang standar, institusi dengan aset di bawah manajemen lebih dari 100 juta dolar AS juga harus mengungkapkan kepemilikan opsi put dan call mereka. Karena opsi put umumnya menunjukkan sentimen negatif, dan opsi call menunjukkan sentimen positif, kita dapat mengetahui sentimen institusional secara keseluruhan dengan memplot rasio put terhadap call. Grafik di sebelah kanan memplot rasio put/call historis untuk instrumen ini.
Menggunakan Rasio Put/Call sebagai indikator sentimen investor mengatasi salah satu kekurangan utama dari penggunaan total kepemilikan institusional, yaitu sejumlah besar aset yang dikelola diinvestasikan secara pasif untuk melacak indeks. Dana yang dikelola secara pasif biasanya tidak membeli opsi, sehingga indikator rasio put/call lebih akurat dalam melacak sentimen dana yang dikelola secara aktif.
Pengajuan 13F dan NPORT
Detail pada pengajuan 13F tersedia gratis. Detail pada pengajuan NP memerlukan keanggotaan premium. Baris berwarna hijau menunjukkan posisi baru. Baris berwarna merah menunjukkan posisi yang sudah ditutup. Klik tautan ini ikon untuk melihat riwayat transaksi selengkapnya.
Tingkatkan
untuk membuka data premium dan mengekspor ke Excel ![]() .
.
| Tanggal File | Sumber | Investor | Ketik | Presyo ng Avg (Silangan) |
Saham | Δ Saham (%) |
Dilaporkan Nilai ($1000) |
Nilai Δ (%) |
Alokasi Port (%) |
|
|---|---|---|---|---|---|---|---|---|---|---|
| 2025-05-06 | 13F | VSM Wealth Advisory, LLC | 0 | -100.00 | 0 | |||||
| 2025-08-12 | 13F | Cornerstone Wealth Management, LLC | 4,223 | -2.47 | 612 | 26.50 | ||||
| 2025-07-28 | 13F | RFG Advisory, LLC | 3,806 | 2.62 | 552 | 33.09 | ||||
| 2025-08-08 | 13F | Smithfield Trust Co | 1,067 | 0.00 | 0 | |||||
| 2025-08-11 | 13F | Core Wealth Partners LLC | 0 | -100.00 | 0 | |||||
| 2025-08-14 | 13F | SWAN Capital LLC | 27 | 0.00 | 4 | 0.00 | ||||
| 2025-08-04 | 13F | Kovack Advisors, Inc. | 5,258 | -0.57 | 762 | 28.98 | ||||
| 2025-07-14 | 13F | GAMMA Investing LLC | 100 | 0.00 | 14 | 27.27 | ||||
| 2025-08-01 | 13F | Rossby Financial, LCC | 3 | 0.00 | 0 | |||||
| 2025-08-06 | 13F | Wedbush Securities Inc | 2,651 | 30.27 | 0 | |||||
| 2025-08-14 | 13F | Comerica Bank | 33 | 0.00 | 5 | 33.33 | ||||
| 2025-07-29 | 13F | Kraft, Davis & Associates, LLC | 5,933 | -8.96 | 893 | 27.07 | ||||
| 2025-04-23 | 13F | B.O.S.S. Retirement Advisors, LLC | 0 | -100.00 | 0 | -100.00 | ||||
| 2025-04-21 | 13F | ORG Partners LLC | 0 | -100.00 | 0 | |||||
| 2025-08-14 | 13F | Jane Street Group, Llc | 0 | -100.00 | 0 | |||||
| 2025-05-15 | 13F | FSA Wealth Management LLC | 0 | -100.00 | 0 | |||||
| 2025-07-09 | 13F | Triumph Capital Management | 2,089 | 303 | ||||||
| 2025-07-30 | 13F | Paul Damon & Associates, Inc. | 2,327 | 0.00 | 337 | 29.62 | ||||
| 2025-07-21 | 13F | Ntv Asset Management Llc | 23,961 | 297.36 | 3,472 | 415.90 | ||||
| 2025-04-23 | 13F | Continuum Advisory, LLC | 0 | -100.00 | 0 | -100.00 | ||||
| 2025-08-11 | 13F | Cannon Advisors, Inc. | 1,501 | 218 | ||||||
| 2025-08-14 | 13F | IHT Wealth Management, LLC | 6,834 | 0.03 | 990 | 29.75 | ||||
| 2025-07-22 | 13F | Legacy Trust | 0 | -100.00 | 0 | |||||
| 2025-07-17 | 13F | Janney Montgomery Scott LLC | 48,132 | 2.30 | 7 | 20.00 | ||||
| 2025-08-11 | 13F | Citigroup Inc | 758 | 0.00 | 110 | 29.76 | ||||
| 2025-05-15 | 13F | Banque Transatlantique SA | 0 | -100.00 | 0 | |||||
| 2025-07-24 | 13F | Trust Co Of Toledo Na /oh/ | 200 | 29 | ||||||
| 2025-09-04 | 13F/A | Advisor Group Holdings, Inc. | 30,441 | 10.37 | 4,409 | 43.02 | ||||
| 2025-08-06 | 13F | First Horizon Advisors, Inc. | 300 | 43 | ||||||
| 2025-08-12 | 13F | LPL Financial LLC | 470,048 | 20.49 | 68,115 | 56.26 | ||||
| 2025-08-04 | 13F | Pensionmark Financial Group, Llc | 2,337 | 0.00 | 339 | 29.50 | ||||
| 2025-08-08 | 13F | Pnc Financial Services Group, Inc. | 965 | -21.99 | 140 | 0.72 | ||||
| 2025-08-13 | 13F | VestGen Advisors, LLC | 5,681 | 12.07 | 823 | 45.41 | ||||
| 2025-04-25 | 13F | New Millennium Group LLC | 0 | -100.00 | 0 | |||||
| 2025-08-12 | 13F | Global Retirement Partners, LLC | 230 | -54.64 | 33 | -45.00 | ||||
| 2025-07-10 | 13F | Capital Advisory Group Advisory Services, LLC | 3,108 | 0.00 | 450 | 29.68 | ||||
| 2025-08-06 | 13F | Commonwealth Equity Services, Llc | 86,521 | -2.49 | 13 | 33.33 | ||||
| 2025-08-01 | 13F | Belvedere Trading LLC | Call | 1,500 | 217 | |||||
| 2025-08-12 | 13F | Steward Partners Investment Advisory, Llc | 11,626 | -14.15 | 1,685 | 11.30 | ||||
| 2025-07-15 | 13F | Cassia Capital Partners, LLC | 64,269 | -3.14 | 9,313 | 25.61 | ||||
| 2025-08-15 | 13F | Puff Wealth Management, Llc | 7,054 | 283.16 | 268 | 30.24 | ||||
| 2025-07-22 | 13F | Luken Investment Analytics, LLC | 565 | 0.00 | 82 | 28.57 | ||||
| 2025-07-29 | 13F | Signature Estate & Investment Advisors Llc | 11,556 | -1.97 | 1,675 | 27.11 | ||||
| 2025-08-12 | 13F | SRS Capital Advisors, Inc. | 4,240 | -5.90 | 614 | 22.07 | ||||
| 2025-08-12 | 13F | Insigneo Advisory Services, Llc | 1,577 | 229 | ||||||
| 2025-08-14 | 13F | Mariner, LLC | 17,029 | -10.37 | 2,468 | 16.20 | ||||
| 2025-07-21 | 13F | Ameritas Advisory Services, LLC | 6,747 | 978 | ||||||
| 2025-05-15 | 13F | Citadel Advisors Llc | 0 | -100.00 | 0 | |||||
| 2025-07-23 | 13F | Integris Wealth Management, LLC | 1,772 | 257 | ||||||
| 2025-07-17 | 13F | City Holding Co | 900 | 0.00 | 130 | 30.00 | ||||
| 2025-08-11 | 13F | October Effect Ltd | 2,736 | 396 | ||||||
| 2025-05-01 | 13F | Quest 10 Wealth Builders, Inc. | 0 | -100.00 | 0 | |||||
| 2025-05-05 | 13F | Transce3nd, LLC | 0 | -100.00 | 0 | |||||
| 2025-07-17 | 13F | Wolff Wiese Magana Llc | 8 | 0.00 | 1 | |||||
| 2025-08-08 | 13F | Wiser Advisor Group LLC | 0 | -100.00 | 0 | |||||
| 2025-05-29 | 13F | Apeiron RIA LLC | 0 | -100.00 | 0 | |||||
| 2025-08-13 | 13F | Northwestern Mutual Wealth Management Co | 1,044 | 36.29 | 151 | 77.65 | ||||
| 2025-08-01 | 13F | Envestnet Asset Management Inc | 45,506 | -38.50 | 6,594 | -20.24 | ||||
| 2025-08-05 | 13F | GPS Wealth Strategies Group, LLC | 384 | 0.00 | 56 | 30.95 | ||||
| 2025-08-12 | 13F | Calton & Associates, Inc. | 13,503 | -7.85 | 1,957 | 19.49 | ||||
| 2025-08-08 | 13F | Intrua Financial, LLC | 2,271 | -1.09 | 329 | 28.52 | ||||
| 2025-08-11 | 13F | Western Wealth Management, LLC | 20,569 | -1.41 | 2,981 | 27.84 | ||||
| 2025-08-19 | 13F | Newbridge Financial Services Group, Inc. | 150 | 22 | ||||||
| 2025-08-14 | 13F | Royal Bank Of Canada | 46,696 | -9.04 | 6,766 | 17.96 | ||||
| 2025-08-11 | 13F/A | Purus Wealth Management, LLC | 2,117 | 0.00 | 307 | 29.66 | ||||
| 2025-05-09 | 13F | GeoWealth Management, LLC | 0 | -100.00 | 0 | |||||
| 2025-08-19 | 13F | Advisory Services Network, LLC | 6,076 | -5.75 | 925 | 28.33 | ||||
| 2025-08-13 | 13F | Smith, Moore & Co. | 2,637 | -5.11 | 382 | 23.23 | ||||
| 2025-07-09 | 13F | Clarus Wealth Advisors | 1,474 | 211 | ||||||
| 2025-08-14 | 13F | Fmr Llc | 3,552 | 3.35 | 515 | 33.85 | ||||
| 2025-08-06 | 13F | AE Wealth Management LLC | 7,809 | 196.58 | 1,132 | 284.69 | ||||
| 2025-04-17 | 13F | Sound Income Strategies, LLC | 0 | -100.00 | 0 | |||||
| 2025-08-05 | 13F | Simplex Trading, Llc | 71 | 0 | ||||||
| 2025-08-08 | 13F | Larson Financial Group LLC | 367 | 53 | ||||||
| 2025-08-15 | 13F | Kestra Advisory Services, LLC | 22,103 | 18.01 | 3,203 | 53.06 | ||||
| 2025-08-05 | 13F | Carolinas Wealth Consulting Llc | 0 | -100.00 | 0 | -100.00 | ||||
| 2025-08-14 | 13F | Stifel Financial Corp | 8,464 | 6.94 | 1,227 | 38.69 | ||||
| 2025-08-14 | 13F | CIBC World Markets Inc. | 2,413 | 0.00 | 350 | 29.74 | ||||
| 2025-07-25 | 13F | Cascade Investment Advisors, Inc. | 6,791 | 0.30 | 984 | 30.16 | ||||
| 2025-08-04 | 13F | Spire Wealth Management | 638 | 0.00 | 92 | 29.58 | ||||
| 2025-05-15 | 13F | Pinnacle Family Advisors, LLC | 0 | -100.00 | 0 | |||||
| 2025-05-15 | 13F | Two Sigma Securities, Llc | 0 | -100.00 | 0 | -100.00 | ||||
| 2025-08-14 | 13F | GWM Advisors LLC | 42,669 | 387.92 | 6,183 | 532.86 | ||||
| 2025-07-31 | 13F | Richards, Merrill & Peterson, Inc. | 0 | -100.00 | 0 | |||||
| 2025-07-29 | 13F | Cottonwood Capital Advisors, Llc | 2,351 | 0.00 | 341 | 29.77 | ||||
| 2025-07-28 | 13F | Smart Portfolios, LLC | 2,120 | -0.70 | 307 | 28.99 | ||||
| 2025-08-13 | 13F | Cresset Asset Management, LLC | 2,844 | 0.00 | 412 | 29.97 | ||||
| 2025-08-14 | 13F | Snowden Capital Advisors LLC | 1,916 | -9.71 | 278 | 16.88 | ||||
| 2025-08-07 | 13F | Allworth Financial LP | 2,749 | 0.00 | 398 | 24.76 | ||||
| 2025-07-29 | 13F | Stratos Wealth Partners, LTD. | 2,972 | -10.32 | 431 | 16.22 | ||||
| 2025-07-17 | 13F | Eclectic Associates Inc /adv | 10,977 | -13.48 | 1,590 | 12.14 | ||||
| 2025-05-06 | 13F | Alpha Omega Group, Inc. | 0 | -100.00 | 0 | |||||
| 2025-07-31 | 13F | Cambridge Investment Research Advisors, Inc. | 60,332 | 2.44 | 9 | 33.33 | ||||
| 2025-08-08 | 13F | SBI Securities Co., Ltd. | 75 | 1.35 | 11 | 25.00 | ||||
| 2025-07-25 | 13F | Hazlett, Burt & Watson, Inc. | 227 | 238.81 | 0 | |||||
| 2025-08-13 | 13F | Kayne Anderson Rudnick Investment Management Llc | 2,050 | 0.00 | 297 | 29.26 | ||||
| 2025-07-31 | 13F | Oppenheimer & Co Inc | 2,072 | 0.00 | 300 | 29.87 | ||||
| 2025-08-05 | 13F | Sigma Planning Corp | 4,738 | 687 | ||||||
| 2025-08-15 | 13F | Captrust Financial Advisors | 7,953 | 103.04 | 1,153 | 163.62 | ||||
| 2025-08-12 | 13F | Country Trust Bank | 27 | 0.00 | 4 | 0.00 | ||||
| 2025-07-21 | 13F | Keystone Financial Group, Inc. | 18 | -28.00 | 3 | -33.33 | ||||
| 2025-08-12 | 13F | O'shaughnessy Asset Management, Llc | 236 | -6.72 | 34 | 21.43 | ||||
| 2025-08-12 | 13F | Jpmorgan Chase & Co | 1 | -99.98 | 0 | -100.00 | ||||
| 2025-08-11 | 13F | Hexagon Capital Partners LLC | 0 | -100.00 | 0 | |||||
| 2025-08-18 | 13F | Tyler-Stone Wealth Management | 2,973 | 0.03 | 431 | 29.52 | ||||
| 2025-07-23 | 13F | Indiana Trust & Investment Management CO | 99 | 0.00 | 14 | 27.27 | ||||
| 2025-08-14 | 13F | Hrt Financial Lp | 7,082 | 231.09 | 1 | |||||
| 2025-07-10 | 13F | Kozak & Associates, Inc. | 63 | 0.00 | 9 | 50.00 | ||||
| 2025-08-13 | 13F | Twin Peaks Wealth Advisors, LLC | 37,326 | -3.72 | 5,802 | 35.22 | ||||
| 2025-07-08 | 13F | Nbc Securities, Inc. | 3,265 | 172.31 | 0 | |||||
| 2025-07-11 | 13F | Kapstone Financial Advisors LLC | 1,616 | 234 | ||||||
| 2025-07-28 | 13F | Harbour Investments, Inc. | 28,684 | 1.02 | 4,157 | 31.02 | ||||
| 2025-07-22 | 13F | Accel Wealth Management | 1,698 | 246 | ||||||
| 2025-08-04 | 13F | Atria Investments Llc | 11,927 | -8.82 | 1,728 | 18.28 | ||||
| 2025-08-08 | 13F | Creative Planning | 7,363 | 4.54 | 1,067 | 35.45 | ||||
| 2025-08-14 | 13F | UBS Group AG | 46,057 | -22.26 | 6,674 | 0.82 | ||||
| 2025-08-08 | 13F | Cetera Investment Advisers | 88,347 | -10.42 | 12,802 | 16.18 | ||||
| 2025-08-12 | 13F | Jaffetilchin Investment Partners, LLC | 4,091 | 0.02 | 593 | 29.54 | ||||
| 2025-08-04 | 13F | Integrity Alliance, Llc. | 2,836 | -73.04 | 411 | -65.11 | ||||
| 2025-08-07 | 13F | Commerce Bank | 2,200 | 0.00 | 319 | 29.80 | ||||
| 2025-07-29 | 13F | Private Trust Co Na | 544 | 4.41 | 79 | 34.48 | ||||
| 2025-08-14 | 13F | CoreCap Advisors, LLC | 192 | 0.00 | 28 | 28.57 | ||||
| 2025-04-24 | 13F | Decker Retirement Planning Inc. | 0 | -100.00 | 0 | |||||
| 2025-08-15 | 13F | Tower Research Capital LLC (TRC) | 1 | 0.00 | 0 | |||||
| 2025-07-22 | 13F | Appleton Partners Inc/ma | 1,716 | 0 | ||||||
| 2025-08-15 | 13F | CI Private Wealth, LLC | 2,786 | 7.98 | 404 | 39.93 | ||||
| 2025-07-30 | 13F | Pacific Sun Financial Corp | 8,049 | 0.00 | 1,166 | 29.70 | ||||
| 2025-08-14 | 13F | Prestige Wealth Management Group LLC | 177 | 0.00 | 26 | 31.58 | ||||
| 2025-05-14 | 13F | Flow Traders U.s. Llc | 0 | -100.00 | 0 | |||||
| 2025-07-23 | 13F | Morey & Quinn Wealth Partners, LLC | 4,159 | -10.69 | 603 | 15.77 | ||||
| 2025-07-18 | 13F | Truist Financial Corp | 31,752 | -46.61 | 4,601 | -30.76 | ||||
| 2025-08-14 | 13F | Wells Fargo & Company/mn | 313,831 | 9.35 | 45,477 | 41.81 | ||||
| 2025-08-12 | 13F | Putnam Fl Investment Management Co | 1,642 | 238 | ||||||
| 2025-08-14 | 13F | Ancora Advisors, LLC | 7,813 | 0.00 | 1,132 | 29.67 | ||||
| 2025-07-29 | 13F | Chicago Partners Investment Group LLC | 19,207 | -1.22 | 2,874 | 20.00 | ||||
| 2025-07-15 | 13F | tru Independence LLC | 1,424 | 206 | ||||||
| 2025-08-06 | 13F | Golden State Wealth Management, LLC | 19,380 | -7.94 | 2,808 | 19.39 | ||||
| 2025-07-30 | 13F | D.a. Davidson & Co. | 26,357 | -8.00 | 3,820 | 19.31 | ||||
| 2025-08-13 | 13F | Proactive Wealth Strategies LLC | 20,231 | -6.92 | 3 | 0.00 | ||||
| 2025-04-14 | 13F | Lloyd Advisory Services, LLC. | 0 | -100.00 | 0 | |||||
| 2025-07-24 | 13F | IFP Advisors, Inc | 355 | 0.00 | 51 | 30.77 | ||||
| 2025-08-13 | 13F | Bernardo Wealth Planning LLC | 0 | -100.00 | 0 | |||||
| 2025-08-14 | 13F | Raymond James Financial Inc | 145,503 | 19.54 | 21,085 | 55.03 | ||||
| 2025-08-14 | 13F | Beaird Harris Wealth Management, LLC | 274 | 0.00 | 40 | 30.00 | ||||
| 2025-07-24 | 13F | Blair William & Co/il | 440 | -72.12 | 64 | -64.20 | ||||
| 2025-08-14 | 13F/A | Perritt Capital Management Inc | 0 | -100.00 | 0 | -100.00 | ||||
| 2025-07-28 | 13F | Rosenberg Matthew Hamilton | 86 | 0.00 | 12 | 33.33 | ||||
| 2025-07-30 | 13F | Patten Group, Inc. | 3,011 | -4.87 | 436 | 23.51 | ||||
| 2025-08-08 | 13F | Avantax Advisory Services, Inc. | 2,279 | -12.65 | 330 | 13.40 | ||||
| 2025-08-07 | 13F | Brio Consultants, LLC | 0 | -100.00 | 0 | -100.00 | ||||
| 2025-08-13 | 13F | Capital Analysts, Inc. | 70 | 0.00 | 0 | |||||
| 2025-08-04 | 13F | IFG Advisory, LLC | 8,263 | 42.34 | 1,197 | 84.72 | ||||
| 2025-08-12 | 13F | Spectrum Wealth Advisory Group, LLC | 11,684 | -0.49 | 1,693 | 29.04 | ||||
| 2025-08-14 | 13F | Financial Engines Advisors L.L.C. | 1,783 | 258 | ||||||
| 2025-07-24 | 13F | Costello Asset Management, INC | 543 | 0.00 | 79 | 30.00 | ||||
| 2025-07-30 | 13F | Onyx Bridge Wealth Group LLC | 16,047 | -0.11 | 2,325 | 29.53 | ||||
| 2025-07-15 | 13F | FLP Wealth Management, LLC | 0 | -100.00 | 0 | |||||
| 2025-04-23 | 13F | Atala Financial Inc | 0 | -100.00 | 0 | |||||
| 2025-08-14 | 13F | Susquehanna International Group, Llp | 29,188 | 103.40 | 4,230 | 163.82 | ||||
| 2025-04-17 | 13F | Grove Bank & Trust | 0 | -100.00 | 0 | |||||
| 2025-07-15 | 13F | Mather Group, Llc. | 0 | -100.00 | 0 | |||||
| 2025-08-07 | 13F | PCG Wealth Advisors, LLC | 7,995 | -1.32 | 1,159 | 27.96 | ||||
| 2025-08-05 | 13F | Bank of New York Mellon Corp | 2,060 | -0.05 | 299 | 29.57 | ||||
| 2025-08-14 | 13F | Benjamin Edwards Inc | 4,653 | 3.03 | 674 | 33.73 | ||||
| 2025-08-19 | 13F | National Asset Management, Inc. | 1,930 | -38.52 | 280 | -25.60 | ||||
| 2025-07-10 | 13F | Wealth Enhancement Advisory Services, Llc | 26,087 | -1.63 | 3,753 | 26.63 | ||||
| 2025-07-23 | 13F | Tcfg Wealth Management, Llc | 3,472 | -2.44 | 503 | 26.70 | ||||
| 2025-08-14 | 13F | Moneta Group Investment Advisors Llc | 1,403 | 203 | ||||||
| 2025-07-28 | 13F | BRYN MAWR TRUST Co | 350 | 0.00 | 51 | 28.21 | ||||
| 2025-08-14 | 13F | Goldman Sachs Group Inc | 0 | -100.00 | 0 | |||||
| 2025-08-18 | 13F | Hershey Financial Advisers, LLC | 3,082 | 447 | ||||||
| 2025-08-14 | 13F | Mml Investors Services, Llc | 7,949 | 64.07 | 1 | |||||
| 2025-08-14 | 13F | Two Sigma Investments, Lp | 4,070 | 590 | ||||||
| 2025-08-08 | 13F | Accredited Investors Inc. | 2,649 | 0.00 | 384 | 29.83 | ||||
| 2025-07-25 | 13F | Cwm, Llc | 2,189 | -0.36 | 0 | |||||
| 2025-05-12 | 13F | Sandy Spring Bank | 400 | 0.00 | 45 | -6.38 | ||||
| 2025-08-13 | 13F | StoneX Group Inc. | 2,308 | -10.99 | 334 | 15.57 | ||||
| 2025-05-07 | 13F | Bellwether Advisors, LLC | 0 | -100.00 | 0 | |||||
| 2025-05-12 | 13F | Independent Advisor Alliance | 0 | -100.00 | 0 | |||||
| 2025-08-04 | 13F | Impact Partnership Wealth, LLC | 7,030 | -36.95 | 1,019 | -18.23 | ||||
| 2025-08-12 | 13F | Concentrum Wealth Management | 5,507 | 0.00 | 798 | 29.76 | ||||
| 2025-08-04 | 13F | Assetmark, Inc | 410 | -14.41 | 59 | 11.32 | ||||
| 2025-08-12 | 13F | Ameritas Investment Partners, Inc. | 95 | 0.00 | 14 | 30.00 | ||||
| 2025-08-14 | 13F | Ameriprise Financial Inc | 36,558 | -9.56 | 5,299 | 16.62 | ||||
| 2025-08-14 | 13F | Money Concepts Capital Corp | 2,395 | 0.00 | 347 | 29.96 | ||||
| 2025-08-14 | 13F | Bnp Paribas Arbitrage, Sa | 0 | -100.00 | 0 | |||||
| 2025-07-07 | 13F | Investors Research Corp | 6,100 | 0.00 | 884 | 29.66 | ||||
| 2025-08-12 | 13F | Proequities, Inc. | 0 | 0 | ||||||
| 2025-04-21 | 13F | Ronald Blue Trust, Inc. | 0 | -100.00 | 0 | |||||
| 2025-07-07 | 13F | Global Wealth Strategies & Associates | 1 | 0.00 | 0 | |||||
| 2025-08-08 | 13F | Comprehensive Financial Planning, Inc./PA | 6,849 | 993 | ||||||
| 2025-07-11 | 13F | Farther Finance Advisors, LLC | 831 | 0.00 | 120 | 27.66 | ||||
| 2025-07-21 | 13F | DHJJ Financial Advisors, Ltd. | 6 | 0.00 | 1 | |||||
| 2025-08-07 | 13F | Midwest Trust Co | 1,427 | 207 | ||||||
| 2025-08-14 | 13F | Colony Group, LLC | 4,215 | 4.98 | 611 | 36.16 | ||||
| 2025-08-05 | 13F | Arrowroot Family Office, LLC | 1,855 | 0.00 | 269 | 21.27 | ||||
| 2025-08-13 | 13F | Baird Financial Group, Inc. | 10,457 | 6.35 | 1,515 | 37.98 | ||||
| 2025-08-06 | 13F | Prospera Financial Services Inc | 5,062 | 3.14 | 734 | 33.70 | ||||
| 2025-07-07 | 13F | RDA Financial Network | 5,237 | 0.00 | 759 | 29.57 | ||||
| 2025-08-14 | 13F | Bank Of America Corp /de/ | 113,370 | -18.29 | 16,428 | 5.97 | ||||
| 2025-08-14 | 13F | Diversify Advisory Services, LLC | 0 | -100.00 | 0 | |||||
| 2025-08-11 | 13F | Principal Securities, Inc. | 216 | -33.13 | 31 | -18.42 | ||||
| 2025-04-21 | 13F | Envestnet Portfolio Solutions, Inc. | 0 | -100.00 | 0 | |||||
| 2025-07-18 | 13F | Pure Financial Advisors, Inc. | 2,580 | 2.79 | 374 | 33.21 | ||||
| 2025-08-07 | 13F | Private Advisory Group LLC | 0 | -100.00 | 0 | |||||
| 2025-08-14 | 13F | Synovus Financial Corp | 2,003 | 0.00 | 290 | 30.04 | ||||
| 2025-05-14 | 13F | Caitlin John, LLC | 0 | -100.00 | 0 | |||||
| 2025-08-13 | 13F | Congress Wealth Management LLC / DE / | 98,905 | 0.27 | 14,332 | 30.01 | ||||
| 2025-08-15 | 13F | Equitable Holdings, Inc. | 2,567 | -4.93 | 372 | 23.26 | ||||
| 2025-08-06 | 13F | Atlantic Union Bankshares Corp | 400 | 58 | ||||||
| 2025-08-15 | 13F | Morgan Stanley | 580,027 | -1.28 | 84,052 | 28.03 | ||||
| 2025-08-11 | 13F | HighTower Advisors, LLC | 27,945 | -1.16 | 4,049 | 28.17 | ||||
| 2025-08-05 | 13F | Atlas Private Wealth Advisors | 5,469 | -1.92 | 792 | 27.13 | ||||
| 2025-08-05 | 13F | Bank Of Montreal /can/ | 950 | 0.00 | 138 | 29.25 | ||||
| 2025-07-25 | 13F | Concurrent Investment Advisors, LLC | 5,681 | 13.87 | 823 | 47.76 | ||||
| 2025-08-12 | 13F | MAI Capital Management | 70 | -14.63 | 10 | 11.11 | ||||
| 2025-05-13 | 13F | EverSource Wealth Advisors, LLC | 0 | -100.00 | 0 | |||||
| 2025-07-09 | 13F | Dynamic Advisor Solutions LLC | 1,412 | 205 | ||||||
| 2025-07-15 | 13F | BKA Wealth Consulting, Inc. | 3,538 | 0.74 | 513 | 30.61 | ||||
| 2025-08-08 | 13F | Good Life Advisors, LLC | 17,642 | -22.32 | 2,556 | 0.75 | ||||
| 2025-04-30 | 13F | Pineridge Advisors LLC | 0 | -100.00 | 0 | |||||
| 2025-08-11 | 13F | Private Advisor Group, LLC | 15,829 | 0.44 | 2,294 | 30.28 | ||||
| 2025-04-23 | 13F | Valmark Advisers, Inc. | 0 | -100.00 | 0 | |||||
| 2025-05-09 | 13F | Pathway Financial Advisers, LLC | 0 | -100.00 | 0 |
Other Listings
| MX:FPX |