Mga Batayang Estadistika
| Pemilik Institusional | 199 total, 196 long only, 2 short only, 1 long/short - change of 15.70% MRQ |
| Alokasi Portofolio Rata-rata | 0.6731 % - change of 70.12% MRQ |
| Saham Institusional (Jangka Panjang) | 26,734,108 (ex 13D/G) - change of 7.21MM shares 36.92% MRQ |
| Nilai Institusional (Jangka Panjang) | $ 685,383 USD ($1000) |
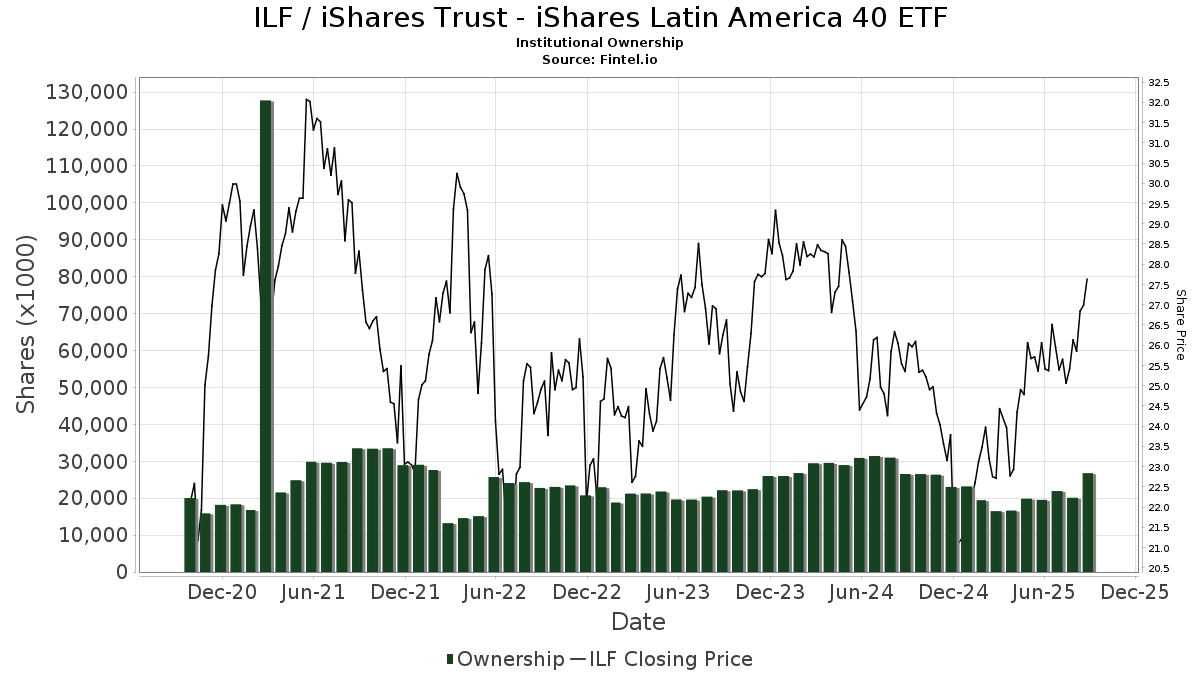
Kepemilikan Institusional dan Pemegang Saham
iShares Trust - iShares Latin America 40 ETF (US:ILF) memiliki 199 pemilik institusional dan pemegang saham yang telah mengajukan formulir 13D/G atau 13F kepada Komisi Bursa Efek (Securities Exchange Commission/SEC). Lembaga-lembaga ini memegang total 26,735,955 saham. Pemegang saham terbesar meliputi Morgan Stanley, Assetmark, Inc, FIL Ltd, CLSM - Cabana Target Leading Sector Moderate ETF, New Harbor Financial Group, LLC, TDSC - Cabana Target Drawdown 10 ETF, Wells Fargo & Company/mn, Exchange Traded Concepts, Llc, IYLD - iShares Morningstar Multi-Asset Income ETF, and Osborne Partners Capital Management, Llc .
Struktur kepemilikan institusional iShares Trust - iShares Latin America 40 ETF (ARCA:ILF) menunjukkan posisi terkini di perusahaan oleh institusi dan dana, serta perubahan terbaru dalam ukuran posisi. Pemegang saham utama dapat mencakup investor individu, reksa dana, dana lindung nilai, atau institusi. Jadwal 13D menunjukkan bahwa investor memegang (atau pernah memegang) lebih dari 5% saham perusahaan dan bermaksud (atau pernah bermaksud) untuk secara aktif mengejar perubahan strategi bisnis. Jadwal 13G menunjukkan investasi pasif lebih dari 5%.
The share price as of September 5, 2025 is 27.36 / share. Previously, on September 9, 2024, the share price was 25.38 / share. This represents an increase of 7.80% over that period.
Skor Sentimen Dana
Skor Sentimen Dana (sebelumnya dikenal sebagai Skor Akumulasi Kepemilikan) menemukan saham-saham yang paling banyak dibeli oleh dana. Ini adalah hasil dari model kuantitatif multi-faktor yang canggih yang mengidentifikasi perusahaan dengan tingkat akumulasi institusional tertinggi. Model penilaian menggunakan kombinasi dari total peningkatan pemilik yang diungkapkan, perubahan dalam alokasi portofolio pada pemilik tersebut, dan metrik lainnya. Angka berkisar dari 0 hingga 100, dengan angka yang lebih tinggi menunjukkan tingkat akumulasi yang lebih tinggi dibandingkan dengan perusahaan sejenisnya, dan 50 adalah rata-ratanya.
Frekuensi Pembaruan: Setiap Hari
Lihat Ownership Explorer, yang menyediakan daftar perusahaan dengan peringkat tertinggi.
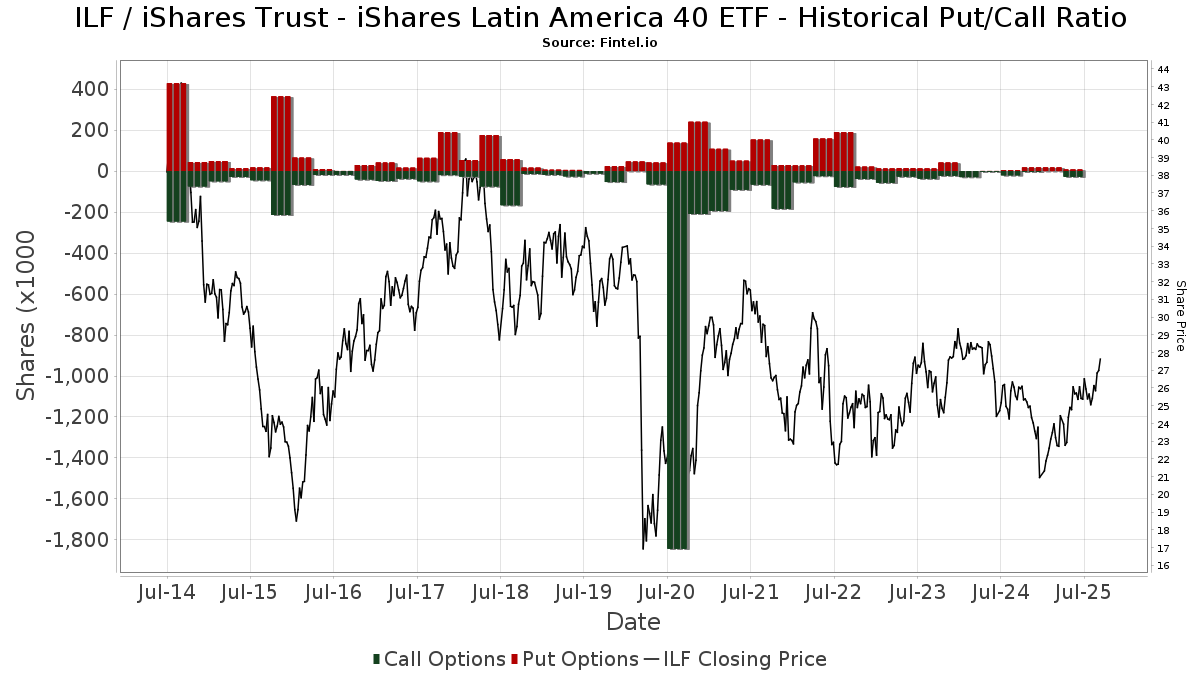
Rasio Put/Call Institusional
Selain melaporkan isu ekuitas dan utang standar, institusi dengan aset di bawah manajemen lebih dari 100 juta dolar AS juga harus mengungkapkan kepemilikan opsi put dan call mereka. Karena opsi put umumnya menunjukkan sentimen negatif, dan opsi call menunjukkan sentimen positif, kita dapat mengetahui sentimen institusional secara keseluruhan dengan memplot rasio put terhadap call. Grafik di sebelah kanan memplot rasio put/call historis untuk instrumen ini.
Menggunakan Rasio Put/Call sebagai indikator sentimen investor mengatasi salah satu kekurangan utama dari penggunaan total kepemilikan institusional, yaitu sejumlah besar aset yang dikelola diinvestasikan secara pasif untuk melacak indeks. Dana yang dikelola secara pasif biasanya tidak membeli opsi, sehingga indikator rasio put/call lebih akurat dalam melacak sentimen dana yang dikelola secara aktif.
Pengajuan 13F dan NPORT
Detail pada pengajuan 13F tersedia gratis. Detail pada pengajuan NP memerlukan keanggotaan premium. Baris berwarna hijau menunjukkan posisi baru. Baris berwarna merah menunjukkan posisi yang sudah ditutup. Klik tautan ini ikon untuk melihat riwayat transaksi selengkapnya.
Tingkatkan
untuk membuka data premium dan mengekspor ke Excel ![]() .
.
| Tanggal File | Sumber | Investor | Ketik | Presyo ng Avg (Silangan) |
Saham | Δ Saham (%) |
Dilaporkan Nilai ($1000) |
Nilai Δ (%) |
Alokasi Port (%) |
|
|---|---|---|---|---|---|---|---|---|---|---|
| 2025-08-14 | 13F/A | Skopos Labs, Inc. | 11,400 | 290 | ||||||
| 2025-08-14 | 13F | UBS Group AG | 180,622 | -21.39 | 4,734 | -12.50 | ||||
| 2025-07-21 | 13F | Synergy Financial Management, LLC | 16,503 | -24.92 | 433 | -16.44 | ||||
| 2025-05-08 | 13F | Us Bancorp \de\ | 0 | -100.00 | 0 | |||||
| 2025-08-14 | 13F | GWM Advisors LLC | 8,636 | 0.00 | 226 | 11.33 | ||||
| 2025-08-28 | NP | SIRAX - Sierra Tactical All Asset Fund Class A | 183,700 | 4,815 | ||||||
| 2025-08-07 | 13F | David R. Rahn & Associates Inc. | 331,765 | 8,696 | ||||||
| 2025-08-11 | 13F | Rahlfs Capital, Llc | 15,250 | 0.00 | 400 | 11.14 | ||||
| 2025-08-14 | 13F | D. E. Shaw & Co., Inc. | 58,650 | 1,537 | ||||||
| 2025-08-12 | 13F | Proequities, Inc. | 0 | 0 | ||||||
| 2025-07-31 | 13F | Carrera Capital Advisors | 340,904 | 341.70 | 8,935 | 391.74 | ||||
| 2025-04-30 | 13F | Ramiah Investment Group | 0 | -100.00 | 0 | |||||
| 2025-08-14 | 13F | Hilltop Holdings Inc. | 20,799 | 545 | ||||||
| 2025-08-14 | 13F | Ameriprise Financial Inc | 556,505 | 31.31 | 14,587 | 46.16 | ||||
| 2025-08-13 | 13F | EverSource Wealth Advisors, LLC | 796 | 0.00 | 21 | 11.11 | ||||
| 2025-04-29 | 13F | Element Wealth, LLC | 0 | -100.00 | 0 | |||||
| 2025-07-30 | 13F | Eqis Capital Management, Inc. | 8,025 | 210 | ||||||
| 2025-08-05 | 13F | Bank Of Montreal /can/ | 150 | 0.00 | 4 | 0.00 | ||||
| 2025-08-26 | 13F/A | Thrivent Financial For Lutherans | 0 | -100.00 | 0 | -100.00 | ||||
| 2025-08-01 | 13F | Envestnet Asset Management Inc | 398,411 | -46.53 | 10,442 | -40.49 | ||||
| 2025-08-27 | NP | RYMSX - Guggenheim Multi-Hedge Strategies Fund Class P | Short | -690 | -49.49 | -18 | -43.75 | |||
| 2025-08-13 | 13F | Provida Pension Fund Administrator | 0 | -100.00 | 0 | -100.00 | ||||
| 2025-08-14 | 13F | DZ BANK AG Deutsche Zentral Genossenschafts Bank, Frankfurt am Main | 377,439 | 9,893 | ||||||
| 2025-08-14 | 13F | Tudor Investment Corp Et Al | 58,295 | 1,528 | ||||||
| 2025-08-18 | 13F | Geneos Wealth Management Inc. | 7,792 | 0.00 | 204 | 11.48 | ||||
| 2025-05-09 | 13F | Headlands Technologies LLC | 0 | -100.00 | 0 | |||||
| 2025-08-15 | 13F | Great West Life Assurance Co /can/ | 71,247 | 1.48 | 2 | 0.00 | ||||
| 2025-07-09 | 13F | Massmutual Trust Co Fsb/adv | 49,131 | 17.15 | 1,288 | 30.40 | ||||
| 2025-07-10 | 13F | Exchange Traded Concepts, Llc | 844,802 | -69.85 | 22,142 | -66.44 | ||||
| 2025-08-01 | 13F | Biltmore Family Office, LLC | 1,200 | 146.91 | 31 | 181.82 | ||||
| 2025-08-13 | 13F | Flow Traders U.s. Llc | 10,888 | 0 | ||||||
| 2025-04-17 | 13F | Access Financial Services, Inc. | 0 | -100.00 | 0 | |||||
| 2025-08-11 | 13F | Aptus Capital Advisors, LLC | 450 | 0.00 | 12 | 10.00 | ||||
| 2025-08-14 | 13F | CoreCap Advisors, LLC | 0 | -100.00 | 0 | |||||
| 2025-08-14 | 13F | Wells Fargo & Company/mn | 915,291 | 871.03 | 23,990 | 981.07 | ||||
| 2025-08-08 | 13F | SBI Securities Co., Ltd. | 6,624 | 48.19 | 174 | 64.76 | ||||
| 2025-08-12 | 13F | OneAscent Financial Services LLC | 10,989 | 13.15 | 0 | |||||
| 2025-06-23 | NP | IYLD - iShares Morningstar Multi-Asset Income ETF | 743,179 | 18.96 | 18,505 | 29.02 | ||||
| 2025-07-31 | 13F | Glass Jacobson Investment Advisors llc | 0 | -100.00 | 0 | |||||
| 2025-07-01 | 13F | Stonehearth Capital Management, LLC | 242,966 | 6,368 | ||||||
| 2025-08-06 | 13F | Legacy Bridge, LLC | 1,298 | 0.00 | 34 | 13.33 | ||||
| 2025-08-05 | 13F | Alexander Randolph Advisory Inc | 11,442 | 0.00 | 300 | 11.15 | ||||
| 2025-08-14 | 13F | Glenmede Investment Management, LP | 500 | 13 | ||||||
| 2025-07-28 | 13F | Harbour Investments, Inc. | 606 | 0.00 | 16 | 7.14 | ||||
| 2025-08-11 | 13F | First American Trust, Fsb | 292,360 | 7,663 | ||||||
| 2025-08-12 | 13F | SRS Capital Advisors, Inc. | 448 | 12 | ||||||
| 2025-07-17 | 13F | Janney Montgomery Scott LLC | 13,533 | -18.88 | 0 | |||||
| 2025-07-24 | 13F | Lmcg Investments, Llc | 285,324 | -1.92 | 7,478 | 9.15 | ||||
| 2025-08-12 | 13F | Park Square Financial Group, LLC | 73 | 0.00 | 2 | 0.00 | ||||
| 2025-08-27 | 13F/A | Putney Financial Group LLC | 160 | 0.00 | 4 | 33.33 | ||||
| 2025-08-14 | 13F | Moneda S.A. Administradora General de Fondos | 69,518 | -1.41 | 1,822 | 9.76 | ||||
| 2025-07-01 | 13F | Kera Capital Partners, Inc. | 267,453 | 4.41 | 7,010 | 16.20 | ||||
| 2025-08-12 | 13F | O'shaughnessy Asset Management, Llc | 3 | 0.00 | 0 | |||||
| 2025-07-25 | 13F | Envestnet Portfolio Solutions, Inc. | 20,648 | -48.22 | 541 | -42.39 | ||||
| 2025-08-12 | 13F | Boreal Capital Management LLC | 120 | 3 | ||||||
| 2025-08-12 | 13F | Franklin Resources Inc | 137 | 4 | ||||||
| 2025-07-29 | 13F | Yoffe Investment Management, LLC | 37,099 | 0.25 | 972 | 11.60 | ||||
| 2025-09-04 | 13F/A | Advisor Group Holdings, Inc. | 43,461 | -79.18 | 1,139 | -76.85 | ||||
| 2025-07-28 | 13F | Copia Wealth Management | 12,598 | -2.63 | 330 | 8.55 | ||||
| 2025-07-16 | 13F | Banque Pictet & Cie Sa | 270,000 | 0.00 | 7,077 | 11.29 | ||||
| 2025-08-06 | 13F | Commonwealth Equity Services, Llc | 36,901 | -92.22 | 1 | -100.00 | ||||
| 2025-08-12 | 13F | Prudential Financial Inc | 26,500 | 695 | ||||||
| 2025-07-18 | 13F | PFG Investments, LLC | 0 | -100.00 | 0 | |||||
| 2025-08-14 | 13F | Stifel Financial Corp | 24,104 | -1.39 | 632 | 9.74 | ||||
| 2025-05-16 | 13F | Strait & Sound Wealth Management LLC | 0 | -100.00 | 0 | |||||
| 2025-07-14 | 13F | Park Avenue Securities Llc | 19,040 | -21.72 | 0 | |||||
| 2025-08-14 | 13F | Blue Capital, Inc. | 0 | -100.00 | 0 | |||||
| 2025-08-06 | 13F | Pekin Hardy Strauss, Inc. | 35,712 | -1.84 | 936 | 9.35 | ||||
| 2025-07-10 | 13F | Redhawk Wealth Advisors, Inc. | 83,422 | 2,186 | ||||||
| 2025-08-13 | 13F | BCJ Capital Management, LLC | 50,691 | -13.15 | 1,329 | -3.35 | ||||
| 2025-07-22 | 13F | Merit Financial Group, LLC | 26,762 | -24.38 | 701 | -15.85 | ||||
| 2025-05-15 | 13F | Qube Research & Technologies Ltd | 0 | -100.00 | 0 | |||||
| 2025-08-01 | 13F | Y-Intercept (Hong Kong) Ltd | 24,399 | 639 | ||||||
| 2025-08-14 | 13F | Quantinno Capital Management LP | 89,059 | 32.72 | 2,334 | 47.72 | ||||
| 2025-08-14 | 13F | DRW Securities, LLC | 96,038 | 2,517 | ||||||
| 2025-08-06 | 13F | Prospera Financial Services Inc | 76,776 | 2,012 | ||||||
| 2025-08-06 | 13F | Nicholas Hoffman & Company, LLC. | 8,968 | -9.18 | 235 | 1.29 | ||||
| 2025-06-26 | NP | CLSM - Cabana Target Leading Sector Moderate ETF | 1,431,782 | 35,651 | ||||||
| 2025-08-12 | 13F | Osborne Partners Capital Management, Llc | 677,661 | 4.84 | 17,762 | 16.69 | ||||
| 2025-08-13 | 13F | Hudson Portfolio Management LLC | 8,105 | 212 | ||||||
| 2025-08-13 | 13F | Northwestern Mutual Wealth Management Co | 27,251 | -26.41 | 714 | -18.12 | ||||
| 2025-08-15 | 13F | Equitable Holdings, Inc. | 56,379 | -16.73 | 1,478 | -7.34 | ||||
| 2025-08-15 | 13F | CI Private Wealth, LLC | 29,341 | -54.07 | 769 | -48.87 | ||||
| 2025-08-14 | 13F | Bank Of America Corp /de/ | 432,819 | -36.41 | 11,344 | -29.22 | ||||
| 2025-08-26 | NP | EQ ADVISORS TRUST - EQ/International Core Managed Volatility Portfolio Class IB | 39,947 | -17.03 | 1,047 | -7.59 | ||||
| 2025-07-30 | 13F | Bogart Wealth, LLC | 1,105 | 0.00 | 29 | 7.69 | ||||
| 2025-08-11 | 13F | Tidemark, LLC | 76 | 2.70 | 2 | 0.00 | ||||
| 2025-08-14 | 13F | Citadel Advisors Llc | 0 | -100.00 | 0 | |||||
| 2025-08-14 | 13F | Raymond James Financial Inc | 56,900 | -43.82 | 1,491 | -37.48 | ||||
| 2025-08-14 | 13F | IHT Wealth Management, LLC | 9,824 | 9.99 | 257 | 22.38 | ||||
| 2025-05-15 | 13F | Federation des caisses Desjardins du Quebec | 0 | -100.00 | 0 | |||||
| 2025-08-14 | 13F | Smartleaf Asset Management LLC | 2 | -92.00 | 0 | |||||
| 2025-08-28 | NP | Northern Lights Fund Trust - Sierra Tactical Risk Spectrum 30 Fund Instl Class | 42,300 | 1,109 | ||||||
| 2025-07-21 | 13F | Mirae Asset Global Investments Co., Ltd. | 11,000 | 4.76 | 288 | 16.60 | ||||
| 2025-08-08 | 13F | Pnc Financial Services Group, Inc. | 51,599 | -4.49 | 1,352 | 6.29 | ||||
| 2025-08-11 | 13F | Principal Securities, Inc. | 161,623 | 9,026.09 | 4,236 | 11,348.65 | ||||
| 2025-05-05 | 13F | Lindbrook Capital, Llc | 1 | -66.67 | 0 | |||||
| 2025-08-14 | 13F | Mml Investors Services, Llc | 55,525 | -40.49 | 1 | -50.00 | ||||
| 2025-08-11 | 13F | Citigroup Inc | 211,435 | -53.18 | 5,542 | -47.90 | ||||
| 2025-07-07 | 13F | Bangor Savings Bank | 1,100 | 0.00 | 29 | 12.00 | ||||
| 2025-08-14 | 13F | BTG Pactual Asset Management US LLC | 11,893 | 0.00 | 312 | 11.07 | ||||
| 2025-07-18 | 13F | Trust Co Of Vermont | 347 | 0.00 | 9 | 12.50 | ||||
| 2025-07-16 | 13F | RWM Asset Management, LLC | 9,131 | 0.00 | 239 | 11.16 | ||||
| 2025-08-14 | 13F | Royal Bank Of Canada | 241,919 | 468.70 | 6,342 | 532.93 | ||||
| 2025-07-24 | 13F | IFP Advisors, Inc | 192 | 0.00 | 5 | 25.00 | ||||
| 2025-07-17 | 13F | SeaBridge Investment Advisors LLC | 13,392 | 351 | ||||||
| 2025-08-14 | 13F | Goldman Sachs Group Inc | 49,700 | -90.19 | 1,303 | -89.08 | ||||
| 2025-07-24 | 13F | Robertson Stephens Wealth Management, LLC | 9,759 | -5.10 | 256 | 5.37 | ||||
| 2025-08-12 | 13F | Trexquant Investment LP | 12,918 | -10.45 | 339 | -0.29 | ||||
| 2025-07-28 | 13F | BRYN MAWR TRUST Co | 2,500 | 66 | ||||||
| 2025-08-14 | 13F | Bnp Paribas Arbitrage, Sa | 169,807 | 3.05 | 4,451 | 14.69 | ||||
| 2025-07-29 | 13F | Swmg, Llc | 8,052 | 201 | ||||||
| 2025-08-13 | 13F | Natixis | 1,411 | -12.09 | 37 | -2.70 | ||||
| 2025-05-05 | 13F | Morningstar Investment Services LLC | 97,252 | 2 | ||||||
| 2025-08-11 | 13F | Beaumont Capital Management, LLC | 61,588 | 251.77 | 1,614 | 291.75 | ||||
| 2025-08-11 | 13F | Nomura Asset Management Co Ltd | 56,120 | 1,770.67 | 1,471 | 2,000.00 | ||||
| 2025-08-05 | 13F | Crestwood Advisors Group LLC | 8,441 | 221 | ||||||
| 2025-08-11 | 13F | SFI Advisors, LLC | 8,247 | 216 | ||||||
| 2025-08-11 | 13F | ICICI Prudential Asset Management Co Ltd | 154,143 | 0.00 | 4,040 | 11.23 | ||||
| 2025-08-19 | 13F | Advisory Services Network, LLC | 61,792 | -3.80 | 1,537 | 1.65 | ||||
| 2025-06-26 | NP | TDSC - Cabana Target Drawdown 10 ETF | 946,924 | 200.48 | 23,578 | 225.89 | ||||
| 2025-08-14 | 13F | Man Group plc | 154,859 | 4,059 | ||||||
| 2025-08-08 | 13F | Banco Bilbao Vizcaya Argentaria, S.a. | 0 | -100.00 | 0 | |||||
| 2025-07-10 | 13F | Professional Financial Advisors, LLC | 0 | -100.00 | 0 | |||||
| 2025-08-08 | 13F | Foundations Investment Advisors, LLC | 29,538 | -36.13 | 774 | -28.93 | ||||
| 2025-08-13 | 13F | Hsbc Holdings Plc | 170,274 | -3.02 | 4,463 | 7.93 | ||||
| 2025-08-27 | NP | XNAV - FundX Aggressive ETF | 35,500 | 930 | ||||||
| 2025-08-12 | 13F | Ci Investments Inc. | 20,000 | 0.00 | 1 | |||||
| 2025-07-31 | 13F | Ssa Swiss Advisors Ag | 72,800 | 1,848 | ||||||
| 2025-07-31 | 13F | Sharper & Granite LLC | 41,380 | 48.37 | 1,097 | 67.07 | ||||
| 2025-08-14 | 13F | Fmr Llc | 3,304 | 23.28 | 87 | 36.51 | ||||
| 2025-08-19 | 13F | Cape Investment Advisory, Inc. | 363 | 2.25 | 10 | 12.50 | ||||
| 2025-08-12 | 13F | LPL Financial LLC | 567,458 | 62.55 | 14,873 | 80.91 | ||||
| 2025-04-09 | 13F | Milestone Asset Management, Llc | 0 | -100.00 | 0 | |||||
| 2025-07-25 | 13F | Apollon Wealth Management, LLC | 8,286 | 217 | ||||||
| 2025-07-30 | 13F | Journey Advisory Group, LLC | 319,901 | 30.21 | 8,385 | 44.90 | ||||
| 2025-07-18 | 13F | Gold Investment Management Ltd. | 11,946 | -0.19 | 313 | 11.39 | ||||
| 2025-08-18 | 13F/A | National Bank Of Canada /fi/ | 1,340 | -3.11 | 35 | 9.38 | ||||
| 2025-08-08 | 13F | Cetera Investment Advisers | 44,121 | -37.80 | 1,156 | -30.78 | ||||
| 2025-08-14 | 13F | Old Mission Capital Llc | 0 | -100.00 | 0 | |||||
| 2025-07-08 | 13F | Lowe Wealth Advisors, LLC | 2,341 | 303.62 | 61 | 369.23 | ||||
| 2025-08-06 | 13F | First Horizon Advisors, Inc. | 480 | 0.00 | 13 | 9.09 | ||||
| 2025-08-08 | 13F/A | Ignite Planners, LLC | 8,445 | 211 | ||||||
| 2025-07-29 | 13F | Private Trust Co Na | 1,443 | -23.93 | 38 | -15.91 | ||||
| 2025-08-15 | 13F | Morgan Stanley | 3,635,724 | 12.64 | 95,292 | 25.36 | ||||
| 2025-08-06 | 13F | AE Wealth Management LLC | 1,187 | -52.00 | 31 | -46.55 | ||||
| 2025-08-12 | 13F | Jpmorgan Chase & Co | 435,775 | 134.70 | 11,422 | 161.23 | ||||
| 2025-08-04 | 13F | Atria Investments Llc | 13,576 | -10.51 | 356 | -0.56 | ||||
| 2025-07-23 | 13F | Indiana Trust & Investment Management CO | 31,800 | 0.00 | 833 | 11.36 | ||||
| 2025-07-11 | 13F | Farther Finance Advisors, LLC | 616 | 0.00 | 16 | 14.29 | ||||
| 2025-07-29 | 13F | Cottonwood Capital Advisors, Llc | 9,796 | 4.60 | 257 | 16.36 | ||||
| 2025-08-11 | 13F | HighTower Advisors, LLC | 555,060 | 47.87 | 14,548 | 64.59 | ||||
| 2025-08-07 | 13F | BOK Financial Private Wealth, Inc. | 0 | -100.00 | 0 | |||||
| 2025-08-13 | 13F | New Harbor Financial Group, LLC | 964,005 | 25,267 | ||||||
| 2025-07-21 | 13F | Patriot Financial Group Insurance Agency, LLC | 9,421 | 247 | ||||||
| 2025-07-23 | 13F | Heck Capital Advisors, LLC | 0 | -100.00 | 0 | |||||
| 2025-07-15 | 13F | Fortitude Family Office, LLC | 188 | 5 | ||||||
| 2025-07-28 | 13F | Kiker Wealth Management, LLC | 152,024 | -2.78 | 3,985 | 8.20 | ||||
| 2025-08-13 | 13F | Bank Of Nova Scotia | 137,733 | -17.54 | 3,610 | -8.24 | ||||
| 2025-08-06 | 13F | Decker Retirement Planning Inc. | 210 | 6 | ||||||
| 2025-08-14 | 13F | Sentinus, LLC | 12,435 | -43.24 | 326 | -36.89 | ||||
| 2025-07-18 | 13F | Centricity Wealth Management, LLC | 1,217 | 32 | ||||||
| 2025-08-08 | 13F | Capital Investment Advisory Services, LLC | 954 | -36.65 | 25 | -28.57 | ||||
| 2025-08-12 | 13F | Edmond De Rothschild Holding S.a. | 3,722 | 0.00 | 98 | 11.49 | ||||
| 2025-08-14 | 13F | Optiver Holding B.V. | 155 | 0.00 | 4 | 33.33 | ||||
| 2025-07-21 | 13F | Vaughan Nelson Investment Management, L.p. | 2,610 | 0.00 | 68 | |||||
| 2025-08-14 | 13F | Kovitz Investment Group Partners, LLC | 44,148 | 1.73 | 1,157 | 13.32 | ||||
| 2025-03-27 | NP | BLACKROCK GLOBAL ALLOCATION FUND, INC. - BLACKROCK GLOBAL ALLOCATION FUND, INC. Investor A This fund is a listed as child fund of BlackRock, Inc. and if that institution has disclosed ownership in this security, then these positions will not be double counted when calculating total shares and total value | 222,628 | 0.00 | 5,112 | -6.67 | ||||
| 2025-08-14 | 13F | Susquehanna International Group, Llp | Call | 10,900 | 286 | |||||
| 2025-05-15 | 13F | National Wealth Management Group, LLC | 18,360 | 0.97 | 432 | 13.68 | ||||
| 2025-08-14 | 13F | Susquehanna International Group, Llp | 0 | -100.00 | 0 | |||||
| 2025-07-08 | 13F | Ehrlich Financial Group | 9,923 | -72.53 | 260 | -69.41 | ||||
| 2025-08-14 | 13F | Comerica Bank | 2,978 | -1.91 | 78 | 9.86 | ||||
| 2025-08-13 | 13F | Jones Financial Companies Lllp | 21,267 | 29.85 | 548 | 40.87 | ||||
| 2025-08-28 | NP | Northern Lights Fund Trust - Sierra Tactical Risk Spectrum 70 Fund Investor Class | 36,200 | 949 | ||||||
| 2025-08-12 | 13F | Global Retirement Partners, LLC | 18,222 | 96.78 | 478 | 147.15 | ||||
| 2025-08-08 | 13F | Family Firm, Inc. | 30,433 | 1.57 | 798 | 13.05 | ||||
| 2025-07-17 | 13F | Sound Income Strategies, LLC | 1,882 | 288.04 | 49 | 345.45 | ||||
| 2025-05-15 | 13F | Wiley Bros.-aintree Capital, Llc | 0 | -100.00 | 0 | |||||
| 2025-08-01 | 13F | Banco Santander, S.A. | 116,485 | -21.69 | 3,053 | -12.85 | ||||
| 2025-08-01 | 13F | Solstein Capital, LLC | 39 | 0.00 | 1 | |||||
| 2025-08-12 | 13F | Steward Partners Investment Advisory, Llc | 306,392 | 7.48 | 8,031 | 19.62 | ||||
| 2025-08-29 | 13F | Total Investment Management Inc | 370 | 10 | ||||||
| 2025-08-28 | NP | Northern Lights Fund Trust - Sierra Tactical Core Growth Fund Investor Class Shares | 7,495 | 196 | ||||||
| 2025-08-13 | 13F | GeoWealth Management, LLC | 23,264 | 61.78 | 610 | 80.18 | ||||
| 2025-08-15 | 13F | Kestra Advisory Services, LLC | 245,629 | -22.05 | 6,438 | -13.25 | ||||
| 2025-08-13 | 13F | Renaissance Technologies Llc | 29,700 | 778 | ||||||
| 2025-08-11 | 13F | Greykasell Wealth Strategies, Inc. | 7,633 | -6.87 | 200 | 3.63 | ||||
| 2025-08-14 | 13F | CIBC World Markets Inc. | 24,142 | 73.25 | 633 | 92.68 | ||||
| 2025-07-16 | 13F | Old Port Advisors | 95,177 | -22.20 | 2,495 | -13.40 | ||||
| 2025-08-12 | 13F | BlackRock, Inc. | 658,158 | -12.20 | 17,250 | -2.28 | ||||
| 2025-08-14 | 13F | Millennium Management Llc | 0 | -100.00 | 0 | |||||
| 2025-08-27 | NP | RYDEX VARIABLE TRUST - Multi-Hedge Strategies Fund Variable Annuity | Short | -1,157 | -34.89 | -30 | -26.83 | |||
| 2025-08-05 | 13F | Bank of New York Mellon Corp | 0 | -100.00 | 0 | |||||
| 2025-08-11 | 13F | Covestor Ltd | 459 | 32.66 | 0 | |||||
| 2025-08-13 | 13F | Summit Financial, LLC | 27,136 | 711 | ||||||
| 2025-04-15 | 13F | Fifth Third Bancorp | 0 | -100.00 | 0 | -100.00 | ||||
| 2025-07-25 | 13F | Cwm, Llc | 0 | -100.00 | 0 | |||||
| 2025-08-14 | 13F | Hrt Financial Lp | 9,461 | 0 | ||||||
| 2025-08-18 | 13F | Tactive Advisors, LLC | 124,747 | 3,270 | ||||||
| 2025-08-13 | 13F | Schroder Investment Management Group | 48,543 | 1,272 | ||||||
| 2025-08-13 | 13F | Metlife Inc | 73,836 | -1.09 | 1,935 | 9.94 | ||||
| 2025-07-16 | 13F | Signaturefd, Llc | 1 | -99.12 | 0 | -100.00 | ||||
| 2025-07-14 | 13F | Pacifica Partners Inc. | 269 | -19.70 | 7 | -25.00 | ||||
| 2025-08-12 | 13F | EFG Asset Management (Americas) Corp. | 70,011 | 0.62 | 1,835 | 11.97 | ||||
| 2025-08-14 | 13F | FIL Ltd | 1,615,797 | 325,010.06 | 42,350 | 384,900.00 | ||||
| 2025-07-16 | 13F | Cabana Llc | 71,798 | -28.44 | 1,882 | -20.36 | ||||
| 2025-08-13 | 13F | Continuum Advisory, LLC | 0 | -100.00 | 0 | |||||
| 2025-07-31 | 13F | Cambridge Investment Research Advisors, Inc. | 63,986 | -73.73 | 2 | -80.00 | ||||
| 2025-08-15 | 13F | Tower Research Capital LLC (TRC) | 1,317 | 3,459.46 | 35 | |||||
| 2025-07-08 | 13F | Heartwood Wealth Advisors LLC | 23,150 | 0.21 | 607 | 11.40 | ||||
| 2025-07-09 | 13F | Finley Financial, LLC | 31,347 | -5.29 | 822 | -1.08 | ||||
| 2025-08-14 | 13F | Citadel Advisors Llc | Call | 16,900 | 1,777.78 | 443 | 2,004.76 | |||
| 2025-07-08 | 13F | Gallacher Capital Management LLC | 78,858 | 3.20 | 2,067 | 14.84 | ||||
| 2025-08-14 | 13F | Citadel Advisors Llc | Put | 8,400 | -54.35 | 220 | -49.19 | |||
| 2025-07-31 | 13F | Oppenheimer & Co Inc | 16,701 | 438 | ||||||
| 2025-08-04 | 13F | Assetmark, Inc | 2,064,352 | 1,605.16 | 54,107 | 1,797.79 | ||||
| 2025-08-04 | 13F | Spire Wealth Management | 11,848 | 0.80 | 311 | 12.32 | ||||
| 2025-05-15 | 13F | Glenmede Trust Co Na | 500 | 0.00 | 12 | 10.00 | ||||
| 2025-07-21 | 13F | Ascent Group, LLC | 16,340 | 428 | ||||||
| 2025-08-11 | 13F | Private Advisor Group, LLC | 17,890 | -71.96 | 469 | -68.84 | ||||
| 2025-08-07 | 13F | Resources Investment Advisors, LLC. | 0 | -100.00 | 0 | |||||
| 2025-08-05 | 13F | Simplex Trading, Llc | 7,279 | 251.13 | 0 | |||||
| 2025-08-13 | 13F | Green Harvest Asset Management LLC | 34,220 | 18.78 | 897 | 32.15 | ||||
| 2025-07-09 | 13F | Breakwater Investment Management | 1,205 | 0.00 | 32 | 10.71 | ||||
| 2025-07-30 | 13F | Roman Butler Fullerton & Co | 15,250 | -48.16 | 387 | -42.50 | ||||
| 2025-07-21 | 13F | Verus Financial Partners, Inc. | 11,978 | 1.73 | 311 | 15.24 | ||||
| 2025-08-14 | 13F | Jane Street Group, Llc | 0 | -100.00 | 0 | |||||
| 2025-08-28 | NP | Northern Lights Fund Trust - Sierra Tactical Risk Spectrum 50 Fund Investor Class | 125,700 | 3,295 | ||||||
| 2025-05-29 | NP | Jnl Series Trust - Jnl/blackrock Global Allocation Fund (a) | 0 | -100.00 | 0 | -100.00 | ||||
| 2025-07-23 | 13F | Venturi Wealth Management, LLC | 250,644 | 6,569 | ||||||
| 2025-08-11 | 13F | Highview Capital Management LLC/DE/ | 130,736 | 3,427 |