Mga Batayang Estadistika
| Pemilik Institusional | 223 total, 220 long only, 1 short only, 2 long/short - change of 0.00% MRQ |
| Alokasi Portofolio Rata-rata | 0.2213 % - change of -14.75% MRQ |
| Saham Institusional (Jangka Panjang) | 36,527,265 (ex 13D/G) - change of 2.83MM shares 8.40% MRQ |
| Nilai Institusional (Jangka Panjang) | $ 434,074 USD ($1000) |
Kepemilikan Institusional dan Pemegang Saham
Oaktree Specialty Lending Corporation (US:OCSL) memiliki 223 pemilik institusional dan pemegang saham yang telah mengajukan formulir 13D/G atau 13F kepada Komisi Bursa Efek (Securities Exchange Commission/SEC). Lembaga-lembaga ini memegang total 36,527,265 saham. Pemegang saham terbesar meliputi Morgan Stanley, Private Management Group Inc, Bruni J V & Co /co, Van Eck Associates Corp, Ares Management Llc, Generali Asset Management SPA SGR, Oaktree Capital Management Lp, BIZD - VanEck Vectors BDC Income ETF, CLARET ASSET MANAGEMENT Corp, and Melia Wealth LLC .
Struktur kepemilikan institusional Oaktree Specialty Lending Corporation (NasdaqGS:OCSL) menunjukkan posisi terkini di perusahaan oleh institusi dan dana, serta perubahan terbaru dalam ukuran posisi. Pemegang saham utama dapat mencakup investor individu, reksa dana, dana lindung nilai, atau institusi. Jadwal 13D menunjukkan bahwa investor memegang (atau pernah memegang) lebih dari 5% saham perusahaan dan bermaksud (atau pernah bermaksud) untuk secara aktif mengejar perubahan strategi bisnis. Jadwal 13G menunjukkan investasi pasif lebih dari 5%.
The share price as of September 5, 2025 is 13.97 / share. Previously, on September 9, 2024, the share price was 16.56 / share. This represents a decline of 15.64% over that period.

Skor Sentimen Dana
Skor Sentimen Dana (sebelumnya dikenal sebagai Skor Akumulasi Kepemilikan) menemukan saham-saham yang paling banyak dibeli oleh dana. Ini adalah hasil dari model kuantitatif multi-faktor yang canggih yang mengidentifikasi perusahaan dengan tingkat akumulasi institusional tertinggi. Model penilaian menggunakan kombinasi dari total peningkatan pemilik yang diungkapkan, perubahan dalam alokasi portofolio pada pemilik tersebut, dan metrik lainnya. Angka berkisar dari 0 hingga 100, dengan angka yang lebih tinggi menunjukkan tingkat akumulasi yang lebih tinggi dibandingkan dengan perusahaan sejenisnya, dan 50 adalah rata-ratanya.
Frekuensi Pembaruan: Setiap Hari
Lihat Ownership Explorer, yang menyediakan daftar perusahaan dengan peringkat tertinggi.
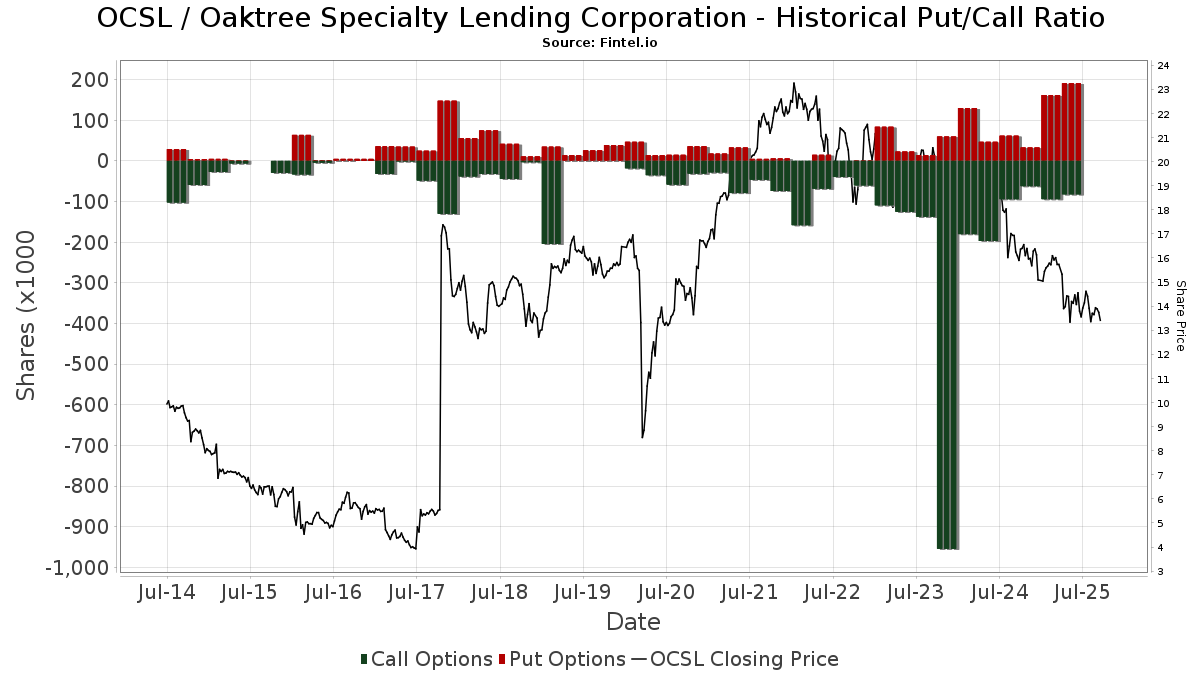
Rasio Put/Call Institusional
Selain melaporkan isu ekuitas dan utang standar, institusi dengan aset di bawah manajemen lebih dari 100 juta dolar AS juga harus mengungkapkan kepemilikan opsi put dan call mereka. Karena opsi put umumnya menunjukkan sentimen negatif, dan opsi call menunjukkan sentimen positif, kita dapat mengetahui sentimen institusional secara keseluruhan dengan memplot rasio put terhadap call. Grafik di sebelah kanan memplot rasio put/call historis untuk instrumen ini.
Menggunakan Rasio Put/Call sebagai indikator sentimen investor mengatasi salah satu kekurangan utama dari penggunaan total kepemilikan institusional, yaitu sejumlah besar aset yang dikelola diinvestasikan secara pasif untuk melacak indeks. Dana yang dikelola secara pasif biasanya tidak membeli opsi, sehingga indikator rasio put/call lebih akurat dalam melacak sentimen dana yang dikelola secara aktif.
Pengajuan 13D/G
Kami menyajikan pengajuan 13D/G secara terpisah dari pengajuan 13F karena perlakuan yang berbeda oleh SEC. Pengajuan 13D/G dapat diajukan oleh kelompok investor (dengan satu pemimpin), sedangkan pengajuan 13F tidak bisa. Hal ini mengakibatkan situasi di mana seorang investor dapat mengajukan 13D/G yang melaporkan satu nilai untuk total saham (mewakili semua saham yang dimiliki oleh kelompok investor), tetapi kemudian mengajukan 13F yang melaporkan nilai yang berbeda untuk total saham (mewakili kepemilikan mereka sendiri). Ini berarti bahwa kepemilikan saham dari pengajuan 13D/G dan pengajuan 13F seringkali tidak dapat dibandingkan secara langsung, sehingga kami menyajikannya secara terpisah.
Catatan: Mulai 16 Mei 2021, kami tidak lagi menampilkan pemilik yang belum mengajukan 13D/G dalam setahun terakhir. Sebelumnya, kami menampilkan riwayat lengkap pengajuan 13D/G. Secara umum, entitas yang diwajibkan untuk mengajukan pengajuan 13D/G harus mengajukan setidaknya setiap tahun sebelum mengirimkan pengajuan penutupan. Namun, terkadang dana keluar dari posisi tanpa mengirimkan pengajuan penutupan (misalnya, mereka menghentikan operasi), sehingga menampilkan riwayat lengkap terkadang menyebabkan kebingungan tentang kepemilikan saat ini. Untuk mencegah kebingungan, kami sekarang hanya menampilkan pemilik 'saat ini' - yaitu - pemilik yang telah mengajukan dalam setahun terakhir.
Upgrade to unlock premium data.
| Tanggal File | Formulir | Investor | Sebelumnya Saham |
Terbaru Saham |
Δ Saham (Persen) |
Kepemilikan (Persen) |
Δ Pagmamay-ari (Persen) |
|
|---|---|---|---|---|---|---|---|---|
| 2025-02-10 | Oaktree Capital I, L.P. | 7,524,605 | 8.56 |
Pengajuan 13F dan NPORT
Detail pada pengajuan 13F tersedia gratis. Detail pada pengajuan NP memerlukan keanggotaan premium. Baris berwarna hijau menunjukkan posisi baru. Baris berwarna merah menunjukkan posisi yang sudah ditutup. Klik tautan ini ikon untuk melihat riwayat transaksi selengkapnya.
Tingkatkan
untuk membuka data premium dan mengekspor ke Excel ![]() .
.
| Tanggal File | Sumber | Investor | Ketik | Presyo ng Avg (Silangan) |
Saham | Δ Saham (%) |
Dilaporkan Nilai ($1000) |
Nilai Δ (%) |
Alokasi Port (%) |
|
|---|---|---|---|---|---|---|---|---|---|---|
| 2025-08-04 | 13F | Muzinich & Co., Inc. | 260,854 | 13.34 | 3,563 | 0.79 | ||||
| 2025-08-14 | 13F | Balyasny Asset Management Llc | 626,324 | 298.94 | 8,556 | 254.83 | ||||
| 2025-05-07 | 13F | Horan Capital Advisors, LLC. | 11,757 | 0.00 | 181 | 0.56 | ||||
| 2025-03-31 | NP | LSVQX - LSV Small Cap Value Fund Institutional Class Shares | 44,631 | 0.00 | 714 | -1.24 | ||||
| 2025-07-01 | 13F | Confluence Investment Management Llc | 137,042 | 0.47 | 1,872 | -10.69 | ||||
| 2025-08-04 | 13F | REDW Wealth LLC | 20,000 | 53.85 | 273 | 37.19 | ||||
| 2025-08-14 | 13F | Jane Street Group, Llc | 11,267 | -70.16 | 154 | -73.58 | ||||
| 2025-08-14 | 13F | Ameriprise Financial Inc | 0 | -100.00 | 0 | |||||
| 2025-08-13 | 13F | Lido Advisors, LLC | 106,141 | -8.69 | 1,450 | -18.82 | ||||
| 2025-07-16 | 13F | Signaturefd, Llc | 210 | -68.80 | 3 | -80.00 | ||||
| 2025-08-29 | NP | John Hancock Financial Opportunities Fund | 259,793 | 0.00 | 3,549 | -11.08 | ||||
| 2025-07-11 | 13F | Caldwell Securities, Inc | 5,750 | 0.00 | 79 | -11.36 | ||||
| 2025-07-31 | 13F | Jackson Hole Capital Partners, LLC | 18,651 | 0.00 | 255 | -11.19 | ||||
| 2025-08-12 | 13F | Advisors Asset Management, Inc. | 104,228 | -41.99 | 1,424 | -48.42 | ||||
| 2025-08-11 | 13F | Lsv Asset Management | 300,403 | -44.82 | 4 | -50.00 | ||||
| 2025-07-14 | 13F | S.A. Mason LLC | 650 | 9 | ||||||
| 2025-08-14 | 13F | Optiver Holding B.V. | 1,462 | 0.00 | 20 | -13.64 | ||||
| 2025-07-10 | 13F | Security National Bank | 3,201 | 10.53 | 44 | -2.27 | ||||
| 2025-08-13 | 13F | Invesco Ltd. | 705,824 | -3.31 | 9,642 | -14.01 | ||||
| 2025-07-25 | 13F | Cwm, Llc | 728 | 0.00 | 0 | |||||
| 2025-07-30 | 13F | Atlantic Edge Private Wealth Management, LLC | 200 | 0.00 | 3 | -33.33 | ||||
| 2025-08-14 | 13F | Aqr Capital Management Llc | 35,601 | -2.25 | 486 | -13.06 | ||||
| 2025-08-19 | 13F | Marex Group plc | 25,211 | 344 | ||||||
| 2025-08-14 | 13F | GWM Advisors LLC | 12,972 | 688.09 | 177 | 608.00 | ||||
| 2025-08-11 | 13F | Strategic Wealth Partners, Ltd. | 37,489 | -21.93 | 512 | -31.91 | ||||
| 2025-08-14 | 13F | Verition Fund Management LLC | 35,514 | 485 | ||||||
| 2025-07-16 | 13F | Rezny Wealth Management, Inc. | 187,957 | -33.66 | 2,567 | -41.00 | ||||
| 2025-08-13 | 13F | Quantbot Technologies LP | 55,820 | 763 | ||||||
| 2025-07-16 | 13F | Register Financial Advisors LLC | 11,043 | 0.00 | 151 | -11.24 | ||||
| 2025-08-06 | 13F | Round Rock Advisors, LLC | 107,369 | -0.13 | 1,467 | -11.21 | ||||
| 2025-08-05 | 13F | Mountain Hill Investment Partners Corp. | 32 | 3.23 | 0 | |||||
| 2025-05-14 | 13F | Campbell & CO Investment Adviser LLC | 0 | -100.00 | 0 | |||||
| 2025-08-04 | 13F | Spire Wealth Management | 4,310 | -5.48 | 59 | -17.14 | ||||
| 2025-05-12 | 13F | Simplex Trading, Llc | 0 | -100.00 | 0 | |||||
| 2025-07-31 | 13F | Oppenheimer & Co Inc | 0 | -100.00 | 0 | |||||
| 2025-08-14 | 13F/A | Rockefeller Capital Management L.P. | 368,923 | 10.31 | 5,039 | -1.91 | ||||
| 2025-07-31 | 13F | Whipplewood Advisors, LLC | 73,216 | 138,043.40 | 1,000 | 110.97 | ||||
| 2025-08-12 | 13F | Private Management Group Inc | 2,406,670 | 10.14 | 32,875 | -2.04 | ||||
| 2025-08-14 | 13F | Mml Investors Services, Llc | 30,939 | 10.65 | 0 | |||||
| 2025-07-17 | 13F | Janney Montgomery Scott LLC | 37,708 | -12.70 | 1 | |||||
| 2025-08-12 | 13F | Close Asset Management Ltd | 6,200 | 34.78 | 0 | |||||
| 2025-08-15 | 13F | CI Private Wealth, LLC | 42,918 | 286.02 | 586 | 244.71 | ||||
| 2025-08-05 | 13F | Simplex Trading, Llc | Call | 2,400 | -52.94 | 0 | ||||
| 2025-05-07 | 13F | Spectrum Wealth Counsel, LLC | 75 | 0.00 | 1 | 0.00 | ||||
| 2025-08-12 | 13F | LPL Financial LLC | 149,729 | -6.03 | 2,045 | -16.43 | ||||
| 2025-07-18 | 13F | Generali Investments CEE, investicni spolecnost, a.s. | 23,020 | 10.07 | 314 | -2.18 | ||||
| 2025-07-25 | 13F | Community Bank, N.A. | 730 | 0.00 | 10 | -18.18 | ||||
| 2025-08-13 | 13F | Brown Advisory Inc | 54,021 | 0.00 | 738 | -11.10 | ||||
| 2025-04-29 | NP | SWSAX - SIIT World Select Equity Fund Class A | 2,700 | 0.00 | 44 | -2.27 | ||||
| 2025-07-15 | 13F | Avaii Wealth Management, Llc | 28,212 | 75.52 | 385 | 56.50 | ||||
| 2025-04-07 | 13F | AdvisorNet Financial, Inc | 0 | -100.00 | 0 | |||||
| 2025-07-28 | 13F | Melia Wealth LLC | 990,458 | 12.61 | 13,530 | 0.15 | ||||
| 2025-07-24 | 13F | Ronald Blue Trust, Inc. | 68,622 | 0.00 | 937 | -11.10 | ||||
| 2025-04-15 | 13F | Integrated Advisors Network LLC | 0 | -100.00 | 0 | -100.00 | ||||
| 2025-07-31 | 13F | Sumitomo Mitsui Trust Holdings, Inc. | 240,769 | 7.15 | 3,289 | -4.72 | ||||
| 2025-08-11 | 13F | EMC Capital Management | 0 | -100.00 | 0 | |||||
| 2025-08-14 | 13F/A | Skopos Labs, Inc. | 1,301 | 18 | ||||||
| 2025-07-31 | 13F | Cambridge Investment Research Advisors, Inc. | 24,819 | -15.64 | 0 | |||||
| 2025-08-14 | 13F | Two Sigma Investments, Lp | 120,839 | -31.70 | 1,651 | -39.27 | ||||
| 2025-08-14 | 13F | Quarry LP | 1,198 | 16 | ||||||
| 2025-08-11 | 13F | Universal- Beteiligungs- und Servicegesellschaft mbH | 0 | -100.00 | 0 | |||||
| 2025-07-15 | 13F | Kentucky Trust Co | 1,000 | 0.00 | 14 | -13.33 | ||||
| 2025-08-06 | 13F | Carnegie Lake Advisors LLC | 133,542 | 0.00 | 2 | -50.00 | ||||
| 2025-08-11 | 13F | TD Waterhouse Canada Inc. | 1 | 0.00 | 0 | |||||
| 2025-08-01 | 13F | Envestnet Asset Management Inc | 14,262 | -83.12 | 195 | -85.04 | ||||
| 2025-08-15 | 13F | Northeast Financial Consultants Inc | 32,166 | 0.00 | 439 | -11.13 | ||||
| 2025-08-13 | 13F | Wills Financial Group LLC | 232,808 | 0.42 | 3,180 | -10.67 | ||||
| 2025-07-23 | 13F | Stonegate Investment Group, LLC | 14,371 | 2.55 | 196 | -8.84 | ||||
| 2025-08-14 | 13F | Oxford Asset Management Llp | 41,267 | 253.43 | 564 | 216.29 | ||||
| 2025-05-14 | 13F | CF Capital LLC | 0 | -100.00 | 0 | |||||
| 2025-07-16 | 13F | Arlington Capital Management, Inc. | 68,855 | 941 | ||||||
| 2025-08-13 | 13F | Texas Capital Bank Wealth Management Services Inc | 166,625 | 2.83 | 2,276 | -8.52 | ||||
| 2025-07-29 | 13F | Arnhold LLC | 152,345 | -6.16 | 2,081 | -16.53 | ||||
| 2025-08-13 | 13F | EverSource Wealth Advisors, LLC | 2 | 0 | ||||||
| 2025-08-13 | 13F | Crescent Grove Advisors, LLC | 23,765 | 0.00 | 325 | -11.23 | ||||
| 2025-05-19 | NP | MSCQX - Mercer US Small/Mid Cap Equity Fund Class I | 57,200 | 0.00 | 879 | 0.46 | ||||
| 2025-08-13 | 13F | Barclays Plc | 0 | -100.00 | 0 | |||||
| 2025-08-29 | NP | Gabelli Dividend & Income Trust | 186,379 | 3.02 | 2,546 | -8.39 | ||||
| 2025-08-08 | 13F | Hartland & Co., LLC | 28,747 | 4.05 | 393 | -7.55 | ||||
| 2025-08-14 | 13F | Two Sigma Securities, Llc | 0 | -100.00 | 0 | |||||
| 2025-07-29 | NP | SLPAX - Siit Small Cap Fund - Class A | 13,100 | 0.00 | 192 | -9.48 | ||||
| 2025-08-01 | 13F | Pasadena Private Wealth, LLC | 28,901 | 395 | ||||||
| 2025-08-14 | 13F | Van Eck Associates Corp | 2,038,700 | 4.95 | 28 | -6.90 | ||||
| 2025-08-15 | 13F | Captrust Financial Advisors | 10,884 | 149 | ||||||
| 2025-08-07 | 13F | Samalin Investment Counsel, LLC | 87,512 | 2.62 | 1,195 | -8.71 | ||||
| 2025-08-15 | 13F | Kensington Investment Counsel, LLC | 11,547 | 0.00 | 158 | -11.30 | ||||
| 2025-08-06 | 13F | HORAN Wealth, LLC | 11,757 | 161 | ||||||
| 2025-07-28 | NP | KBWD - Invesco KBW High Dividend Yield Financial ETF This fund is a listed as child fund of Invesco Ltd. and if that institution has disclosed ownership in this security, then these positions will not be double counted when calculating total shares and total value | 664,948 | -19.17 | 9,728 | -26.64 | ||||
| 2025-08-12 | 13F | Proequities, Inc. | 0 | 0 | ||||||
| 2025-08-12 | 13F | Proequities, Inc. | Put | 0 | 0 | |||||
| 2025-08-12 | 13F | Proequities, Inc. | Call | 0 | 0 | |||||
| 2025-08-13 | 13F | Oaktree Capital Management Lp | 1,852,456 | 0.00 | 25,305 | -11.07 | ||||
| 2025-08-04 | 13F | Pinnacle Associates Ltd | 99,587 | -33.78 | 1,360 | -41.10 | ||||
| 2025-08-08 | 13F | MTM Investment Management, LLC | 2,500 | 34 | ||||||
| 2025-05-06 | 13F | Bank Julius Baer & Co. Ltd, Zurich | 0 | -100.00 | 0 | |||||
| 2025-07-29 | 13F | Chicago Partners Investment Group LLC | 18,317 | -8.16 | 264 | -1.13 | ||||
| 2025-08-05 | 13F | Bank Of Montreal /can/ | 12,112 | 3.74 | 165 | -7.82 | ||||
| 2025-08-14 | 13F | Royal Bank Of Canada | 613,023 | 30.74 | 8,374 | 16.29 | ||||
| 2025-08-06 | 13F | Commonwealth Equity Services, Llc | 94,898 | -14.48 | 1 | 0.00 | ||||
| 2025-08-14 | 13F | State Street Corp | 78,745 | 257.77 | 1,076 | 218.05 | ||||
| 2025-04-01 | NP | LSVFX - LSV GLOBAL MANAGED VOLATILITY FUND Institutional Class Shares | 1,600 | 0.00 | 26 | 0.00 | ||||
| 2025-08-13 | 13F | Wealthedge Investment Advisors, Llc | 96,807 | -25.36 | 1,322 | -33.63 | ||||
| 2025-08-25 | 13F/A | Neuberger Berman Group LLC | 17,781 | -80.92 | 243 | -83.09 | ||||
| 2025-08-05 | 13F | Castlekeep Investment Advisors Llc | 321,059 | 0.56 | 4,386 | -10.58 | ||||
| 2025-07-16 | 13F | Old Port Advisors | 67,004 | 915 | ||||||
| 2025-08-14 | 13F | Financial Advisory Service, Inc. | 20,195 | 0.00 | 276 | -11.29 | ||||
| 2025-07-31 | 13F | AlTi Global, Inc. | 51,641 | -0.39 | 742 | -6.78 | ||||
| 2025-08-13 | 13F | Cresset Asset Management, LLC | 43,773 | 0.51 | 598 | -10.63 | ||||
| 2025-08-14 | 13F | BI Asset Management Fondsmaeglerselskab A/S | 279,248 | 20.61 | 4 | 0.00 | ||||
| 2025-08-14 | 13F | First Foundation Advisors | 10,559 | 0.00 | 144 | -11.11 | ||||
| 2025-08-14 | 13F | Wells Fargo & Company/mn | 245,638 | -32.84 | 3,355 | -40.27 | ||||
| 2025-08-13 | 13F | Virtus Investment Advisers, Inc. | 82,913 | -9.34 | 1,133 | -19.37 | ||||
| 2025-09-04 | 13F/A | Advisor Group Holdings, Inc. | 232,525 | -58.90 | 3,177 | -63.47 | ||||
| 2025-05-13 | 13F | Cercano Management LLC | 0 | -100.00 | 0 | -100.00 | ||||
| 2025-03-12 | 13F | Centaurus Financial, Inc. | 0 | -100.00 | 0 | |||||
| 2025-05-05 | 13F | IFP Advisors, Inc | 0 | -100.00 | 0 | |||||
| 2025-08-11 | 13F | United Advisor Group, LLC | 229,304 | 3.22 | 3,132 | -8.21 | ||||
| 2025-07-28 | 13F | Generali Asset Management SPA SGR | 1,888,566 | 74.20 | 25,798 | 54.92 | ||||
| 2025-07-28 | 13F | Harbour Investments, Inc. | 3,839 | 0.55 | 52 | -10.34 | ||||
| 2025-08-15 | 13F | Tower Research Capital LLC (TRC) | 4,163 | 1,025.14 | 57 | 1,020.00 | ||||
| 2025-08-12 | 13F | Entropy Technologies, LP | 0 | -100.00 | 0 | |||||
| 2025-08-14 | 13F | Boston Private Wealth Llc | 0 | -100.00 | 0 | -100.00 | ||||
| 2025-08-14 | 13F | Group One Trading, L.p. | Call | 15,000 | -33.92 | 205 | -41.38 | |||
| 2025-08-14 | 13F | Group One Trading, L.p. | 61,437 | 839 | ||||||
| 2025-08-14 | 13F | Millennium Management Llc | 0 | -100.00 | 0 | |||||
| 2025-07-28 | NP | PEX - ProShares Global Listed Private Equity ETF | 15,522 | -6.23 | 227 | -14.66 | ||||
| 2025-06-25 | NP | VPC - Virtus Private Credit Strategy ETF | 83,541 | -0.22 | 1,203 | -10.23 | ||||
| 2025-04-10 | 13F | Thurston, Springer, Miller, Herd & Titak, Inc. | 0 | -100.00 | 0 | |||||
| 2025-07-28 | 13F | Naviter Wealth, LLC | 175,837 | 12.68 | 2,402 | -3.61 | ||||
| 2025-08-14 | 13F | Kovitz Investment Group Partners, LLC | 167,719 | -1.68 | 2,291 | -12.56 | ||||
| 2025-07-21 | 13F | Ameritas Advisory Services, LLC | 608 | 8 | ||||||
| 2025-08-14 | 13F | Lazard Asset Management Llc | 92,736 | 0.00 | 1 | 0.00 | ||||
| 2025-08-13 | 13F | Marshall Wace, Llp | 18,011 | 246 | ||||||
| 2025-08-07 | 13F | ProShare Advisors LLC | 14,518 | -12.66 | 198 | -22.35 | ||||
| 2025-07-09 | 13F | Westbourne Investments, Inc. | 10,000 | 0.00 | 137 | -11.11 | ||||
| 2025-08-14 | 13F | Mariner, LLC | 110,846 | 12.60 | 1,514 | 0.13 | ||||
| 2025-05-05 | 13F | Transce3nd, LLC | 0 | -100.00 | 0 | |||||
| 2025-08-12 | 13F | Running Point Capital Advisors, LLC | 25,080 | 24.90 | 343 | 11.04 | ||||
| 2025-08-08 | 13F | KBC Group NV | 17,930 | 0.00 | 0 | |||||
| 2025-08-19 | 13F | Anchor Investment Management, LLC | 3,200 | 0.00 | 44 | -12.24 | ||||
| 2025-05-01 | 13F | LRI Investments, LLC | 0 | -100.00 | 0 | |||||
| 2025-05-05 | 13F | Lindbrook Capital, Llc | 29,815 | 75.38 | 458 | 76.45 | ||||
| 2025-08-14 | 13F | UBS Group AG | 842,182 | 29.25 | 11,504 | 14.95 | ||||
| 2025-08-18 | 13F/A | National Bank Of Canada /fi/ | 2,165 | 28.03 | 30 | 16.00 | ||||
| 2025-08-19 | 13F | Newbridge Financial Services Group, Inc. | 500 | -64.05 | 7 | -71.43 | ||||
| 2025-05-06 | 13F | Y-Intercept (Hong Kong) Ltd | 0 | -100.00 | 0 | |||||
| 2025-07-25 | NP | First Trust Specialty Finance & Financial Opportunities Fund This fund is a listed as child fund of First Trust Advisors Lp and if that institution has disclosed ownership in this security, then these positions will not be double counted when calculating total shares and total value | 90,000 | 0.00 | 1,317 | -9.24 | ||||
| 2025-07-18 | 13F | Founders Capital Management | 1,000 | 0.00 | 14 | -13.33 | ||||
| 2025-07-30 | 13F | Denali Advisors Llc | 144,458 | -2.24 | 1,973 | -13.05 | ||||
| 2025-08-14 | 13F | Bank Of America Corp /de/ | 124,289 | -21.70 | 1,698 | -30.39 | ||||
| 2025-08-14 | 13F | Bramshill Investments, LLC | 44,597 | -0.26 | 609 | -11.22 | ||||
| 2025-08-13 | 13F | CLARET ASSET MANAGEMENT Corp | 1,700,738 | 23 | 0.00 | |||||
| 2025-08-14 | 13F | Raymond James Financial Inc | 68,055 | 0.59 | 930 | -10.59 | ||||
| 2025-08-14 | 13F | Financial Strategies Group, Inc. | 55,428 | 19.58 | 799 | 21.65 | ||||
| 2025-08-12 | 13F | CIBC Private Wealth Group, LLC | 2,050 | 0.00 | 28 | 7.69 | ||||
| 2025-08-18 | 13F | Wolverine Trading, Llc | Call | 0 | -100.00 | 0 | ||||
| 2025-08-14 | 13F | Sciencast Management LP | 0 | -100.00 | 0 | |||||
| 2025-08-14 | 13F | Susquehanna International Group, Llp | Put | 52,000 | 14.79 | 710 | 2.16 | |||
| 2025-08-14 | 13F | Susquehanna International Group, Llp | 26,016 | -65.70 | 355 | -69.50 | ||||
| 2025-05-14 | 13F | Virtus ETF Advisers LLC | 0 | -100.00 | 0 | |||||
| 2025-08-14 | 13F | Susquehanna International Group, Llp | Call | 28,600 | 72.29 | 391 | 53.54 | |||
| 2025-08-12 | 13F | MAI Capital Management | 28,957 | -0.69 | 396 | -11.63 | ||||
| 2025-07-15 | 13F | Bfsg, Llc | 13,475 | 5.44 | 184 | -6.12 | ||||
| 2025-08-12 | 13F | Global Retirement Partners, LLC | 875 | 12 | ||||||
| 2025-08-14 | 13F | Principal Street Partners, LLC | 28,810 | -1.37 | 394 | -12.28 | ||||
| 2025-08-12 | 13F | Archer Investment Corp | 59 | 3.51 | 1 | |||||
| 2025-08-13 | 13F | Northern Trust Corp | 80,590 | 274.42 | 1,101 | 233.33 | ||||
| 2025-05-02 | 13F | Wealthfront Advisers Llc | 0 | -100.00 | 0 | -100.00 | ||||
| 2025-08-15 | 13F | Morgan Stanley | 3,449,055 | 1.73 | 47,114 | -9.52 | ||||
| 2025-08-13 | 13F | Natixis | 22 | 0 | ||||||
| 2025-04-28 | 13F | Strategic Financial Concepts, LLC | 0 | -100.00 | 0 | -100.00 | ||||
| 2025-07-18 | 13F | Truist Financial Corp | 10,182 | -5.46 | 139 | -15.76 | ||||
| 2025-08-12 | 13F | Cornerstone Wealth Management, LLC | 14,167 | 0.06 | 194 | -11.06 | ||||
| 2025-08-14 | 13F | Fmr Llc | 0 | -100.00 | 0 | |||||
| 2025-05-15 | 13F | Glenview Trust Co | 16,148 | 0.00 | 247 | 0.00 | ||||
| 2025-08-08 | 13F | Wall Street Access Asset Management, LLC | 12,320 | 1.55 | 168 | -9.68 | ||||
| 2025-07-08 | 13F/A | Salem Investment Counselors Inc | 283 | 0.00 | 4 | -25.00 | ||||
| 2025-08-07 | 13F | Vista Investment Partners Ii, Llc | 0 | -100.00 | 0 | |||||
| 2025-07-30 | 13F | Cornerstone Advisory, LLC | 87,289 | -0.37 | 1,192 | 1.36 | ||||
| 2025-05-06 | 13F | Carnegie Capital Asset Management, LLC | 0 | -100.00 | 0 | |||||
| 2025-08-14 | 13F | Two Sigma Advisers, Lp | 262,541 | -19.23 | 3,586 | -28.17 | ||||
| 2025-07-17 | 13F | Sonora Investment Management Group, LLC | 18,100 | 15.29 | 247 | 2.49 | ||||
| 2025-05-15 | 13F | Aquatic Capital Management LLC | 0 | -100.00 | 0 | |||||
| 2025-07-14 | 13F | Abound Wealth Management | 2,577 | 35 | ||||||
| 2025-08-14 | 13F | Goldman Sachs Group Inc | 0 | -100.00 | 0 | |||||
| 2025-08-08 | 13F | Cetera Investment Advisers | 26,769 | -1.50 | 366 | -12.47 | ||||
| 2025-07-18 | 13F | PFG Investments, LLC | 31,767 | 2.01 | 434 | -9.41 | ||||
| 2025-07-30 | 13F | Jackson Thornton Asset Management, Llc | 35,601 | -2.25 | 502 | -3.83 | ||||
| 2025-07-24 | 13F | Us Bancorp \de\ | 518 | -84.09 | 7 | -86.00 | ||||
| 2025-08-14 | 13F | Arete Wealth Advisors, LLC | 10,481 | 0.44 | 0 | |||||
| 2025-08-22 | 13F/A | TT Capital Management LLC | 104,643 | 7.57 | 1,429 | -4.35 | ||||
| 2025-07-15 | 13F | North Star Investment Management Corp. | 460 | 0.00 | 6 | -14.29 | ||||
| 2025-07-10 | 13F | Sovran Advisors, LLC | 29,882 | -2.37 | 422 | -4.10 | ||||
| 2025-08-06 | 13F | Moors & Cabot, Inc. | 12,402 | 0.11 | 169 | -11.05 | ||||
| 2025-08-12 | 13F | Adalta Capital Management LLC | 25,535 | 0.00 | 349 | -11.22 | ||||
| 2025-07-11 | 13F | Mandatum Life Insurance Co Ltd | 37,714 | -14.82 | 515 | -24.26 | ||||
| 2025-08-13 | 13F | Beacon Pointe Advisors, LLC | 50,352 | -37.87 | 688 | -44.77 | ||||
| 2025-08-06 | 13F | Bruni J V & Co /co | 2,212,352 | 14.29 | 30,221 | 1.64 | ||||
| 2025-03-14 | 13F/A | Hara Capital LLC | 333 | 0.00 | 5 | 0.00 | ||||
| 2025-07-25 | 13F | Almanack Investment Partners, LLC. | 16,361 | 0.00 | 223 | -11.16 | ||||
| 2025-07-16 | 13F | PFS Partners, LLC | 1,936 | 0.00 | 26 | -10.34 | ||||
| 2025-08-11 | 13F | Nordwand Advisors, LLC | 56,311 | -2.10 | 769 | -12.91 | ||||
| 2025-05-15 | 13F | Qube Research & Technologies Ltd | 0 | -100.00 | 0 | |||||
| 2025-08-11 | 13F | Hexagon Capital Partners LLC | 0 | -100.00 | 0 | |||||
| 2025-08-14 | 13F | VPR Management LLC | 8,000 | 109 | ||||||
| 2025-08-12 | 13F | Virtu Financial LLC | 10,966 | -68.49 | 0 | |||||
| 2025-08-07 | 13F | Allworth Financial LP | 3,482 | 48 | ||||||
| 2025-08-21 | NP | BIZD - VanEck Vectors BDC Income ETF | 1,816,009 | 0.24 | 24,807 | -10.85 | ||||
| 2025-08-11 | 13F | HighTower Advisors, LLC | 132,247 | 12.09 | 1,806 | -0.33 | ||||
| 2025-08-08 | 13F | Marble Harbor Investment Counsel, LLC | 18,000 | -10.22 | 246 | -20.20 | ||||
| 2025-08-05 | 13F | Huntington National Bank | 1 | 0.00 | 0 | |||||
| 2025-08-12 | 13F | Bokf, Na | 1,900 | 0.00 | 26 | -13.79 | ||||
| 2025-08-12 | 13F | Legal & General Group Plc | 549,208 | 0.24 | 7,499 | -10.95 | ||||
| 2025-08-08 | 13F | Creative Planning | 53,128 | 1.91 | 726 | -9.37 | ||||
| 2025-08-14 | 13F | Brevan Howard Capital Management LP | 11,784 | 161 | ||||||
| 2025-08-28 | NP | RNCOX - RiverNorth Core Opportunity Fund Class R | 18,231 | 0.00 | 249 | -11.07 | ||||
| 2025-08-08 | 13F | Pnc Financial Services Group, Inc. | 0 | -100.00 | 0 | |||||
| 2025-08-20 | NP | LSPAX - LoCorr Spectrum Income Fund Class A | 40,848 | 0.00 | 558 | -11.16 | ||||
| 2025-05-13 | 13F | Fox Run Management, L.l.c. | 0 | -100.00 | 0 | -100.00 | ||||
| 2025-07-25 | 13F | Atria Wealth Solutions, Inc. | 23,186 | 22.97 | 317 | 9.34 | ||||
| 2025-08-04 | 13F | Canton Hathaway, LLC | 7,350 | 0.00 | 0 | |||||
| 2025-08-13 | 13F | Loomis Sayles & Co L P | 176,666 | 0.00 | 2,413 | 120,550.00 | ||||
| 2025-08-14 | 13F | D. E. Shaw & Co., Inc. | 0 | -100.00 | 0 | |||||
| 2025-08-11 | 13F | Independent Advisor Alliance | 182,795 | -2.48 | 2,497 | -13.30 | ||||
| 2025-07-21 | 13F | Ameriflex Group, Inc. | 340 | 0.59 | 5 | -20.00 | ||||
| 2025-08-13 | 13F | Hbk Investments L P | Put | 44,400 | 0.00 | 607 | -11.01 | |||
| 2025-08-14 | 13F | Federation des caisses Desjardins du Quebec | 4,118 | 0.00 | 56 | -11.11 | ||||
| 2025-08-18 | 13F | Geneos Wealth Management Inc. | 5,869 | -4.21 | 80 | -14.89 | ||||
| 2025-08-12 | 13F | BlackRock, Inc. | 470,761 | 30.11 | 6,431 | 15.71 | ||||
| 2025-06-30 | NP | PSP - Invesco Global Listed Private Equity ETF This fund is a listed as child fund of Invesco Ltd. and if that institution has disclosed ownership in this security, then these positions will not be double counted when calculating total shares and total value | 37,779 | -17.47 | 544 | -25.68 | ||||
| 2025-04-16 | 13F | Everpar Advisors Llc | 0 | -100.00 | 0 | |||||
| 2025-05-15 | 13F | Schonfeld Strategic Advisors LLC | 0 | -100.00 | 0 | |||||
| 2025-08-28 | NP | RNDLX - RiverNorth/DoubleLine Strategic Income Fund Class R | 351,500 | 74.05 | 4,801 | 54.82 | ||||
| 2025-08-19 | 13F | MRP Capital Investments, LLC | 11,578 | 8.34 | 158 | -3.66 | ||||
| 2025-05-28 | NP | VQNPX - Vanguard Growth and Income Fund Investor Shares This fund is a listed as child fund of Vanguard Group Inc and if that institution has disclosed ownership in this security, then these positions will not be double counted when calculating total shares and total value | 4,000 | -54.55 | 61 | -54.48 | ||||
| 2025-05-30 | NP | ERNZ - TrueShares Active Yield ETF | 9,307 | 89.36 | 143 | 89.33 | ||||
| 2025-07-08 | 13F | Parallel Advisors, LLC | 17,250 | 0.00 | 236 | -10.98 | ||||
| 2025-07-31 | 13F | Caitong International Asset Management Co., Ltd | 57 | 714.29 | 1 | |||||
| 2025-08-14 | 13F | Manufacturers Life Insurance Company, The | 259,793 | 0.00 | 3,549 | -11.08 | ||||
| 2025-07-17 | 13F | GraniteShares Advisors LLC | 183,742 | 6.67 | 2,510 | -5.14 | ||||
| 2025-08-13 | 13F | Gabelli Funds Llc | 186,379 | 3.02 | 2,546 | -8.39 | ||||
| 2025-08-12 | 13F | Jpmorgan Chase & Co | 49,140 | -59.41 | 671 | -63.91 | ||||
| 2025-08-08 | 13F | SG Americas Securities, LLC | 10,675 | 17.19 | 0 | |||||
| 2025-08-27 | 13F/A | Squarepoint Ops LLC | 16,261 | -49.56 | 222 | -55.15 | ||||
| 2025-08-14 | 13F | Ares Management Llc | 1,945,305 | -1.62 | 26,573 | -12.51 | ||||
| 2025-04-25 | 13F | Albion Financial Group /ut | 0 | -100.00 | 0 | |||||
| 2025-07-18 | 13F | Institute for Wealth Management, LLC. | 0 | -100.00 | 0 | |||||
| 2025-08-13 | 13F | Plan Group Financial, LLC | 92,151 | 23.45 | 1,259 | 9.77 | ||||
| 2025-07-29 | NP | SSMAX - Siit Small Mid Cap Equity Fund - Class A | 53,000 | 0.00 | 775 | -9.25 | ||||
| 2025-07-03 | 13F | Fiduciary Financial Group, Llc | 60,457 | 12.77 | 831 | 14.46 | ||||
| 2025-08-11 | 13F | Nomura Asset Management Co Ltd | 3,394 | 46 | ||||||
| 2025-08-11 | 13F | Citigroup Inc | 0 | -100.00 | 0 | |||||
| 2025-08-28 | NP | Rivernorth Opportunities Fund, Inc. | 112,931 | 1.08 | 1,543 | -10.14 | ||||
| 2025-08-29 | NP | GraniteShares ETF Trust - GraniteShares HIPS US High Income ETF | 183,742 | 6.67 | 2,510 | -5.14 | ||||
| 2025-08-21 | NP | MOFTX - Mercer Opportunistic Fixed Income Fund Class I | 43,000 | 587 | ||||||
| 2025-08-15 | 13F | Caxton Associates Llp | 47,194 | 0.00 | 645 | -11.05 | ||||
| 2025-04-16 | 13F | Howard Capital Management Group, LLC | 0 | -100.00 | 0 | |||||
| 2025-07-31 | 13F | Nilsine Partners, LLC | 16,455 | 0.00 | 225 | -11.11 | ||||
| 2025-08-11 | 13F | Principal Securities, Inc. | 2,130 | 29 | ||||||
| 2025-08-12 | 13F | Trexquant Investment LP | 179,741 | -34.65 | 2,455 | -41.88 | ||||
| 2025-08-13 | 13F | Guggenheim Capital Llc | 31,406 | 7.61 | 429 | -4.24 | ||||
| 2025-08-07 | 13F | Hennion & Walsh Asset Management, Inc. | 93,778 | -27.64 | 1,281 | -35.63 | ||||
| 2025-05-27 | 13F | Advisors Capital Management, LLC | 0 | -100.00 | 0 | |||||
| 2025-08-11 | 13F | Traub Capital Management LLC | 471 | 6 | ||||||
| 2025-08-12 | 13F | DnB Asset Management AS | 142,266 | 0.00 | 1,943 | -11.08 | ||||
| 2025-08-14 | 13F | Citadel Advisors Llc | 12,977 | -16.68 | 177 | -25.94 | ||||
| 2025-08-14 | 13F | Citadel Advisors Llc | Call | 36,700 | 19.54 | 501 | 6.37 | |||
| 2025-08-14 | 13F | Rivernorth Capital Management, Llc | 618,906 | 86.47 | 8,454 | 65.83 | ||||
| 2025-08-14 | 13F | Citadel Advisors Llc | Put | 95,100 | 30.81 | 1,299 | 16.40 | |||
| 2025-08-14 | 13F | Comerica Bank | 28,259 | 41.04 | 386 | 25.73 | ||||
| 2025-08-04 | 13F | Assetmark, Inc | 548 | -22.16 | 7 | -30.00 | ||||
| 2025-08-14 | 13F | Sunbelt Securities, Inc. | 6,288 | 19.93 | 96 | 20.00 | ||||
| 2025-08-04 | 13F | Flagship Harbor Advisors, Llc | 36,310 | -5.88 | 496 | -16.39 | ||||
| 2025-08-14 | 13F | Stifel Financial Corp | 45,350 | -28.50 | 619 | -36.45 |