Mga Batayang Estadistika
| Saham Institusional (Jangka Panjang) | 149,161,431 - 61.03% (ex 13D/G) - change of -0.91MM shares -0.60% MRQ |
| Nilai Institusional (Jangka Panjang) | $ 1,053,903 USD ($1000) |
Kepemilikan Institusional dan Pemegang Saham
ReNew Energy Global Plc (US:RNW) memiliki 137 pemilik institusional dan pemegang saham yang telah mengajukan formulir 13D/G atau 13F kepada Komisi Bursa Efek (Securities Exchange Commission/SEC). Lembaga-lembaga ini memegang total 149,161,431 saham. Pemegang saham terbesar meliputi Canada Pension Plan Investment Board, Rubric Capital Management LP, Franklin Resources Inc, Ubs Asset Management Americas Inc, Millennium Management Llc, BlackRock, Inc., Carrhae Capital LLP, M&G Plc, MSD Partners, L.P., and Invesco Ltd. .
Struktur kepemilikan institusional ReNew Energy Global Plc (NasdaqGS:RNW) menunjukkan posisi terkini di perusahaan oleh institusi dan dana, serta perubahan terbaru dalam ukuran posisi. Pemegang saham utama dapat mencakup investor individu, reksa dana, dana lindung nilai, atau institusi. Jadwal 13D menunjukkan bahwa investor memegang (atau pernah memegang) lebih dari 5% saham perusahaan dan bermaksud (atau pernah bermaksud) untuk secara aktif mengejar perubahan strategi bisnis. Jadwal 13G menunjukkan investasi pasif lebih dari 5%.
The share price as of September 5, 2025 is 7.80 / share. Previously, on September 9, 2024, the share price was 5.98 / share. This represents an increase of 30.43% over that period.

Skor Sentimen Dana
Skor Sentimen Dana (sebelumnya dikenal sebagai Skor Akumulasi Kepemilikan) menemukan saham-saham yang paling banyak dibeli oleh dana. Ini adalah hasil dari model kuantitatif multi-faktor yang canggih yang mengidentifikasi perusahaan dengan tingkat akumulasi institusional tertinggi. Model penilaian menggunakan kombinasi dari total peningkatan pemilik yang diungkapkan, perubahan dalam alokasi portofolio pada pemilik tersebut, dan metrik lainnya. Angka berkisar dari 0 hingga 100, dengan angka yang lebih tinggi menunjukkan tingkat akumulasi yang lebih tinggi dibandingkan dengan perusahaan sejenisnya, dan 50 adalah rata-ratanya.
Frekuensi Pembaruan: Setiap Hari
Lihat Ownership Explorer, yang menyediakan daftar perusahaan dengan peringkat tertinggi.
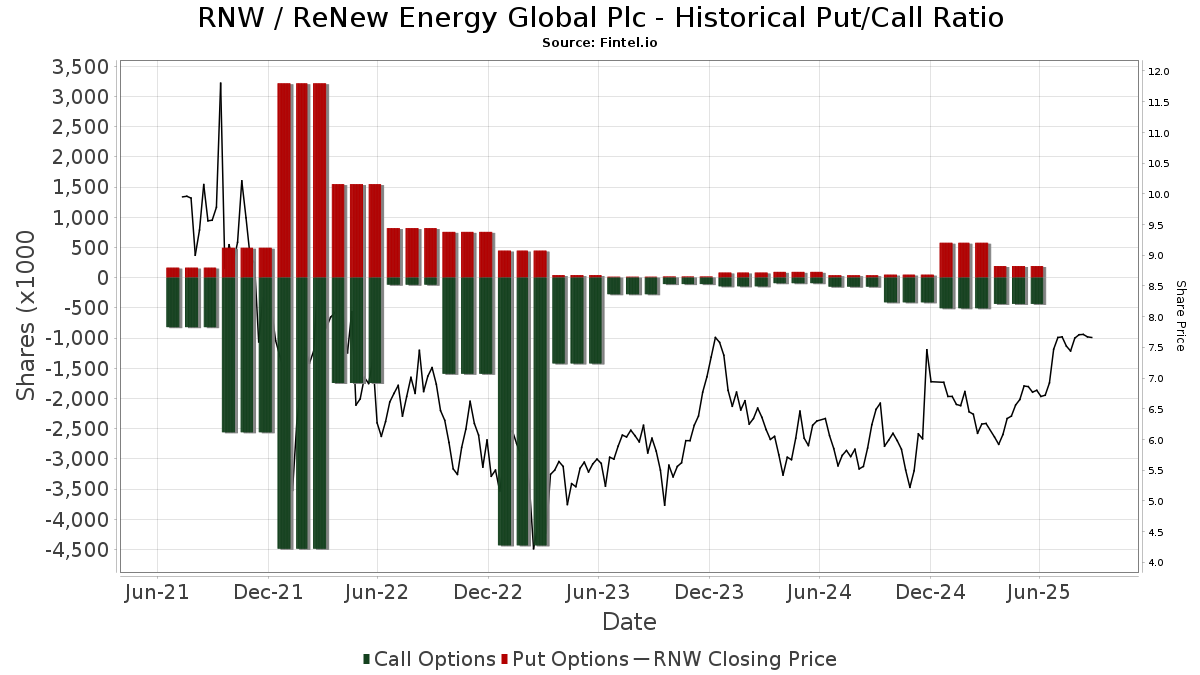
Rasio Put/Call Institusional
Selain melaporkan isu ekuitas dan utang standar, institusi dengan aset di bawah manajemen lebih dari 100 juta dolar AS juga harus mengungkapkan kepemilikan opsi put dan call mereka. Karena opsi put umumnya menunjukkan sentimen negatif, dan opsi call menunjukkan sentimen positif, kita dapat mengetahui sentimen institusional secara keseluruhan dengan memplot rasio put terhadap call. Grafik di sebelah kanan memplot rasio put/call historis untuk instrumen ini.
Menggunakan Rasio Put/Call sebagai indikator sentimen investor mengatasi salah satu kekurangan utama dari penggunaan total kepemilikan institusional, yaitu sejumlah besar aset yang dikelola diinvestasikan secara pasif untuk melacak indeks. Dana yang dikelola secara pasif biasanya tidak membeli opsi, sehingga indikator rasio put/call lebih akurat dalam melacak sentimen dana yang dikelola secara aktif.
Pengajuan 13D/G
Kami menyajikan pengajuan 13D/G secara terpisah dari pengajuan 13F karena perlakuan yang berbeda oleh SEC. Pengajuan 13D/G dapat diajukan oleh kelompok investor (dengan satu pemimpin), sedangkan pengajuan 13F tidak bisa. Hal ini mengakibatkan situasi di mana seorang investor dapat mengajukan 13D/G yang melaporkan satu nilai untuk total saham (mewakili semua saham yang dimiliki oleh kelompok investor), tetapi kemudian mengajukan 13F yang melaporkan nilai yang berbeda untuk total saham (mewakili kepemilikan mereka sendiri). Ini berarti bahwa kepemilikan saham dari pengajuan 13D/G dan pengajuan 13F seringkali tidak dapat dibandingkan secara langsung, sehingga kami menyajikannya secara terpisah.
Catatan: Mulai 16 Mei 2021, kami tidak lagi menampilkan pemilik yang belum mengajukan 13D/G dalam setahun terakhir. Sebelumnya, kami menampilkan riwayat lengkap pengajuan 13D/G. Secara umum, entitas yang diwajibkan untuk mengajukan pengajuan 13D/G harus mengajukan setidaknya setiap tahun sebelum mengirimkan pengajuan penutupan. Namun, terkadang dana keluar dari posisi tanpa mengirimkan pengajuan penutupan (misalnya, mereka menghentikan operasi), sehingga menampilkan riwayat lengkap terkadang menyebabkan kebingungan tentang kepemilikan saat ini. Untuk mencegah kebingungan, kami sekarang hanya menampilkan pemilik 'saat ini' - yaitu - pemilik yang telah mengajukan dalam setahun terakhir.
Upgrade to unlock premium data.
| Tanggal File | Formulir | Investor | Sebelumnya Saham |
Terbaru Saham |
Δ Saham (Persen) |
Kepemilikan (Persen) |
Δ Pagmamay-ari (Persen) |
|
|---|---|---|---|---|---|---|---|---|
| 2025-08-06 | FRANKLIN RESOURCES INC | 14,187,989 | 5.80 | |||||
| 2025-07-03 | Sinha Sumant | 47,628,131 | 53,193,730 | 11.69 | 17.90 | 9.82 | ||
| 2025-07-03 | CANADA PENSION PLAN INVESTMENT BOARD | 88,846,844 | 88,846,844 | 0.00 | 34.60 | 0.00 | ||
| 2025-07-03 | Abu Dhabi Investment Authority | 58,170,916 | 58,170,916 | 0.00 | 23.80 | 0.00 | ||
| 2024-11-13 | Rubric Capital Management LP | 13,706,102 | 5.61 | |||||
| 2024-09-05 | JERA Power RN B.V. | 28,524,255 | 28,524,255 | 0.00 | 11.70 | 15.84 |
Pengajuan 13F dan NPORT
Detail pada pengajuan 13F tersedia gratis. Detail pada pengajuan NP memerlukan keanggotaan premium. Baris berwarna hijau menunjukkan posisi baru. Baris berwarna merah menunjukkan posisi yang sudah ditutup. Klik tautan ini ikon untuk melihat riwayat transaksi selengkapnya.
Tingkatkan
untuk membuka data premium dan mengekspor ke Excel ![]() .
.
| Tanggal File | Sumber | Investor | Ketik | Presyo ng Avg (Silangan) |
Saham | Δ Saham (%) |
Dilaporkan Nilai ($1000) |
Nilai Δ (%) |
Alokasi Port (%) |
|
|---|---|---|---|---|---|---|---|---|---|---|
| 2025-08-13 | 13F | Northwest & Ethical Investments L.P. | 1,287,523 | -5.47 | 8,897 | 10.91 | ||||
| 2025-08-14 | 13F | Sagefield Capital LP | 0 | -100.00 | 0 | |||||
| 2025-08-14 | 13F | Goldman Sachs Group Inc | 82,190 | -44.96 | 568 | -35.49 | ||||
| 2025-08-27 | 13F/A | Squarepoint Ops LLC | 47,766 | 173.31 | 330 | 223.53 | ||||
| 2025-06-26 | NP | USMIX - Extended Market Index Fund | 18,584 | 8.36 | 119 | 6.31 | ||||
| 2025-08-08 | 13F | Everett Harris & Co /ca/ | 40,000 | 0.00 | 276 | 17.45 | ||||
| 2025-04-15 | 13F | SG Americas Securities, LLC | 0 | -100.00 | 0 | |||||
| 2025-07-18 | 13F | Robeco Institutional Asset Management B.V. | 92,459 | -7.91 | 639 | 7.95 | ||||
| 2025-05-29 | NP | CPAEX - Counterpoint Tactical Equity Fund Class A Shares | 0 | -100.00 | 0 | -100.00 | ||||
| 2025-07-25 | 13F | JustInvest LLC | 50,933 | 103.57 | 352 | 138.78 | ||||
| 2025-05-05 | 13F | IFP Advisors, Inc | 0 | -100.00 | 0 | |||||
| 2025-08-01 | 13F | Y-Intercept (Hong Kong) Ltd | 104,056 | 487.42 | 719 | 591.35 | ||||
| 2025-05-09 | 13F | R Squared Ltd | 0 | -100.00 | 0 | |||||
| 2025-08-14 | 13F | Ubs Asset Management Americas Inc | 6,083,048 | 3.40 | 42,034 | 21.30 | ||||
| 2025-08-13 | 13F | Groupe la Francaise | 320,591 | 1.35 | 2,211 | 16.87 | ||||
| 2025-07-28 | NP | TAN - Invesco Solar ETF This fund is a listed as child fund of Invesco Ltd. and if that institution has disclosed ownership in this security, then these positions will not be double counted when calculating total shares and total value | 1,230,300 | -1.35 | 8,378 | 6.64 | ||||
| 2025-08-14 | 13F | UBS Group AG | 150,870 | -63.54 | 1,043 | -57.24 | ||||
| 2025-08-14 | 13F | Boston Private Wealth Llc | 0 | -100.00 | 0 | |||||
| 2025-08-14 | 13F | Point72 Europe (London) LLP | 0 | -100.00 | 0 | |||||
| 2025-08-13 | 13F | Quantbot Technologies LP | 4,235 | 29 | ||||||
| 2025-08-05 | 13F | Carrhae Capital LLP | 2,767,298 | -24.29 | 19,122 | -11.17 | ||||
| 2025-08-12 | 13F | Picton Mahoney Asset Management | 0 | -100.00 | 0 | |||||
| 2025-05-14 | 13F | Trexquant Investment LP | 0 | -100.00 | 0 | -100.00 | ||||
| 2025-08-06 | 13F | Fox Run Management, L.l.c. | 18,998 | -51.69 | 131 | -43.29 | ||||
| 2025-08-13 | 13F | First Trust Advisors Lp | 928,603 | 0.06 | 6,417 | 17.38 | ||||
| 2025-08-14 | 13F | Lazard Asset Management Llc | 108,096 | 75.04 | 1 | |||||
| 2025-08-13 | 13F | Shelton Capital Management | 39,179 | -0.98 | 271 | 15.88 | ||||
| 2025-08-15 | 13F | Morgan Stanley | 617,742 | -27.32 | 4,269 | -14.74 | ||||
| 2025-08-12 | 13F | Pathstone Holdings, LLC | 12,382 | 86 | ||||||
| 2025-08-13 | 13F | Hsbc Holdings Plc | 11,911 | 0.00 | 82 | 14.08 | ||||
| 2025-08-14 | 13F | Schonfeld Strategic Advisors LLC | 0 | -100.00 | 0 | |||||
| 2025-08-14 | 13F | Balyasny Asset Management Llc | 252,503 | -69.01 | 1,745 | -63.65 | ||||
| 2025-07-14 | 13F | Counterpoint Mutual Funds LLC | 0 | -100.00 | 0 | |||||
| 2025-07-16 | 13F | Signaturefd, Llc | 32,896 | 90.76 | 227 | 124.75 | ||||
| 2025-04-28 | 13F | CIBRA Capital Ltd | 148,759 | 876 | ||||||
| 2025-08-01 | 13F | Davy Global Fund Management Ltd | 47,173 | 18.26 | 326 | 38.89 | ||||
| 2025-07-24 | 13F | Standard Life Aberdeen plc | 20,334 | 0.00 | 138 | 15.00 | ||||
| 2025-08-19 | 13F | State of Wyoming | 18,903 | 111.42 | 131 | 150.00 | ||||
| 2025-09-04 | 13F/A | Advisor Group Holdings, Inc. | 86,463 | 118,342.47 | 597 | |||||
| 2025-08-07 | 13F | Allworth Financial LP | 1,069 | 356.84 | 7 | 600.00 | ||||
| 2025-04-30 | 13F | Silphium Asset Management Ltd | 0 | -100.00 | 0 | |||||
| 2025-08-07 | 13F | Campbell & CO Investment Adviser LLC | 0 | -100.00 | 0 | |||||
| 2025-08-13 | 13F | EverSource Wealth Advisors, LLC | 2,564 | 2,656.99 | 18 | |||||
| 2025-08-14 | 13F | Point72 (DIFC) Ltd | 1,614 | 11 | ||||||
| 2025-08-14 | 13F | CoreCommodity Management, LLC | 121,391 | 335.59 | 839 | 410.98 | ||||
| 2025-08-14 | 13F | Vident Advisory, LLC | 0 | -100.00 | 0 | |||||
| 2025-07-10 | 13F | Swedbank AB | 802,400 | 0.00 | 5,545 | 17.31 | ||||
| 2025-08-14 | 13F | Millennium Management Llc | 5,720,780 | -9.93 | 39,531 | 5.66 | ||||
| 2025-08-14 | 13F | Millennium Management Llc | Call | 258,333 | 1,390 | |||||
| 2025-08-14 | 13F | Wells Fargo & Company/mn | 4,300 | 0.00 | 30 | 16.00 | ||||
| 2025-07-14 | 13F | Foster Group, Inc. | 15,167 | 105 | ||||||
| 2025-07-31 | 13F | MQS Management LLC | 0 | -100.00 | 0 | |||||
| 2025-08-05 | 13F | Westside Investment Management, Inc. | 1,062 | 7 | ||||||
| 2025-08-12 | 13F | MAI Capital Management | 847 | 6 | ||||||
| 2025-05-15 | 13F | Oxford Asset Management Llp | 0 | -100.00 | 0 | |||||
| 2025-07-14 | 13F | GAMMA Investing LLC | 1,371 | 784.52 | 9 | |||||
| 2025-08-14 | 13F | Fieldview Capital Management, LLC | 18,146 | 125 | ||||||
| 2025-08-08 | 13F | Geode Capital Management, Llc | 285,212 | -2.65 | 1,971 | 14.20 | ||||
| 2025-08-14 | 13F | Rubric Capital Management LP | 14,438,061 | -0.62 | 99,767 | 16.60 | ||||
| 2025-05-05 | 13F | Kayne Anderson Capital Advisors Lp | 0 | -100.00 | 0 | -100.00 | ||||
| 2025-08-13 | 13F | Russell Investments Group, Ltd. | 628 | 4 | ||||||
| 2025-08-14 | 13F | Bnp Paribas Arbitrage, Sa | 72,647 | 1,217.74 | 502 | 1,465.63 | ||||
| 2025-08-14 | 13F | Susquehanna International Group, Llp | Put | 17,900 | 124 | |||||
| 2025-08-14 | 13F | Susquehanna International Group, Llp | 12,618 | 87 | ||||||
| 2025-08-14 | 13F | Susquehanna International Group, Llp | Call | 38,500 | -57.17 | 266 | -49.72 | |||
| 2025-04-30 | 13F | Cornerstone Investment Partners, LLC | 0 | -100.00 | 0 | |||||
| 2025-08-12 | 13F | Virtu Financial LLC | 37,465 | 0 | ||||||
| 2025-07-30 | 13F | FNY Investment Advisers, LLC | 71,387 | -0.54 | 0 | |||||
| 2025-05-15 | 13F | Advisors Asset Management, Inc. | 0 | -100.00 | 0 | |||||
| 2025-08-11 | 13F | Hexagon Capital Partners LLC | 0 | -100.00 | 0 | |||||
| 2025-08-14 | 13F | Prelude Capital Management, Llc | 16,064 | -30.27 | 111 | -17.78 | ||||
| 2025-08-07 | 13F | Bck Capital Management Lp | 389,770 | -30.29 | 2,693 | -18.22 | ||||
| 2025-07-31 | 13F | Caitong International Asset Management Co., Ltd | 861 | 925.00 | 6 | |||||
| 2025-07-11 | 13F | Farther Finance Advisors, LLC | 2,005 | 14 | ||||||
| 2025-08-14 | 13F | Alpine Global Management, LLC | 142,000 | -47.41 | 981 | -38.30 | ||||
| 2025-08-07 | 13F/A | Credit Industriel Et Commercial | 114,503 | 0.00 | 791 | 17.36 | ||||
| 2025-08-14 | 13F | Citadel Advisors Llc | 211,562 | 28,841.45 | 1,462 | 36,425.00 | ||||
| 2025-08-14 | 13F | Two Sigma Securities, Llc | 17,913 | 124 | ||||||
| 2025-08-14 | 13F | Citadel Advisors Llc | Put | 20,800 | 45.45 | 144 | 70.24 | |||
| 2025-07-31 | 13F | Carrera Capital Advisors | 330,881 | 164.50 | 2,286 | 210.60 | ||||
| 2025-08-06 | 13F | Harvest Portfolios Group Inc. | 40,183 | -3.76 | 278 | 13.06 | ||||
| 2025-08-14 | 13F | Citadel Advisors Llc | Call | 22,200 | 46.05 | 153 | 71.91 | |||
| 2025-08-14 | 13F | Evergreen Capital Management Llc | 10,695 | 74 | ||||||
| 2025-06-27 | NP | RNRG - Global X YieldCo & Renewable Energy Income ETF This fund is a listed as child fund of Mirae Asset Global Investments Co., Ltd. and if that institution has disclosed ownership in this security, then these positions will not be double counted when calculating total shares and total value | 61,821 | -10.22 | 394 | -11.66 | ||||
| 2025-08-14 | 13F | Caption Management, LLC | 56,271 | -35.69 | 389 | -24.66 | ||||
| 2025-08-05 | 13F | GPS Wealth Strategies Group, LLC | 0 | -100.00 | 0 | |||||
| 2025-08-14 | 13F | Royal Bank Of Canada | 1,881 | -33.98 | 13 | -23.53 | ||||
| 2025-08-13 | 13F | Quadrature Capital Ltd | 28,983 | 200 | ||||||
| 2025-08-14 | 13F | Tudor Investment Corp Et Al | 778,098 | 5.52 | 5,377 | 23.79 | ||||
| 2025-08-04 | 13F | Daymark Wealth Partners, Llc | 664,755 | -12.50 | 4,593 | 2.66 | ||||
| 2025-08-05 | 13F | Simplex Trading, Llc | 25,473 | 0 | ||||||
| 2025-08-13 | 13F | Aristides Capital LLC | 132,100 | 0.00 | 913 | 17.22 | ||||
| 2025-08-13 | 13F | Cerity Partners LLC | 26,085 | 9.33 | 180 | 28.57 | ||||
| 2025-08-14 | 13F | Caption Management, LLC | Call | 90,000 | -68.97 | 622 | -63.64 | |||
| 2025-08-12 | 13F | Proequities, Inc. | 0 | 0 | ||||||
| 2025-08-14 | 13F | Cubist Systematic Strategies, LLC | 329,873 | -13.34 | 2,279 | 1.65 | ||||
| 2025-06-30 | NP | PRFZ - Invesco FTSE RAFI US 1500 Small-Mid ETF This fund is a listed as child fund of Invesco Ltd. and if that institution has disclosed ownership in this security, then these positions will not be double counted when calculating total shares and total value | 93,763 | -28.44 | 598 | -29.56 | ||||
| 2025-08-08 | 13F | M&G Plc | 2,188,498 | 14.60 | 15,319 | 33.71 | ||||
| 2025-08-28 | NP | ECOAX - Ecofin Global Renewables Infrastructure Fund A Class | 1,743,746 | 0.00 | 12,049 | 17.32 | ||||
| 2025-08-13 | 13F | Victory Capital Management Inc | 150,304 | -0.64 | 1,039 | 16.63 | ||||
| 2025-08-13 | 13F | Norges Bank | 452,798 | 3,129 | ||||||
| 2025-08-13 | 13F | Marshall Wace, Llp | 0 | -100.00 | 0 | |||||
| 2025-08-13 | 13F | Carmignac Gestion | 50,000 | 0.00 | 346 | 17.35 | ||||
| 2025-08-13 | 13F | Centiva Capital, LP | 36,650 | 253 | ||||||
| 2025-08-14 | 13F | Point72 Asia (Singapore) Pte. Ltd. | 2,366 | 16 | ||||||
| 2025-08-12 | 13F | BlackRock, Inc. | 5,270,149 | 24.77 | 36,417 | 46.38 | ||||
| 2025-08-14 | 13F | Point72 Asset Management, L.P. | 17,400 | 120 | ||||||
| 2025-08-15 | 13F | Tower Research Capital LLC (TRC) | 3,271 | 1,535.50 | 23 | 2,100.00 | ||||
| 2025-08-18 | 13F | Wolverine Trading, Llc | Call | 0 | -100.00 | 0 | ||||
| 2025-07-23 | 13F | USCF Advisers LLC | 2,600 | 0.00 | 18 | 13.33 | ||||
| 2025-08-12 | 13F | Clear Street Markets Llc | 0 | -100.00 | 0 | |||||
| 2025-08-04 | 13F | Spire Wealth Management | 571 | 0.00 | 4 | 0.00 | ||||
| 2025-08-14 | 13F/A | Skopos Labs, Inc. | 13,239 | 1,870.09 | 91 | 2,933.33 | ||||
| 2025-08-14 | 13F | Decagon Asset Management LLP | 0 | -100.00 | 0 | |||||
| 2025-08-12 | 13F | Legal & General Group Plc | 5,117 | -89.04 | 35 | -87.23 | ||||
| 2025-08-12 | 13F | Aigen Investment Management, Lp | 10,039 | 69 | ||||||
| 2025-08-14 | 13F | Canada Pension Plan Investment Board | 76,501,166 | 0.00 | 528,623 | 17.32 | ||||
| 2025-08-13 | 13F/A | StoneX Group Inc. | 0 | -100.00 | 0 | -100.00 | ||||
| 2025-08-12 | 13F | Franklin Resources Inc | 14,187,989 | 21.81 | 98,039 | 42.91 | ||||
| 2025-06-25 | NP | CCNR - ALPS | CoreCommodity Natural Resources ETF | 90,719 | 579 | ||||||
| 2025-08-08 | 13F | Creative Planning | 83,367 | 178.94 | 576 | 227.27 | ||||
| 2025-05-15 | 13F | Manufacturers Life Insurance Company, The | 0 | -100.00 | 0 | |||||
| 2025-07-14 | 13F | Abacus Wealth Partners, LLC | 12,265 | 85 | ||||||
| 2025-07-15 | 13F | Ballentine Partners, LLC | 127,083 | 363.32 | 878 | 445.34 | ||||
| 2025-08-13 | 13F | Northern Trust Corp | 145,518 | 82.44 | 1,006 | 114.29 | ||||
| 2025-06-30 | NP | PBW - Invesco WilderHill Clean Energy ETF This fund is a listed as child fund of Invesco Ltd. and if that institution has disclosed ownership in this security, then these positions will not be double counted when calculating total shares and total value | 738,001 | 19.56 | 4,708 | 17.73 | ||||
| 2025-07-08 | 13F | Parallel Advisors, LLC | 11,041 | 765.96 | 76 | 985.71 | ||||
| 2025-07-14 | 13F | UMA Financial Services, Inc. | 522 | 4 | ||||||
| 2025-07-31 | 13F | State of New Jersey Common Pension Fund D | 649,491 | 0.00 | 4,488 | 17.31 | ||||
| 2025-08-15 | 13F | CI Private Wealth, LLC | 28,643 | 6.90 | 198 | 25.48 | ||||
| 2025-08-07 | 13F | Readystate Asset Management Lp | 93,736 | 648 | ||||||
| 2025-08-11 | 13F | Covestor Ltd | 12,135 | 0.00 | 0 | |||||
| 2025-08-14 | 13F | Jane Street Group, Llc | Call | 25,000 | -75.25 | 173 | -71.04 | |||
| 2025-08-14 | 13F | Verition Fund Management LLC | 476,871 | -23.20 | 3,295 | -9.90 | ||||
| 2025-08-14 | 13F | Jane Street Group, Llc | 109,422 | 483.93 | 756 | 587.27 | ||||
| 2025-08-13 | 13F | Quadrant Capital Group Llc | 22,483 | -45.43 | 155 | -35.95 | ||||
| 2025-07-25 | 13F | Atria Wealth Solutions, Inc. | 0 | -100.00 | 0 | |||||
| 2025-08-14 | 13F | PDT Partners, LLC | 63,062 | -39.71 | 436 | -29.38 | ||||
| 2025-05-14 | 13F | Walleye Capital LLC | 0 | -100.00 | 0 | |||||
| 2025-08-12 | 13F | Jpmorgan Chase & Co | 642,397 | 94.02 | 4,439 | 127.59 | ||||
| 2025-08-11 | 13F | Citigroup Inc | 481,629 | 35.91 | 3,328 | 59.46 | ||||
| 2025-08-13 | 13F | Invesco Ltd. | 1,873,804 | -24.33 | 12,948 | -11.23 | ||||
| 2025-08-14 | 13F | Decagon Asset Management LLP | Put | 0 | -100.00 | 0 | ||||
| 2025-08-14 | 13F | D. E. Shaw & Co., Inc. | 192,706 | -27.84 | 1,332 | -15.33 | ||||
| 2025-07-30 | 13F | Evermay Wealth Management Llc | 30,000 | 0.00 | 207 | 17.61 | ||||
| 2025-08-14 | 13F | Hrt Financial Lp | 176,268 | 1 | ||||||
| 2025-08-13 | 13F | Renaissance Technologies Llc | 116,800 | 237.57 | 807 | 297.54 | ||||
| 2025-08-14 | 13F | Alliancebernstein L.p. | 25,961 | 7.16 | 179 | 26.06 | ||||
| 2025-08-14 | 13F | Mercer Global Advisors Inc /adv | 0 | -100.00 | 0 | |||||
| 2025-08-14 | 13F | State Street Corp | 481,674 | -31.89 | 3,328 | -20.10 | ||||
| 2025-08-04 | 13F | GAM Holding AG | 190,000 | 18.75 | 1,313 | 39.28 | ||||
| 2025-08-14 | 13F | MIRAE ASSET GLOBAL ETFS HOLDINGS Ltd. | 88,237 | -12.95 | 610 | 2.01 | ||||
| 2025-08-14 | 13F | Bank Of America Corp /de/ | 122,613 | -60.44 | 847 | -53.59 | ||||
| 2025-08-14 | 13F | Aperture Investors, LLC | 408,003 | -32.54 | 2,819 | -20.86 | ||||
| 2025-08-14 | 13F | Group One Trading, L.p. | 3,528 | -85.92 | 24 | -83.67 | ||||
| 2025-08-14 | 13F | MSD Partners, L.P. | 2,091,480 | 0.00 | 14,452 | 17.32 | ||||
| 2025-07-22 | 13F | Gsa Capital Partners Llp | 147,184 | 1 | ||||||
| 2025-08-01 | 13F | Jennison Associates Llc | 17,102 | -47.11 | 118 | -37.89 | ||||
| 2025-08-08 | 13F | Fiera Capital Corp | 0 | -100.00 | 0 | |||||
| 2025-08-14 | 13F | Moore Capital Management, Lp | 0 | -100.00 | 0 | |||||
| 2025-07-30 | NP | WNDY - Global X Wind Energy ETF This fund is a listed as child fund of Mirae Asset Global Investments Co., Ltd. and if that institution has disclosed ownership in this security, then these positions will not be double counted when calculating total shares and total value | 7,759 | -10.05 | 53 | -3.70 | ||||
| 2025-08-15 | 13F | WealthCollab, LLC | 3,145 | 0.00 | 22 | 16.67 | ||||
| 2025-08-14 | 13F | Toroso Investments, LLC | 13,153 | 15.37 | 91 | 34.33 | ||||
| 2025-08-12 | 13F | PSI Advisors, LLC | 0 | -100.00 | 0 | |||||
| 2025-08-12 | 13F | XTX Topco Ltd | 0 | -100.00 | 0 | |||||
| 2025-08-14 | 13F | LMR Partners LLP | 250,000 | 0.00 | 1,728 | 17.32 | ||||
| 2025-08-08 | 13F | SBI Securities Co., Ltd. | 0 | -100.00 | 0 | |||||
| 2025-07-10 | 13F | TT International Asset Management LTD | 184,695 | -38.72 | 28,833 | 1,524.34 | ||||
| 2025-08-01 | 13F | Envestnet Asset Management Inc | 29,343 | -19.85 | 203 | -6.05 | ||||
| 2025-08-13 | 13F | Tejara Capital Ltd | 412,512 | -26.89 | 2,850 | -14.23 | ||||
| 2025-08-05 | 13F | Bank Of Montreal /can/ | 14,354 | 1.18 | 99 | 19.28 | ||||
| 2025-07-24 | 13F | Us Bancorp \de\ | 1,689 | -33.11 | 12 | -21.43 | ||||
| 2025-08-14 | 13F | Gotham Asset Management, LLC | 11,386 | 79 | ||||||
| 2025-08-14 | 13F | Parallax Volatility Advisers, L.P. | 16,478 | 114 | ||||||
| 2025-08-14 | 13F | Parallax Volatility Advisers, L.P. | Put | 154,700 | 1,069 | |||||
| 2025-08-14 | 13F/A | Barclays Plc | 35,440 | 139.90 | 0 | |||||
| 2025-08-14 | 13F | Mariner, LLC | 81,109 | 162.20 | 560 | 207.69 | ||||
| 2025-08-08 | 13F | Helikon Investments Ltd | 0 | -100.00 | 0 | |||||
| 2025-08-14 | 13F | Weiss Asset Management LP | 60,264 | -53.64 | 416 | -45.62 | ||||
| 2025-05-05 | 13F | Lindbrook Capital, Llc | 4,456 | 230.07 | 26 | 188.89 |
Other Listings
| DE:7JU | € 6.26 |