Mga Batayang Estadistika
| Pemilik Institusional | 200 total, 200 long only, 0 short only, 0 long/short - change of 0.00% MRQ |
| Alokasi Portofolio Rata-rata | 0.1326 % - change of 6.55% MRQ |
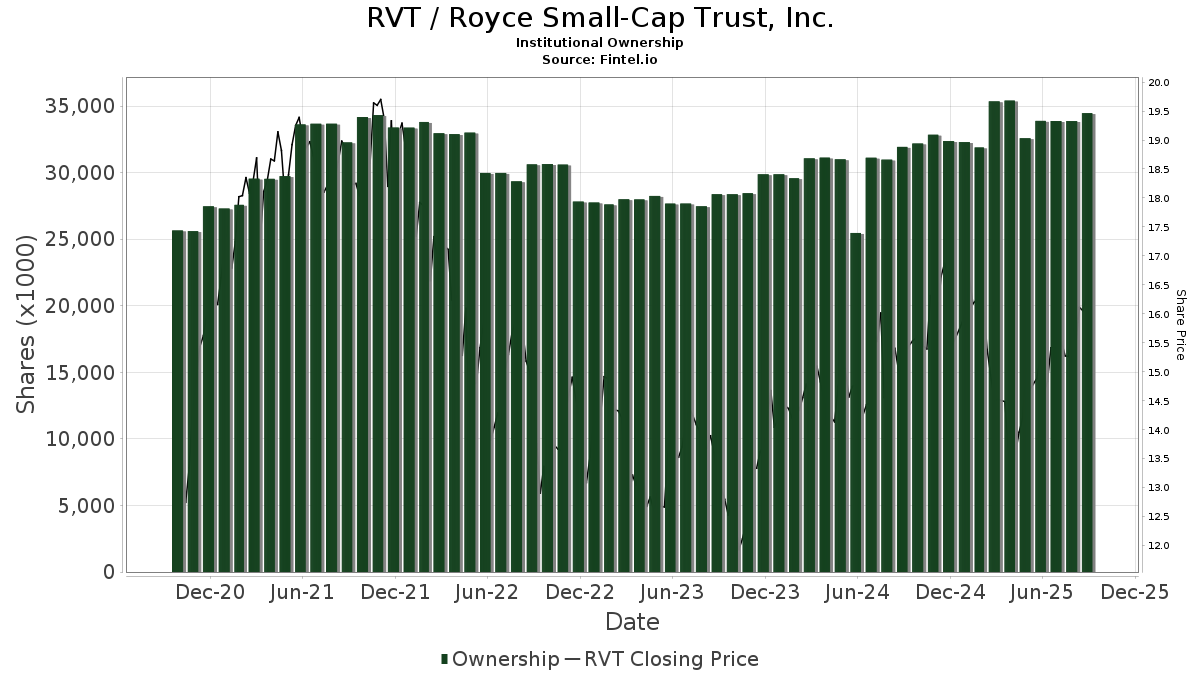
| Saham Institusional (Jangka Panjang) | 34,470,518 (ex 13D/G) - change of 0.59MM shares 1.74% MRQ |
| Nilai Institusional (Jangka Panjang) | $ 485,466 USD ($1000) |
Kepemilikan Institusional dan Pemegang Saham
Royce Small-Cap Trust, Inc. (US:RVT) memiliki 200 pemilik institusional dan pemegang saham yang telah mengajukan formulir 13D/G atau 13F kepada Komisi Bursa Efek (Securities Exchange Commission/SEC). Lembaga-lembaga ini memegang total 34,470,518 saham. Pemegang saham terbesar meliputi Bank Of America Corp /de/, Morgan Stanley, Raymond James Financial Inc, LPL Financial LLC, Wells Fargo & Company/mn, Royal Bank Of Canada, Stifel Financial Corp, UBS Group AG, Janney Montgomery Scott LLC, and Shaker Financial Services, LLC .
Struktur kepemilikan institusional Royce Small-Cap Trust, Inc. (NYSE:RVT) menunjukkan posisi terkini di perusahaan oleh institusi dan dana, serta perubahan terbaru dalam ukuran posisi. Pemegang saham utama dapat mencakup investor individu, reksa dana, dana lindung nilai, atau institusi. Jadwal 13D menunjukkan bahwa investor memegang (atau pernah memegang) lebih dari 5% saham perusahaan dan bermaksud (atau pernah bermaksud) untuk secara aktif mengejar perubahan strategi bisnis. Jadwal 13G menunjukkan investasi pasif lebih dari 5%.
The share price as of September 5, 2025 is 16.36 / share. Previously, on September 9, 2024, the share price was 14.68 / share. This represents an increase of 11.44% over that period.
Skor Sentimen Dana
Skor Sentimen Dana (sebelumnya dikenal sebagai Skor Akumulasi Kepemilikan) menemukan saham-saham yang paling banyak dibeli oleh dana. Ini adalah hasil dari model kuantitatif multi-faktor yang canggih yang mengidentifikasi perusahaan dengan tingkat akumulasi institusional tertinggi. Model penilaian menggunakan kombinasi dari total peningkatan pemilik yang diungkapkan, perubahan dalam alokasi portofolio pada pemilik tersebut, dan metrik lainnya. Angka berkisar dari 0 hingga 100, dengan angka yang lebih tinggi menunjukkan tingkat akumulasi yang lebih tinggi dibandingkan dengan perusahaan sejenisnya, dan 50 adalah rata-ratanya.
Frekuensi Pembaruan: Setiap Hari
Lihat Ownership Explorer, yang menyediakan daftar perusahaan dengan peringkat tertinggi.
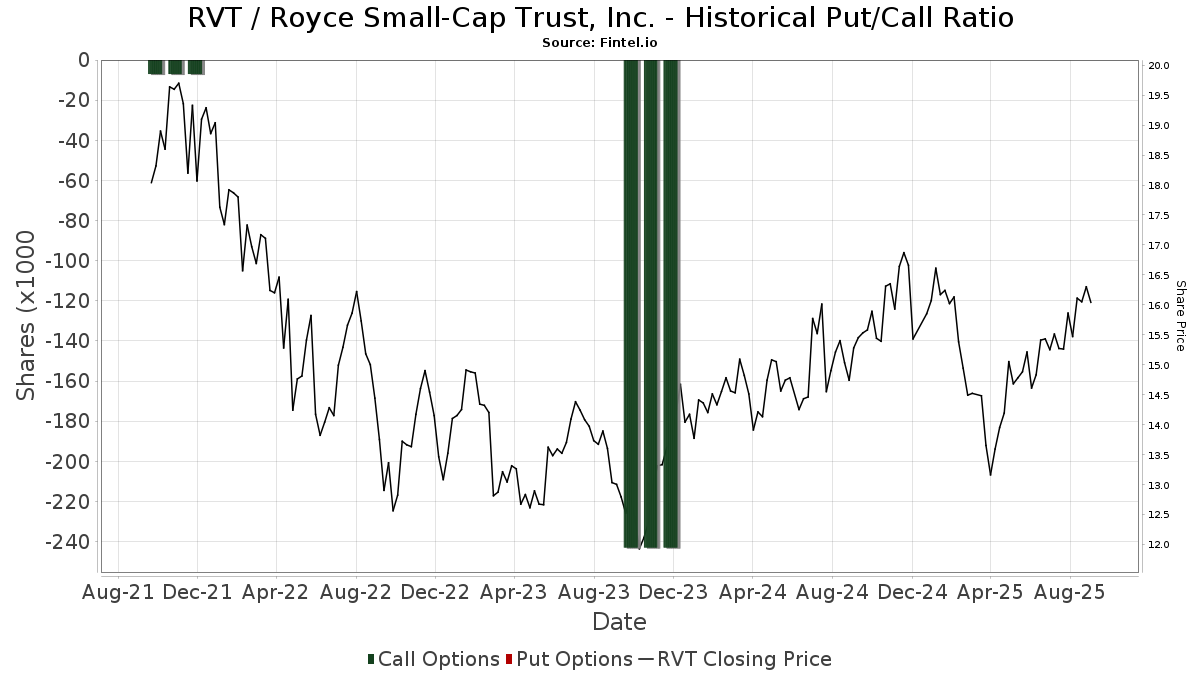
Rasio Put/Call Institusional
Selain melaporkan isu ekuitas dan utang standar, institusi dengan aset di bawah manajemen lebih dari 100 juta dolar AS juga harus mengungkapkan kepemilikan opsi put dan call mereka. Karena opsi put umumnya menunjukkan sentimen negatif, dan opsi call menunjukkan sentimen positif, kita dapat mengetahui sentimen institusional secara keseluruhan dengan memplot rasio put terhadap call. Grafik di sebelah kanan memplot rasio put/call historis untuk instrumen ini.
Menggunakan Rasio Put/Call sebagai indikator sentimen investor mengatasi salah satu kekurangan utama dari penggunaan total kepemilikan institusional, yaitu sejumlah besar aset yang dikelola diinvestasikan secara pasif untuk melacak indeks. Dana yang dikelola secara pasif biasanya tidak membeli opsi, sehingga indikator rasio put/call lebih akurat dalam melacak sentimen dana yang dikelola secara aktif.
Pengajuan 13D/G
Kami menyajikan pengajuan 13D/G secara terpisah dari pengajuan 13F karena perlakuan yang berbeda oleh SEC. Pengajuan 13D/G dapat diajukan oleh kelompok investor (dengan satu pemimpin), sedangkan pengajuan 13F tidak bisa. Hal ini mengakibatkan situasi di mana seorang investor dapat mengajukan 13D/G yang melaporkan satu nilai untuk total saham (mewakili semua saham yang dimiliki oleh kelompok investor), tetapi kemudian mengajukan 13F yang melaporkan nilai yang berbeda untuk total saham (mewakili kepemilikan mereka sendiri). Ini berarti bahwa kepemilikan saham dari pengajuan 13D/G dan pengajuan 13F seringkali tidak dapat dibandingkan secara langsung, sehingga kami menyajikannya secara terpisah.
Catatan: Mulai 16 Mei 2021, kami tidak lagi menampilkan pemilik yang belum mengajukan 13D/G dalam setahun terakhir. Sebelumnya, kami menampilkan riwayat lengkap pengajuan 13D/G. Secara umum, entitas yang diwajibkan untuk mengajukan pengajuan 13D/G harus mengajukan setidaknya setiap tahun sebelum mengirimkan pengajuan penutupan. Namun, terkadang dana keluar dari posisi tanpa mengirimkan pengajuan penutupan (misalnya, mereka menghentikan operasi), sehingga menampilkan riwayat lengkap terkadang menyebabkan kebingungan tentang kepemilikan saat ini. Untuk mencegah kebingungan, kami sekarang hanya menampilkan pemilik 'saat ini' - yaitu - pemilik yang telah mengajukan dalam setahun terakhir.
Upgrade to unlock premium data.
| Tanggal File | Formulir | Investor | Sebelumnya Saham |
Terbaru Saham |
Δ Saham (Persen) |
Kepemilikan (Persen) |
Δ Pagmamay-ari (Persen) |
|
|---|---|---|---|---|---|---|---|---|
| 2025-02-14 | BANK OF AMERICA CORP /DE/ | 5,761,382 | 5,848,923 | 1.52 | 5.10 | 2.00 | ||
| 2024-11-08 | MORGAN STANLEY | 4,761,016 | 6,058,260 | 27.25 | 5.30 | 20.45 |
Pengajuan 13F dan NPORT
Detail pada pengajuan 13F tersedia gratis. Detail pada pengajuan NP memerlukan keanggotaan premium. Baris berwarna hijau menunjukkan posisi baru. Baris berwarna merah menunjukkan posisi yang sudah ditutup. Klik tautan ini ikon untuk melihat riwayat transaksi selengkapnya.
Tingkatkan
untuk membuka data premium dan mengekspor ke Excel ![]() .
.
| Tanggal File | Sumber | Investor | Ketik | Presyo ng Avg (Silangan) |
Saham | Δ Saham (%) |
Dilaporkan Nilai ($1000) |
Nilai Δ (%) |
Alokasi Port (%) |
|
|---|---|---|---|---|---|---|---|---|---|---|
| 2025-08-06 | 13F | Wedbush Securities Inc | 23,533 | -5.75 | 0 | |||||
| 2025-08-11 | 13F | Private Advisor Group, LLC | 158,192 | 1.33 | 2,381 | 7.06 | ||||
| 2025-07-16 | 13F | Kennedy Investment Group | 80,701 | -4.00 | 1,215 | 1.42 | ||||
| 2025-07-18 | 13F | Truist Financial Corp | 10,376 | 156 | ||||||
| 2025-08-08 | 13F | Creative Planning | 12,006 | 0.04 | 181 | 5.88 | ||||
| 2025-08-14 | 13F | Stifel Financial Corp | 754,541 | -14.80 | 11,356 | -9.95 | ||||
| 2025-07-31 | 13F | Curio Wealth, Llc | 0 | -100.00 | 0 | |||||
| 2025-07-29 | 13F | Uhlmann Price Securities, Llc | 11,847 | -8.00 | 178 | -2.73 | ||||
| 2025-08-06 | 13F | Commonwealth Equity Services, Llc | 134,731 | -2.05 | 2 | 100.00 | ||||
| 2025-08-04 | 13F | Wolverine Asset Management Llc | 163,139 | 1,982.45 | 2,455 | 2,111.71 | ||||
| 2025-08-14 | 13F | Warren Averett Asset Management, LLC | 48,383 | -5.85 | 728 | -0.41 | ||||
| 2025-07-09 | 13F | David J Yvars Group | 29,514 | 4.79 | 442 | 10.22 | ||||
| 2025-08-15 | 13F | Tower Research Capital LLC (TRC) | 16 | 0 | ||||||
| 2025-08-14 | 13F | Comerica Bank | 78,444 | -8.66 | 1,181 | -3.44 | ||||
| 2025-08-04 | 13F | Waterfront Wealth Inc. | 481,428 | 9.05 | 7,245 | 15.26 | ||||
| 2025-08-14 | 13F | Intrepid Family Office Llc | 50,000 | 752 | ||||||
| 2025-08-05 | 13F | Bank Of Montreal /can/ | 34,560 | -3.63 | 520 | 1.96 | ||||
| 2025-08-13 | 13F | Colonial Trust Advisors | 3,508 | 53 | ||||||
| 2025-07-21 | 13F | Fortis Capital Advisors, LLC | 0 | -100.00 | 0 | |||||
| 2025-08-12 | 13F | North Star Asset Management Inc | 13,197 | 0.00 | 199 | 5.88 | ||||
| 2025-08-14 | 13F | Heritage Wealth Management, Inc. | 33,618 | -26.89 | 506 | -22.78 | ||||
| 2025-08-04 | 13F | Hantz Financial Services, Inc. | 500 | 0 | ||||||
| 2025-08-14 | 13F | Coastal Bridge Advisors, LLC | 10,695 | 0.00 | 161 | 5.26 | ||||
| 2025-07-28 | 13F | Harbour Investments, Inc. | 124 | 0.00 | 2 | 0.00 | ||||
| 2025-08-01 | 13F | Envestnet Asset Management Inc | 29,640 | 25.65 | 446 | 33.13 | ||||
| 2025-07-18 | 13F | Consolidated Portfolio Review Corp | 107,300 | 131.25 | 1,615 | 144.55 | ||||
| 2025-08-14 | 13F | Modern Wealth Management, LLC | 514,049 | -4.86 | 7,736 | 0.55 | ||||
| 2025-08-08 | 13F | Sittner & Nelson, Llc | 9,713 | 2.00 | 146 | 8.15 | ||||
| 2025-08-12 | 13F | Cutter & CO Brokerage, Inc. | 0 | -100.00 | 0 | |||||
| 2025-06-27 | NP | Calamos ETF Trust - Calamos CEF Income & Arbitrage ETF | 25,064 | -27.40 | 350 | -37.90 | ||||
| 2025-08-05 | 13F | Alexander Randolph Advisory Inc | 32,233 | 2.00 | 485 | 8.02 | ||||
| 2025-08-04 | 13F | Creative Financial Designs Inc /adv | 363 | 0.00 | 5 | 0.00 | ||||
| 2025-07-10 | 13F | Stolper Co | 50,531 | 3.48 | 1 | |||||
| 2025-08-14 | 13F | Pingora Partners LLC | 3,733 | 0.00 | 56 | 5.66 | ||||
| 2025-08-12 | 13F | CIBC Private Wealth Group, LLC | 407 | 0.00 | 6 | 20.00 | ||||
| 2025-05-15 | 13F | Talon Private Wealth, LLC | 0 | -100.00 | 0 | -100.00 | ||||
| 2025-07-23 | 13F | Mraz, Amerine & Associates, Inc. | 54,025 | -4.10 | 813 | 1.37 | ||||
| 2025-08-22 | NP | Cornerstone Total Return Fund Inc | 44,000 | 662 | ||||||
| 2025-08-12 | 13F | Fca Corp /tx | 14,843 | 1.92 | 223 | 7.73 | ||||
| 2025-08-14 | 13F | Jane Street Group, Llc | 51,579 | 295.18 | 776 | 319.46 | ||||
| 2025-07-17 | 13F | Vermillion Wealth Management, Inc. | 1,834 | 0.00 | 28 | 3.85 | ||||
| 2025-05-09 | 13F | Pathway Financial Advisers, LLC | 0 | -100.00 | 0 | |||||
| 2025-08-12 | 13F | Tradition Wealth Management, LLC | 12,570 | -5.04 | 189 | 0.53 | ||||
| 2025-08-14 | 13F | Kovitz Investment Group Partners, LLC | 11,723 | 0.00 | 176 | 6.02 | ||||
| 2025-08-14 | 13F | Raymond James Financial Inc | 3,174,507 | 6.68 | 47,776 | 12.75 | ||||
| 2025-08-14 | 13F | Bank Of America Corp /de/ | 6,293,535 | 0.87 | 94,718 | 6.61 | ||||
| 2025-08-27 | NP | RYMSX - Guggenheim Multi-Hedge Strategies Fund Class P | 92 | -83.75 | 1 | -87.50 | ||||
| 2025-07-29 | 13F | Stephens Inc /ar/ | 15,244 | 1.84 | 229 | 7.51 | ||||
| 2025-07-21 | 13F | Barrett & Company, Inc. | 14,470 | 5.53 | 218 | 11.28 | ||||
| 2025-08-29 | NP | AIIFX - Timber Point Alternative Income Fund Institutional Class Shares | 24,975 | 0.00 | 376 | 5.63 | ||||
| 2025-08-12 | 13F | J.w. Cole Advisors, Inc. | 27,829 | -2.15 | 419 | 3.47 | ||||
| 2025-08-29 | NP | CGHIX - Timber Point Global Allocations Fund Institutional Class Shares | 16,668 | 0.00 | 251 | 5.49 | ||||
| 2025-07-11 | 13F | Seacrest Wealth Management, Llc | 58,168 | 0.66 | 875 | 6.45 | ||||
| 2025-07-22 | 13F | Beacon Financial Advisory LLC | 16,095 | 3.01 | 242 | 9.01 | ||||
| 2025-08-01 | 13F | Redmond Asset Management, LLC | 17,900 | 0.00 | 269 | 5.91 | ||||
| 2025-08-28 | NP | YYY - Amplify High Income ETF | 321,299 | 1.99 | 4,836 | 7.78 | ||||
| 2025-08-11 | 13F | Advisor Resource Council | 0 | -100.00 | 0 | |||||
| 2025-07-29 | 13F | Mezzasalma Advisors, LLC | 24,783 | 1.66 | 373 | 7.20 | ||||
| 2025-08-14 | 13F | Operose Advisors LLC | 7,000 | 0.00 | 105 | 6.06 | ||||
| 2025-08-18 | 13F/A | National Bank Of Canada /fi/ | 407 | 0.00 | 6 | 20.00 | ||||
| 2025-07-22 | 13F | SOL Capital Management CO | 31,345 | -40.45 | 0 | |||||
| 2025-07-08 | 13F | Parisi Gray Wealth Management | 12,353 | 2.00 | 186 | 7.56 | ||||
| 2025-08-13 | 13F | Level Four Advisory Services, Llc | 22,337 | -10.77 | 336 | -5.62 | ||||
| 2025-08-14 | 13F | Wiley Bros.-aintree Capital, Llc | 57,584 | 107.94 | 867 | 119.80 | ||||
| 2025-04-23 | 13F | Chapin Davis, Inc. | 0 | -100.00 | 0 | -100.00 | ||||
| 2025-08-12 | 13F | Country Trust Bank | 306 | 5 | ||||||
| 2025-08-19 | 13F | National Asset Management, Inc. | 0 | -100.00 | 0 | |||||
| 2025-07-07 | 13F | RB Capital Management, LLC | 164,625 | -3.25 | 2,478 | 2.27 | ||||
| 2025-08-07 | 13F | Samalin Investment Counsel, LLC | 75,679 | 2.55 | 1,139 | 8.38 | ||||
| 2025-08-12 | 13F | Financial Advocates Investment Management | 0 | -100.00 | 0 | |||||
| 2025-04-16 | 13F | Dover Advisors, Llc | 0 | -100.00 | 0 | |||||
| 2025-08-08 | 13F | 1776 Wealth LLC | 32,199 | 0.46 | 485 | 6.14 | ||||
| 2025-08-13 | 13F | Baird Financial Group, Inc. | 21,735 | 2.13 | 327 | 7.92 | ||||
| 2025-07-29 | 13F | International Assets Investment Management, Llc | 22,573 | -9.55 | 340 | -4.51 | ||||
| 2025-08-05 | 13F | Tiaa Trust, National Association | 14,595 | 2.00 | 220 | 7.88 | ||||
| 2025-07-09 | 13F | Triumph Capital Management | 50,318 | -19.66 | 757 | -15.04 | ||||
| 2025-08-08 | 13F | Cornerstone Advisors, LLC | 118,943 | 1,790 | ||||||
| 2025-07-08 | 13F | Ransom Advisory, Ltd | 600 | 0.00 | 9 | 12.50 | ||||
| 2025-07-21 | 13F | Quent Capital, LLC | 0 | -100.00 | 0 | |||||
| 2025-08-11 | 13F | HighTower Advisors, LLC | 157,963 | 6.54 | 2,377 | 12.60 | ||||
| 2025-07-17 | 13F | Uncommon Cents Investing LLC | 24,674 | -5.08 | 371 | 0.27 | ||||
| 2025-08-04 | 13F | HBK Sorce Advisory LLC | 18,895 | -0.01 | 284 | 5.58 | ||||
| 2025-08-06 | 13F | SOUTH STATE Corp | 19,972 | 0.00 | 301 | 5.63 | ||||
| 2025-08-12 | 13F | Proequities, Inc. | 0 | 0 | ||||||
| 2025-08-12 | 13F | LPL Financial LLC | 2,045,622 | 6.56 | 30,787 | 12.62 | ||||
| 2025-07-21 | 13F | Cliftonlarsonallen Wealth Advisors, Llc | 0 | -100.00 | 0 | |||||
| 2025-08-11 | 13F | Hexagon Capital Partners LLC | 0 | -100.00 | 0 | |||||
| 2025-07-22 | 13F | Miracle Mile Advisors, LLC | 65,470 | 0.00 | 985 | 5.69 | ||||
| 2025-08-14 | 13F | UBS Group AG | 701,901 | -6.34 | 10,564 | -1.01 | ||||
| 2025-08-14 | 13F | Smartleaf Asset Management LLC | 0 | -100.00 | 0 | |||||
| 2025-08-07 | 13F | CENTRAL TRUST Co | 1,000 | 0.00 | 15 | 7.14 | ||||
| 2025-08-14 | 13F/A | Skopos Labs, Inc. | 500 | 8 | ||||||
| 2025-07-24 | 13F | Us Bancorp \de\ | 790 | -23.89 | 12 | -21.43 | ||||
| 2025-08-13 | 13F | Jones Financial Companies Lllp | 70 | -72.76 | 1 | -66.67 | ||||
| 2025-08-14 | 13F | Royal Bank Of Canada | 1,572,621 | -1.80 | 23,668 | 3.79 | ||||
| 2025-08-07 | 13F | Hennion & Walsh Asset Management, Inc. | 113,273 | 1.99 | 1,705 | 7.78 | ||||
| 2025-08-13 | 13F | Brown Advisory Inc | 24,801 | 69.78 | 373 | 79.33 | ||||
| 2025-07-25 | 13F | Cwm, Llc | 1,687 | 0 | ||||||
| 2025-08-13 | 13F | Gabelli Funds Llc | 85,900 | -14.66 | 1,293 | -9.84 | ||||
| 2025-08-11 | 13F | Blue Bell Private Wealth Management, Llc | 492,176 | 4.13 | 7,407 | 10.06 | ||||
| 2025-07-25 | 13F | We Are One Seven, LLC | 42,605 | -4.36 | 641 | 1.10 | ||||
| 2025-08-14 | 13F | Mercer Global Advisors Inc /adv | 29,901 | 109.13 | 450 | 121.67 | ||||
| 2025-08-22 | NP | Cornerstone Strategic Value Fund Inc | 74,943 | -82.36 | 1,128 | -81.66 | ||||
| 2025-08-13 | 13F | Northwestern Mutual Wealth Management Co | 10,689 | -79.67 | 161 | -78.61 | ||||
| 2025-08-08 | 13F | City Of London Investment Management Co Ltd | 44,191 | -1.84 | 665 | 3.74 | ||||
| 2025-08-07 | 13F | Sierra Ocean, Llc | 19,563 | 0.00 | 292 | 3.19 | ||||
| 2025-08-08 | 13F | Cetera Investment Advisers | 36,282 | 7.38 | 546 | 13.51 | ||||
| 2025-08-11 | 13F | Keyes, Stange & Wooten Wealth Management, LLC | 15,695 | 11.73 | 236 | 18.00 | ||||
| 2025-08-12 | 13F | Park Square Financial Group, LLC | 488 | -26.40 | 7 | -22.22 | ||||
| 2025-08-07 | 13F | Verus Capital Partners, Llc | 16,687 | 1.60 | 251 | 7.73 | ||||
| 2025-08-12 | 13F | Jpmorgan Chase & Co | 0 | -100.00 | 0 | |||||
| 2025-08-07 | 13F | Vista Investment Partners Ii, Llc | 23,394 | -0.03 | 352 | 5.71 | ||||
| 2025-08-07 | 13F | Hughes Financial Services, LLC | 1,617 | 0.00 | 25 | 4.35 | ||||
| 2025-08-14 | 13F | Susquehanna International Group, Llp | 17,932 | 34.98 | 270 | 42.33 | ||||
| 2025-08-12 | 13F | Jaffetilchin Investment Partners, LLC | 11,515 | 173 | ||||||
| 2025-07-15 | 13F | Focused Wealth Management, Inc | 64,389 | 2.66 | 969 | 8.51 | ||||
| 2025-08-12 | 13F | Inscription Capital, LLC | 0 | -100.00 | 0 | |||||
| 2025-08-04 | 13F | Assetmark, Inc | 1,319 | 60.46 | 20 | 72.73 | ||||
| 2025-05-15 | 13F | 1607 Capital Partners, LLC | 0 | -100.00 | 0 | -100.00 | ||||
| 2025-08-12 | 13F | NorthStar Asset Management LLC /NJ/ | 10,329 | 1.99 | 155 | 7.64 | ||||
| 2025-04-28 | 13F | American Capital Advisory, LLC | 0 | -100.00 | 0 | |||||
| 2025-08-12 | 13F | Coldstream Capital Management Inc | 0 | -100.00 | 0 | |||||
| 2025-08-28 | NP | Rivernorth Opportunities Fund, Inc. | 11,271 | 170 | ||||||
| 2025-08-06 | 13F | Penserra Capital Management LLC | 324,599 | 3.04 | 5 | 0.00 | ||||
| 2025-08-11 | 13F | Tidemark, LLC | 102 | 2 | ||||||
| 2025-04-30 | 13F | Stratos Wealth Partners, LTD. | 0 | -100.00 | 0 | |||||
| 2025-08-11 | 13F | Principal Securities, Inc. | 3,889 | 14.45 | 59 | 9.43 | ||||
| 2025-08-14 | 13F | Cohen & Steers, Inc. | 35,521 | -74.41 | 1 | -100.00 | ||||
| 2025-05-12 | 13F | Fmr Llc | 0 | -100.00 | 0 | |||||
| 2025-05-12 | 13F | Independent Advisor Alliance | 0 | -100.00 | 0 | |||||
| 2025-08-05 | 13F | Carolinas Wealth Consulting Llc | 0 | -100.00 | 0 | -100.00 | ||||
| 2025-07-08 | 13F | Nbc Securities, Inc. | 561 | 2.00 | 0 | |||||
| 2025-08-29 | NP | Gabelli Equity Trust Inc | 45,900 | -0.56 | 691 | 5.02 | ||||
| 2025-07-17 | 13F | Janney Montgomery Scott LLC | 693,008 | 38.04 | 10 | 42.86 | ||||
| 2025-07-15 | 13F | North Star Investment Management Corp. | 6,125 | 0.00 | 92 | 5.75 | ||||
| 2025-07-31 | 13F | Oppenheimer & Co Inc | 210,890 | 1.32 | 3,174 | 7.09 | ||||
| 2025-08-13 | 13F | Walleye Capital LLC | 51,507 | 775 | ||||||
| 2025-08-11 | 13F | Elequin Capital Lp | 29,323 | 2,476.71 | 441 | 2,656.25 | ||||
| 2025-05-15 | 13F | EP Wealth Advisors, Inc. | 0 | -100.00 | 0 | |||||
| 2025-07-18 | 13F | Benchmark Wealth Management, LLC | 12,620 | -0.75 | 190 | 4.42 | ||||
| 2025-07-22 | 13F | DAVENPORT & Co LLC | 10,468 | 0.27 | 158 | 6.08 | ||||
| 2025-07-29 | 13F | Salomon & Ludwin, LLC | 2,976 | 0.00 | 46 | 7.14 | ||||
| 2025-08-12 | 13F | Jacobi Capital Management LLC | 0 | -100.00 | 0 | |||||
| 2025-05-15 | 13F | Concorde Asset Management, LLC | 43,942 | 12.23 | 600 | -3.07 | ||||
| 2025-08-08 | 13F | Pnc Financial Services Group, Inc. | 11,492 | 0.00 | 173 | 5.52 | ||||
| 2025-08-05 | 13F | Key FInancial Inc | 31 | 0.00 | 0 | |||||
| 2025-08-12 | 13F | PKS Advisory Services, LLC | 0 | -100.00 | 0 | |||||
| 2025-08-05 | 13F | Shaker Financial Services, LLC | 585,074 | 105.72 | 8,805 | 117.46 | ||||
| 2025-08-13 | 13F | EverSource Wealth Advisors, LLC | 1,750 | 0.00 | 26 | 8.33 | ||||
| 2025-08-13 | 13F | Guggenheim Capital Llc | 460,280 | -1.67 | 6,927 | 3.93 | ||||
| 2025-08-11 | 13F | Nations Financial Group Inc, /ia/ /adv | 47,930 | -5.24 | 721 | 0.14 | ||||
| 2025-07-25 | 13F | Apollon Wealth Management, LLC | 42,950 | 0.06 | 646 | 5.73 | ||||
| 2025-08-15 | 13F | Captrust Financial Advisors | 270,822 | 3.04 | 4,076 | 8.90 | ||||
| 2025-07-07 | 13F | Centurion Wealth Management LLC | 13,451 | 0.00 | 202 | -4.72 | ||||
| 2025-08-15 | 13F | Kestra Advisory Services, LLC | 17,578 | 9.21 | 265 | 15.28 | ||||
| 2025-04-01 | 13F | First Financial Bank - Trust Division | 0 | -100.00 | 0 | |||||
| 2025-07-23 | 13F | Abel Hall, LLC | 57,000 | 159.09 | 858 | 173.80 | ||||
| 2025-08-04 | 13F | Kovack Advisors, Inc. | 10,467 | -9.73 | 158 | -4.85 | ||||
| 2025-08-12 | 13F | NWF Advisory Services Inc. | 60,375 | 161.89 | 860 | 135.99 | ||||
| 2025-08-19 | 13F | Newbridge Financial Services Group, Inc. | 1,874 | 28 | ||||||
| 2025-08-04 | 13F | Daymark Wealth Partners, Llc | 23,794 | 0.16 | 358 | 5.92 | ||||
| 2025-05-15 | 13F | Gwn Securities Inc. | 0 | -100.00 | 0 | |||||
| 2025-08-08 | 13F | Larson Financial Group LLC | 81 | 0.00 | 1 | 0.00 | ||||
| 2025-08-07 | 13F | Allworth Financial LP | 21,598 | 97.93 | 325 | 116.67 | ||||
| 2025-08-12 | 13F | Advisors Asset Management, Inc. | 495,620 | -17.99 | 7,459 | -13.32 | ||||
| 2025-07-16 | 13F | Brown, Lisle/cummings, Inc. | 2,900 | 0.00 | 44 | 4.88 | ||||
| 2025-07-22 | 13F | Mascoma Wealth Management LLC | 10,217 | 0.00 | 154 | 5.52 | ||||
| 2025-08-01 | 13F | General American Investors Co Inc | 150,877 | 0.00 | 2,271 | 5.68 | ||||
| 2025-08-05 | 13F | GPS Wealth Strategies Group, LLC | 339 | 1.80 | 5 | 25.00 | ||||
| 2025-07-31 | 13F | Cambridge Investment Research Advisors, Inc. | 121,530 | -2.40 | 2 | 0.00 | ||||
| 2025-07-22 | 13F | Accel Wealth Management | 105,628 | 3.35 | 1,590 | 9.21 | ||||
| 2025-08-07 | 13F | Readystate Asset Management Lp | 232,709 | 3,502 | ||||||
| 2025-07-08 | 13F/A | Salem Investment Counselors Inc | 4,047 | 0.00 | 61 | 5.26 | ||||
| 2025-08-01 | 13F | Chilton Capital Management Llc | 0 | -100.00 | 0 | |||||
| 2025-08-13 | 13F | Invesco Ltd. | 0 | -100.00 | 0 | |||||
| 2025-08-12 | 13F | Bokf, Na | 0 | -100.00 | 0 | |||||
| 2025-08-18 | 13F | Geneos Wealth Management Inc. | 1,906 | -25.08 | 29 | -22.22 | ||||
| 2025-08-29 | NP | GATAX - The Gabelli Asset Fund Class A | 40,000 | -26.61 | 602 | -22.42 | ||||
| 2025-07-25 | NP | FCEF - First Trust CEF Income Opportunity ETF This fund is a listed as child fund of First Trust Advisors Lp and if that institution has disclosed ownership in this security, then these positions will not be double counted when calculating total shares and total value | 52,241 | 8.25 | 776 | 5.58 | ||||
| 2025-07-09 | 13F | Bay Rivers Group | 42,559 | 5.67 | 641 | 11.69 | ||||
| 2025-07-14 | 13F | LaFleur & Godfrey LLC | 10,247 | 0.00 | 154 | 6.21 | ||||
| 2025-08-14 | 13F | Wells Fargo & Company/mn | 1,855,580 | 3.94 | 27,926 | 9.85 | ||||
| 2025-07-11 | 13F | Farther Finance Advisors, LLC | 10,068 | 0.03 | 152 | 4.86 | ||||
| 2025-05-15 | 13F | WPG Advisers, LLC | 0 | -100.00 | 0 | -100.00 | ||||
| 2025-08-11 | 13F | Rothschild Investment Llc | 203,172 | 4.58 | 3,058 | 10.52 | ||||
| 2025-08-14 | 13F | GWM Advisors LLC | 58,856 | 10.35 | 886 | 16.60 | ||||
| 2025-08-14 | 13F | Mariner, LLC | 73,157 | -22.33 | 1,101 | -17.90 | ||||
| 2025-08-13 | 13F | First Trust Advisors Lp | 52,241 | 0.00 | 786 | 5.79 | ||||
| 2025-08-14 | 13F | Wetherby Asset Management Inc | 11,798 | 0.00 | 178 | -4.84 | ||||
| 2025-07-30 | 13F | D.a. Davidson & Co. | 220,323 | -1.53 | 3,316 | 4.05 | ||||
| 2025-05-14 | 13F | Karpus Management, Inc. | 0 | -100.00 | 0 | |||||
| 2025-07-21 | 13F | Ameritas Advisory Services, LLC | 700 | 11 | ||||||
| 2025-07-09 | 13F | Graves-Light Private Wealth Management, Inc. | 10,253 | 0.00 | 154 | 5.48 | ||||
| 2025-07-14 | 13F | Whitener Capital Management, Inc. | 47,758 | 3.43 | 719 | 9.28 | ||||
| 2025-08-14 | 13F | Rivernorth Capital Management, Llc | 12,824 | 193 | ||||||
| 2025-09-04 | 13F/A | Advisor Group Holdings, Inc. | 273,832 | 37.80 | 4,121 | 45.67 | ||||
| 2025-08-04 | 13F | Atria Investments Llc | 32,340 | -72.64 | 487 | -71.12 | ||||
| 2025-08-28 | NP | RNCOX - RiverNorth Core Opportunity Fund Class R | 1,553 | -98.90 | 23 | -98.71 | ||||
| 2025-08-14 | 13F | K2 Principal Fund, L.p. | 19,490 | 2.00 | 293 | 7.72 | ||||
| 2025-07-31 | 13F | City State Bank | 464 | 0.00 | 7 | 0.00 | ||||
| 2025-07-28 | 13F | BRYN MAWR TRUST Co | 1,031 | 0.00 | 16 | 7.14 | ||||
| 2025-08-13 | 13F | Thomas J. Herzfeld Advisors, Inc. | 375 | 1.90 | 6 | 0.00 | ||||
| 2025-07-25 | 13F | Allspring Global Investments Holdings, LLC | 184,744 | 16.80 | 2,780 | 23.45 | ||||
| 2025-08-05 | 13F | Carson Advisory Inc. | 16,892 | 1.99 | 254 | 8.09 | ||||
| 2025-08-08 | 13F | Atlanta Consulting Group Advisors, LLC | 43,745 | 0.00 | 658 | 5.79 | ||||
| 2025-07-16 | 13F | Formidable Asset Management, LLC | 11,496 | 0.00 | 164 | 0.00 | ||||
| 2025-08-14 | 13F | Quantedge Capital Pte Ltd | 14,600 | 220 | ||||||
| 2025-08-06 | 13F | Prospera Financial Services Inc | 78,018 | 63.74 | 1,174 | 73.16 | ||||
| 2025-08-12 | 13F | Landscape Capital Management, L.l.c. | 52,384 | 788 | ||||||
| 2025-08-11 | 13F | Aptus Capital Advisors, LLC | 0 | -100.00 | 0 | |||||
| 2025-07-24 | 13F | Game Plan Financial Advisors, LLC | 300 | 0.00 | 5 | 0.00 | ||||
| 2025-05-12 | 13F | ESL Trust Services, LLC | 0 | -100.00 | 0 | |||||
| 2025-08-12 | 13F | Steward Partners Investment Advisory, Llc | 155,004 | -21.31 | 2,333 | -16.86 | ||||
| 2025-07-21 | 13F | DHJJ Financial Advisors, Ltd. | 55 | 0.00 | 1 | |||||
| 2025-07-10 | 13F | Wealth Enhancement Advisory Services, Llc | 12,175 | -60.53 | 189 | -56.95 | ||||
| 2025-08-07 | 13F | Kestra Private Wealth Services, Llc | 27,941 | 115.94 | 421 | 128.26 | ||||
| 2025-08-14 | 13F | Balyasny Asset Management Llc | 77,968 | 1,173 | ||||||
| 2025-08-14 | 13F | Lazard Asset Management Llc | 556,039 | 0.00 | 8 | 14.29 | ||||
| 2025-08-08 | 13F | Calamos Advisors LLC | 0 | -100.00 | 0 | |||||
| 2025-08-15 | 13F | Morgan Stanley | 6,008,525 | -5.95 | 90,428 | -0.59 | ||||
| 2025-07-22 | 13F | Belpointe Asset Management LLC | 0 | -100.00 | 0 | |||||
| 2025-08-07 | 13F/A | Tortoise Investment Management, LLC | 0 | -100.00 | 0 | -100.00 | ||||
| 2025-08-27 | NP | RYDEX VARIABLE TRUST - Multi-Hedge Strategies Fund Variable Annuity | 155 | -78.94 | 2 | -80.00 | ||||
| 2025-07-18 | 13F | Trust Co Of Vermont | 5,000 | 0.00 | 75 | 5.63 | ||||
| 2025-08-06 | 13F | Moors & Cabot, Inc. | 23,841 | 0.14 | 359 | 5.60 | ||||
| 2025-08-28 | NP | Cohen & Steers Closed-end Opportunity Fund, Inc. | 35,521 | -74.41 | 535 | -72.98 | ||||
| 2025-07-24 | 13F | Comprehensive Money Management Services LLC | 52,100 | 11.25 | 784 | 17.72 | ||||
| 2025-08-12 | 13F | Virtu Financial LLC | 31,246 | 185.82 | 0 | |||||
| 2025-07-11 | 13F | Pinnacle Bancorp, Inc. | 1,351 | 20 | ||||||
| 2025-08-12 | 13F | Global Retirement Partners, LLC | 191 | 3.24 | 3 | 0.00 | ||||
| 2025-07-24 | 13F | IFP Advisors, Inc | 155 | 0.00 | 2 | 0.00 | ||||
| 2025-07-21 | 13F | Future Financial Wealth Managment LLC | 5,000 | 0.00 | 75 | 5.63 | ||||
| 2025-08-04 | 13F | B&l Asset Management Llc | 12,320 | 185 | ||||||
| 2025-08-06 | 13F | Atlantic Union Bankshares Corp | 91,915 | -2.78 | 1,383 | 2.75 | ||||
| 2025-08-14 | 13F | McIlrath & Eck, LLC | 2,789 | 2.01 | 42 | 7.89 | ||||
| 2025-05-15 | 13F | Cnh Partners Llc | 0 | -100.00 | 0 | |||||
| 2025-08-06 | 13F | Menlo Advisors Llc | 195,242 | -2.89 | 3 | 0.00 | ||||
| 2025-08-08 | 13F | Avantax Advisory Services, Inc. | 11,311 | 170 | ||||||
| 2025-08-14 | 13F | Benjamin Edwards Inc | 65,166 | -11.42 | 981 | -6.40 | ||||
| 2025-07-25 | 13F | Atria Wealth Solutions, Inc. | 0 | -100.00 | 0 | |||||
| 2025-08-06 | 13F | Golden State Wealth Management, LLC | 8 | 0 |