Mga Batayang Estadistika
| Pemilik Institusional | 114 total, 114 long only, 0 short only, 0 long/short - change of -1.71% MRQ |
| Alokasi Portofolio Rata-rata | 0.5701 % - change of 10.26% MRQ |
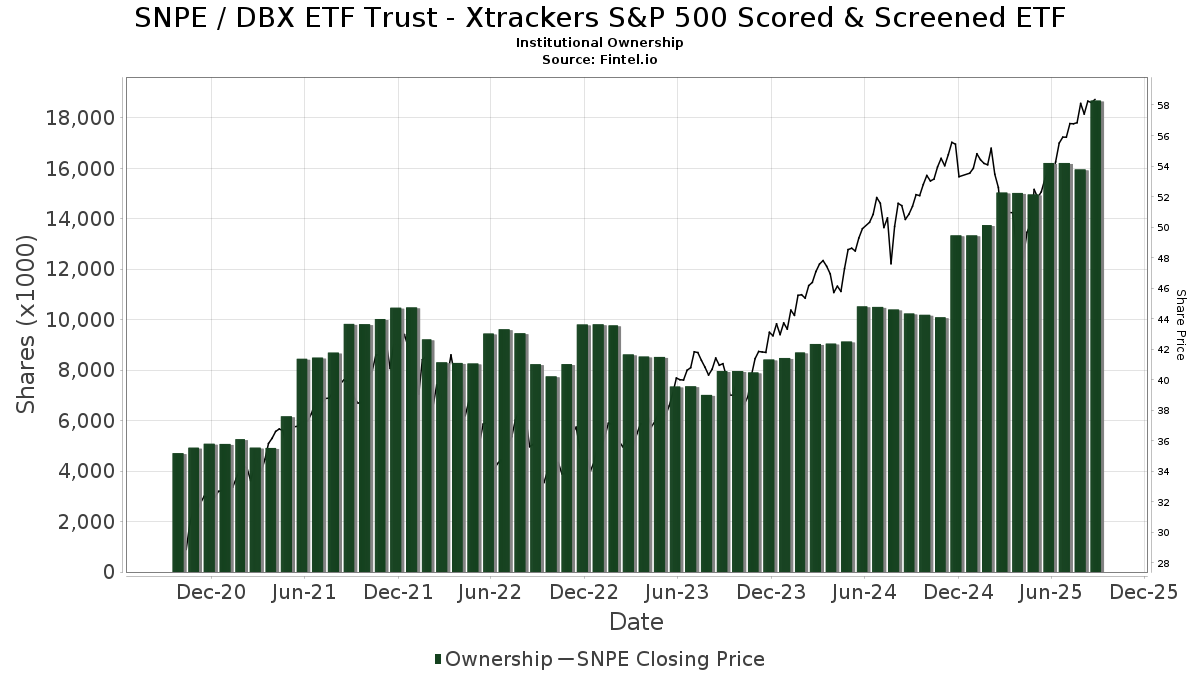
| Saham Institusional (Jangka Panjang) | 18,683,869 (ex 13D/G) - change of 2.47MM shares 15.26% MRQ |
| Nilai Institusional (Jangka Panjang) | $ 880,392 USD ($1000) |
Kepemilikan Institusional dan Pemegang Saham
DBX ETF Trust - Xtrackers S&P 500 Scored & Screened ETF (US:SNPE) memiliki 114 pemilik institusional dan pemegang saham yang telah mengajukan formulir 13D/G atau 13F kepada Komisi Bursa Efek (Securities Exchange Commission/SEC). Lembaga-lembaga ini memegang total 18,683,869 saham. Pemegang saham terbesar meliputi Jpmorgan Chase & Co, Morgan Stanley, Sun Life Financial Inc, Mirae Asset Global Investments Co., Ltd., WCG Wealth Advisors LLC, LPL Financial LLC, UBS Group AG, Ameriprise Financial Inc, Money Design Co.,Ltd., and Two Sigma Investments, Lp .
Struktur kepemilikan institusional DBX ETF Trust - Xtrackers S&P 500 Scored & Screened ETF (ARCA:SNPE) menunjukkan posisi terkini di perusahaan oleh institusi dan dana, serta perubahan terbaru dalam ukuran posisi. Pemegang saham utama dapat mencakup investor individu, reksa dana, dana lindung nilai, atau institusi. Jadwal 13D menunjukkan bahwa investor memegang (atau pernah memegang) lebih dari 5% saham perusahaan dan bermaksud (atau pernah bermaksud) untuk secara aktif mengejar perubahan strategi bisnis. Jadwal 13G menunjukkan investasi pasif lebih dari 5%.
The share price as of September 5, 2025 is 58.10 / share. Previously, on September 6, 2024, the share price was 49.59 / share. This represents an increase of 17.16% over that period.
Skor Sentimen Dana
Skor Sentimen Dana (sebelumnya dikenal sebagai Skor Akumulasi Kepemilikan) menemukan saham-saham yang paling banyak dibeli oleh dana. Ini adalah hasil dari model kuantitatif multi-faktor yang canggih yang mengidentifikasi perusahaan dengan tingkat akumulasi institusional tertinggi. Model penilaian menggunakan kombinasi dari total peningkatan pemilik yang diungkapkan, perubahan dalam alokasi portofolio pada pemilik tersebut, dan metrik lainnya. Angka berkisar dari 0 hingga 100, dengan angka yang lebih tinggi menunjukkan tingkat akumulasi yang lebih tinggi dibandingkan dengan perusahaan sejenisnya, dan 50 adalah rata-ratanya.
Frekuensi Pembaruan: Setiap Hari
Lihat Ownership Explorer, yang menyediakan daftar perusahaan dengan peringkat tertinggi.
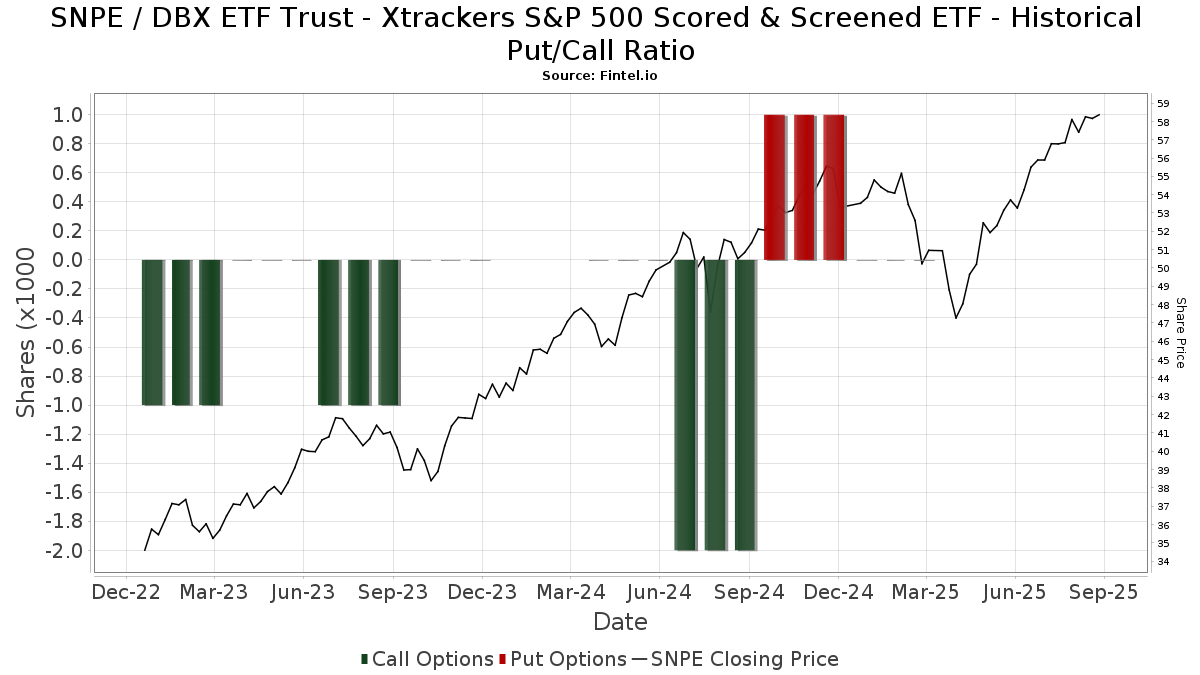
Rasio Put/Call Institusional
Selain melaporkan isu ekuitas dan utang standar, institusi dengan aset di bawah manajemen lebih dari 100 juta dolar AS juga harus mengungkapkan kepemilikan opsi put dan call mereka. Karena opsi put umumnya menunjukkan sentimen negatif, dan opsi call menunjukkan sentimen positif, kita dapat mengetahui sentimen institusional secara keseluruhan dengan memplot rasio put terhadap call. Grafik di sebelah kanan memplot rasio put/call historis untuk instrumen ini.
Menggunakan Rasio Put/Call sebagai indikator sentimen investor mengatasi salah satu kekurangan utama dari penggunaan total kepemilikan institusional, yaitu sejumlah besar aset yang dikelola diinvestasikan secara pasif untuk melacak indeks. Dana yang dikelola secara pasif biasanya tidak membeli opsi, sehingga indikator rasio put/call lebih akurat dalam melacak sentimen dana yang dikelola secara aktif.
Pengajuan 13F dan NPORT
Detail pada pengajuan 13F tersedia gratis. Detail pada pengajuan NP memerlukan keanggotaan premium. Baris berwarna hijau menunjukkan posisi baru. Baris berwarna merah menunjukkan posisi yang sudah ditutup. Klik tautan ini ikon untuk melihat riwayat transaksi selengkapnya.
Tingkatkan
untuk membuka data premium dan mengekspor ke Excel ![]() .
.
| Tanggal File | Sumber | Investor | Ketik | Presyo ng Avg (Silangan) |
Saham | Δ Saham (%) |
Dilaporkan Nilai ($1000) |
Nilai Δ (%) |
Alokasi Port (%) |
|
|---|---|---|---|---|---|---|---|---|---|---|
| 2025-08-11 | 13F | Nomura Asset Management Co Ltd | 5,780 | 25.65 | 320 | 38.10 | ||||
| 2025-08-13 | 13F | Millstone Evans Group, LLC | 18 | 0.00 | 1 | |||||
| 2025-08-14 | 13F | GWM Advisors LLC | 1,894 | 0.00 | 105 | 9.47 | ||||
| 2025-08-05 | 13F | Bank of New York Mellon Corp | 0 | -100.00 | 0 | |||||
| 2025-08-15 | 13F | Captrust Financial Advisors | 4,471 | 0.18 | 247 | 9.78 | ||||
| 2025-05-30 | NP | ERNZ - TrueShares Active Yield ETF | 5,360 | 270 | ||||||
| 2025-08-12 | 13F | LPL Financial LLC | 529,796 | -6.09 | 29,298 | 2.97 | ||||
| 2025-08-13 | 13F | IAG Wealth Partners, LLC | 252 | 0.00 | 14 | 8.33 | ||||
| 2025-08-13 | 13F | Baird Financial Group, Inc. | 4,917 | 8.40 | 272 | 18.86 | ||||
| 2025-08-14 | 13F | Qube Research & Technologies Ltd | 2,725 | 151 | ||||||
| 2025-07-10 | 13F | Wealth Enhancement Advisory Services, Llc | 16,778 | -5.40 | 939 | 4.92 | ||||
| 2025-07-15 | 13F | Sheets Smith Wealth Management | 55,436 | -33.26 | 3,066 | -26.81 | ||||
| 2025-07-29 | 13F | TrueMark Investments, LLC | 0 | -100.00 | 0 | |||||
| 2025-08-14 | 13F | Jupiter Wealth Management LLC | 3,624 | 73.65 | 211 | 90.91 | ||||
| 2025-08-14 | 13F | Nepc Llc | 9,245 | 0.00 | 511 | 9.66 | ||||
| 2025-08-08 | 13F | Gts Securities Llc | 161,089 | 201.07 | 8,901 | 229.87 | ||||
| 2025-08-14 | 13F | Bank Of America Corp /de/ | 270,882 | -29.99 | 14,980 | -23.23 | ||||
| 2025-08-11 | 13F | Retirement Capital Strategies | 38,540 | -24.55 | 2,131 | -17.34 | ||||
| 2025-07-30 | 13F | Ethic Inc. | 3,694 | 203 | ||||||
| 2025-07-21 | 13F | Mirae Asset Global Investments Co., Ltd. | 1,161,700 | -12.57 | 64,242 | -3.69 | ||||
| 2025-07-29 | 13F | Goldstein Advisors, LLC | 10,823 | -10.10 | 599 | -1.48 | ||||
| 2025-08-14 | 13F | Abound Financial, Llc | 4,494 | 0.02 | 249 | 9.73 | ||||
| 2025-08-14 | 13F | Bnp Paribas Arbitrage, Sa | 19,600 | 489,900.00 | 1,084 | |||||
| 2025-07-25 | NP | SNPD - Xtrackers S&P ESG Dividend Aristocrats ETF | 350 | -6.67 | 18 | -10.00 | ||||
| 2025-04-23 | 13F | White Pine Investment CO | 0 | -100.00 | 0 | |||||
| 2025-07-22 | 13F | Hill Island Financial Llc | 0 | -100.00 | 0 | |||||
| 2025-07-28 | 13F | Harbour Investments, Inc. | 10 | 0.00 | 1 | |||||
| 2025-05-08 | 13F | Plante Moran Financial Advisors, LLC | 0 | -100.00 | 0 | |||||
| 2025-07-31 | 13F | Money Design Co.,Ltd. | 425,847 | 3.76 | 24 | 15.00 | ||||
| 2025-08-14 | 13F | Citadel Advisors Llc | 0 | -100.00 | 0 | |||||
| 2025-04-15 | 13F | Noble Wealth Management PBC | 350 | 0.00 | 18 | -5.56 | ||||
| 2025-08-12 | 13F | Jpmorgan Chase & Co | 5,191,440 | -7.98 | 287,087 | 0.91 | ||||
| 2025-08-14 | 13F | Citadel Advisors Llc | Call | 0 | -100.00 | 0 | ||||
| 2025-05-13 | 13F | Franklin Resources Inc | 0 | -100.00 | 0 | |||||
| 2025-08-13 | 13F | WCG Wealth Advisors LLC | 551,286 | 49.16 | 30,486 | 63.57 | ||||
| 2025-08-12 | 13F | Steward Partners Investment Advisory, Llc | 5,212 | 288 | ||||||
| 2025-09-04 | 13F/A | Advisor Group Holdings, Inc. | 74,111 | 45.15 | 4,099 | 59.15 | ||||
| 2025-05-15 | 13F/A | Orion Portfolio Solutions, LLC | 21,097 | -12.17 | 1,064 | -16.89 | ||||
| 2025-08-14 | 13F | Wells Fargo & Company/mn | 132,360 | 0.69 | 7,319 | 10.43 | ||||
| 2025-08-14 | 13F | Two Sigma Investments, Lp | 307,200 | 178.51 | 16,988 | 205.43 | ||||
| 2025-08-12 | 13F | Proequities, Inc. | 0 | 0 | ||||||
| 2025-05-14 | 13F | Renaissance Technologies Llc | 0 | -100.00 | 0 | |||||
| 2025-07-07 | 13F | Rf&l Wealth Management, Llc | 4,697 | 0.00 | 260 | 9.75 | ||||
| 2025-08-11 | 13F | Advisor Resource Council | 0 | -100.00 | 0 | |||||
| 2025-04-25 | 13F | Tradewinds Capital Management, LLC | 0 | -100.00 | 0 | -100.00 | ||||
| 2025-08-08 | 13F | Pnc Financial Services Group, Inc. | 187 | 0.00 | 10 | 11.11 | ||||
| 2025-08-14 | 13F | Stifel Financial Corp | 0 | -100.00 | 0 | |||||
| 2025-08-13 | 13F | Balance Wealth, LLC | 18,000 | 0.03 | 995 | 9.70 | ||||
| 2025-08-15 | 13F | Tower Research Capital LLC (TRC) | 400 | -94.85 | 22 | -94.37 | ||||
| 2025-08-26 | 13F/A | Thrivent Financial For Lutherans | 0 | -100.00 | 0 | |||||
| 2025-08-14 | 13F | West Coast Financial LLC | 0 | -100.00 | 0 | |||||
| 2025-08-14 | 13F | Susquehanna International Group, Llp | 18,989 | -55.14 | 1,050 | -50.80 | ||||
| 2025-08-14 | 13F | Royal Bank Of Canada | 62,289 | -35.32 | 3,445 | -29.06 | ||||
| 2025-04-22 | 13F | Veridan Wealth LLC | 7,723 | -18.88 | 389 | -23.73 | ||||
| 2025-08-14 | 13F | Goldman Sachs Group Inc | 141,494 | 117.38 | 7,825 | 138.39 | ||||
| 2025-08-15 | 13F | Morgan Stanley | 3,753,403 | 35.44 | 207,563 | 48.52 | ||||
| 2025-08-13 | 13F | Sun Life Financial Inc | 2,231,800 | 123 | ||||||
| 2025-08-15 | 13F | Kestra Advisory Services, LLC | 14,092 | -10.18 | 779 | -1.52 | ||||
| 2025-04-25 | NP | SPDAX - DWS Multi-Asset Conservative Allocation Fund Class A | 195,047 | -25.09 | 10,445 | -27.13 | ||||
| 2025-07-09 | 13F | Fragasso Group Inc. | 7,032 | 25.66 | 389 | 37.59 | ||||
| 2025-07-10 | 13F | Focus Financial Network, Inc. | 0 | -100.00 | 0 | |||||
| 2025-04-30 | 13F | Sofos Investments, Inc. | 3,055 | -52.51 | 154 | -52.17 | ||||
| 2025-08-08 | 13F | Avantax Advisory Services, Inc. | 8,145 | 0.00 | 450 | 9.76 | ||||
| 2025-07-29 | 13F | APCM Wealth Management for Individuals | 186,044 | 8.00 | 10,288 | 18.43 | ||||
| 2025-07-18 | 13F | Cantor Fitzgerald Investment Adviser L.p. | 32,237 | -6.61 | 1,783 | 2.41 | ||||
| 2025-07-29 | 13F | Private Trust Co Na | 10,189 | 46.35 | 563 | 60.40 | ||||
| 2025-07-18 | 13F | First Pacific Financial | 1,417 | 0.07 | 78 | 9.86 | ||||
| 2025-08-08 | 13F | Citizens Financial Group Inc/ri | 4,569 | 0.00 | 253 | 9.57 | ||||
| 2025-08-04 | 13F | Assetmark, Inc | 225 | -34.97 | 12 | -29.41 | ||||
| 2025-07-18 | 13F/A | MJT & Associates Financial Advisory Group, Inc. | 2,027 | -27.16 | 112 | -20.00 | ||||
| 2025-08-14 | 13F | UBS Group AG | 492,431 | -14.09 | 27,231 | -5.79 | ||||
| 2025-08-13 | 13F | Congress Wealth Management LLC / DE / | 3,982 | 0.00 | 220 | 10.00 | ||||
| 2025-07-29 | 13F | Stratos Wealth Partners, LTD. | 44,831 | -0.24 | 2,479 | 9.40 | ||||
| 2025-08-11 | 13F | WPG Advisers, LLC | 18 | 0.00 | 1 | |||||
| 2025-08-08 | 13F | Hartland & Co., LLC | 9,954 | -26.99 | 550 | -19.94 | ||||
| 2025-08-05 | 13F | Simplex Trading, Llc | 100 | 0 | ||||||
| 2025-08-08 | 13F | Financial Gravity Companies, Inc. | 3,061 | 0.20 | 169 | 4.32 | ||||
| 2025-07-09 | 13F | Fermata Advisors, LLC | 0 | -100.00 | 0 | |||||
| 2025-08-13 | 13F | Flow Traders U.s. Llc | 0 | -100.00 | 0 | |||||
| 2025-08-12 | 13F | Prudential Plc | 25,000 | 0.00 | 1,382 | 9.68 | ||||
| 2025-08-18 | 13F | Goodman Advisory Group, LLC | 0 | -100.00 | 0 | |||||
| 2025-08-18 | 13F | Tyler-Stone Wealth Management | 0 | -100.00 | 0 | |||||
| 2025-08-11 | 13F | One Capital Management, LLC | 52,404 | -48.24 | 2,898 | -43.25 | ||||
| 2025-08-12 | 13F | MAI Capital Management | 110,807 | -6.60 | 6,128 | 2.42 | ||||
| 2025-08-14 | 13F | Two Sigma Securities, Llc | 4,436 | 245 | ||||||
| 2025-07-15 | 13F | Fifth Third Bancorp | 264,020 | -12.93 | 14,600 | -4.52 | ||||
| 2025-07-31 | 13F | WFA Asset Management Corp | 1,291 | 0.39 | 65 | 4.92 | ||||
| 2025-08-13 | 13F | Jump Financial, LLC | 19,615 | 0.00 | 1,085 | 9.61 | ||||
| 2025-08-01 | 13F | Envestnet Asset Management Inc | 65,320 | -11.57 | 3,612 | -3.03 | ||||
| 2025-07-25 | 13F | Cwm, Llc | 628 | 0.00 | 0 | |||||
| 2025-07-11 | 13F | Farther Finance Advisors, LLC | 1,424 | -74.37 | 79 | -72.24 | ||||
| 2025-07-15 | 13F | Mather Group, Llc. | 0 | -100.00 | 0 | |||||
| 2025-03-24 | 13F | Fulcrum Equity Management | 0 | -100.00 | 0 | |||||
| 2025-08-04 | 13F | Savvy Advisors, Inc. | 21,357 | 1,181 | ||||||
| 2025-08-12 | 13F | Deutsche Bank Ag\ | 16,825 | -89.65 | 930 | -88.66 | ||||
| 2025-08-13 | 13F | Twin Peaks Wealth Advisors, LLC | 1,000 | 58 | ||||||
| 2025-08-14 | 13F | Comerica Bank | 3,352 | 51.20 | 185 | 66.67 | ||||
| 2025-08-14 | 13F | Fmr Llc | 5,098 | -25.21 | 282 | -18.08 | ||||
| 2025-07-31 | 13F | Heirloom Wealth Management | 8,238 | 0.93 | 456 | 10.71 | ||||
| 2025-07-31 | 13F | Cambridge Investment Research Advisors, Inc. | 9,543 | 5.77 | 1 | |||||
| 2025-04-25 | NP | PLUSX - DWS Multi-Asset Moderate Allocation Fund Class A | 104,413 | -25.29 | 5,591 | -27.32 | ||||
| 2025-07-25 | NP | USSG - Xtrackers MSCI USA ESG Leaders Equity ETF | 25,000 | 284.62 | 1,311 | 276.44 | ||||
| 2025-07-15 | 13F | Bfsg, Llc | 0 | -100.00 | 0 | |||||
| 2025-07-31 | 13F | LJI Wealth Management, LLC | 4,636 | 0.00 | 256 | 9.87 | ||||
| 2025-08-06 | 13F | Commonwealth Equity Services, Llc | 4,560 | -16.92 | 0 | |||||
| 2025-08-08 | 13F | Cetera Investment Advisers | 17,554 | -1.55 | 971 | 7.90 | ||||
| 2025-07-15 | 13F | GSB Wealth Management, LLC | 7,015 | 388 | ||||||
| 2025-07-18 | 13F | PFG Investments, LLC | 4,859 | 269 | ||||||
| 2025-08-11 | 13F | TD Waterhouse Canada Inc. | 2,163 | 0.00 | 120 | 9.17 | ||||
| 2025-07-10 | 13F | IMPACTfolio, LLC | 0 | -100.00 | 0 | |||||
| 2025-08-07 | 13F | Prudent Man Investment Management, Inc. | 559 | 0.00 | 30 | 0.00 | ||||
| 2025-08-05 | 13F | Bank Of Montreal /can/ | 278 | 0.00 | 15 | 7.14 | ||||
| 2025-08-18 | 13F/A | National Bank Of Canada /fi/ | 77,700 | 4,297 | ||||||
| 2025-08-07 | 13F | Allworth Financial LP | 31,972 | 0.07 | 1,768 | 13.04 | ||||
| 2025-08-08 | 13F | Principal Financial Group Inc | 198,000 | -13.47 | 10,949 | -5.10 | ||||
| 2025-08-04 | 13F | Migdal Insurance & Financial Holdings Ltd. | 79,035 | 353.91 | 4 | |||||
| 2025-07-25 | 13F | Fifth Third Wealth Advisors LLC | 4,250 | 235 | ||||||
| 2025-08-14 | 13F | TCG Advisory Services, LLC | 8,132 | 450 | ||||||
| 2025-07-14 | 13F | AdvisorNet Financial, Inc | 2,379 | 0.13 | 132 | 10.08 | ||||
| 2025-08-14 | 13F | Ameriprise Financial Inc | 461,906 | 5.04 | 25,548 | 15.20 | ||||
| 2025-08-15 | 13F | Urban Financial Advisory Corp | 2,369 | 0.30 | 131 | 10.08 | ||||
| 2025-08-06 | 13F | AE Wealth Management LLC | 22 | 83.33 | 1 | |||||
| 2025-07-03 | 13F | Garde Capital, Inc. | 0 | 0 | ||||||
| 2025-08-14 | 13F | Jane Street Group, Llc | 6,188 | -41.23 | 342 | -35.59 | ||||
| 2025-07-22 | 13F | Carolina Wealth Advisors, LLC | 1,023 | -6.06 | 57 | 3.70 | ||||
| 2025-05-08 | 13F | Eastern Bank | 0 | -100.00 | 0 | |||||
| 2025-05-15 | 13F | Citadel Advisors Llc | Put | 0 | -100.00 | 0 | ||||
| 2025-08-05 | 13F | Ellevest, Inc. | 3,649 | 202 | ||||||
| 2025-08-13 | 13F | Investment Counsel Co Of Nevada | 34,602 | 0.29 | 1,913 | 10.01 | ||||
| 2025-07-16 | 13F | GenWealth Group, Inc. | 51,745 | 3.46 | 2,861 | 13.44 | ||||
| 2025-08-14 | 13F | Potomac Fund Management Inc /adv | 7,812 | 4.12 | 437 | 26.01 | ||||
| 2025-07-17 | 13F | Nelson, Van Denburg & Campbell Wealth Management Group, LLC | 32,341 | -0.06 | 1,788 | 9.56 | ||||
| 2025-08-14 | 13F | Raymond James Financial Inc | 266,010 | -24.52 | 14,710 | -17.23 | ||||
| 2025-07-31 | 13F | Insight Wealth Partners, LLC | 50,387 | 4.22 | 2,786 | 14.27 | ||||
| 2025-08-12 | 13F | O'shaughnessy Asset Management, Llc | 387 | 0.00 | 21 | 10.53 | ||||
| 2025-08-13 | 13F | Gateway Wealth Partners, LLC | 30,804 | -68.90 | 1,703 | -65.91 | ||||
| 2025-08-07 | 13F | Encompass More Asset Management | 0 | -100.00 | 0 | |||||
| 2025-08-27 | 13F/A | Brinker Capital Investments, LLC | 21,371 | 1.30 | 1,182 | 11.10 | ||||
| 2025-08-11 | 13F | Tidemark, LLC | 0 | -100.00 | 0 | |||||
| 2025-08-13 | 13F | Cerity Partners LLC | 16,165 | 894 | ||||||
| 2025-07-31 | 13F | Mason & Associates Inc | 14,927 | -0.30 | 825 | 9.27 | ||||
| 2025-08-13 | 13F | Northwestern Mutual Wealth Management Co | 104,291 | -11.79 | 5,767 | -3.27 | ||||
| 2025-08-13 | 13F | Rsm Us Wealth Management Llc | 117,188 | -0.39 | 6,480 | 9.24 | ||||
| 2025-05-13 | 13F | EverSource Wealth Advisors, LLC | 0 | -100.00 | 0 |