Mga Batayang Estadistika
| Pemilik Institusional | 72 total, 66 long only, 4 short only, 2 long/short - change of -10.00% MRQ |
| Alokasi Portofolio Rata-rata | 0.0036 % - change of -92.52% MRQ |
| Saham Institusional (Jangka Panjang) | 3,899,201 (ex 13D/G) - change of -0.73MM shares -15.74% MRQ |
| Nilai Institusional (Jangka Panjang) | $ 26,438 USD ($1000) |
Kepemilikan Institusional dan Pemegang Saham
TriplePoint Venture Growth BDC Corp. (US:TPVG) memiliki 72 pemilik institusional dan pemegang saham yang telah mengajukan formulir 13D/G atau 13F kepada Komisi Bursa Efek (Securities Exchange Commission/SEC). Lembaga-lembaga ini memegang total 4,292,418 saham. Pemegang saham terbesar meliputi Two Sigma Advisers, Lp, Marshall Wace, Llp, Two Sigma Investments, Lp, Legal & General Group Plc, Virtus Investment Advisers, Inc., BlackRock, Inc., Ameriprise Financial Inc, VPC - Virtus Private Credit Strategy ETF, Susquehanna International Group, Llp, and Samalin Investment Counsel, LLC .
Struktur kepemilikan institusional TriplePoint Venture Growth BDC Corp. (NYSE:TPVG) menunjukkan posisi terkini di perusahaan oleh institusi dan dana, serta perubahan terbaru dalam ukuran posisi. Pemegang saham utama dapat mencakup investor individu, reksa dana, dana lindung nilai, atau institusi. Jadwal 13D menunjukkan bahwa investor memegang (atau pernah memegang) lebih dari 5% saham perusahaan dan bermaksud (atau pernah bermaksud) untuk secara aktif mengejar perubahan strategi bisnis. Jadwal 13G menunjukkan investasi pasif lebih dari 5%.
The share price as of September 5, 2025 is 6.83 / share. Previously, on September 9, 2024, the share price was 7.56 / share. This represents a decline of 9.66% over that period.

Skor Sentimen Dana
Skor Sentimen Dana (sebelumnya dikenal sebagai Skor Akumulasi Kepemilikan) menemukan saham-saham yang paling banyak dibeli oleh dana. Ini adalah hasil dari model kuantitatif multi-faktor yang canggih yang mengidentifikasi perusahaan dengan tingkat akumulasi institusional tertinggi. Model penilaian menggunakan kombinasi dari total peningkatan pemilik yang diungkapkan, perubahan dalam alokasi portofolio pada pemilik tersebut, dan metrik lainnya. Angka berkisar dari 0 hingga 100, dengan angka yang lebih tinggi menunjukkan tingkat akumulasi yang lebih tinggi dibandingkan dengan perusahaan sejenisnya, dan 50 adalah rata-ratanya.
Frekuensi Pembaruan: Setiap Hari
Lihat Ownership Explorer, yang menyediakan daftar perusahaan dengan peringkat tertinggi.
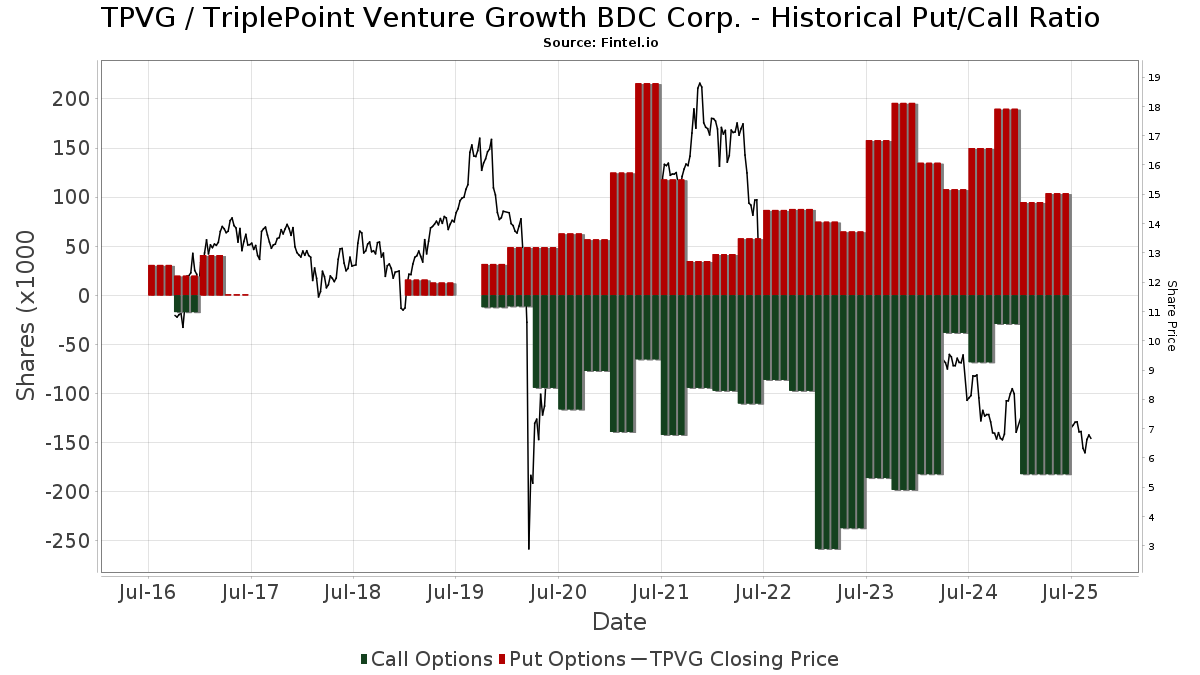
Rasio Put/Call Institusional
Selain melaporkan isu ekuitas dan utang standar, institusi dengan aset di bawah manajemen lebih dari 100 juta dolar AS juga harus mengungkapkan kepemilikan opsi put dan call mereka. Karena opsi put umumnya menunjukkan sentimen negatif, dan opsi call menunjukkan sentimen positif, kita dapat mengetahui sentimen institusional secara keseluruhan dengan memplot rasio put terhadap call. Grafik di sebelah kanan memplot rasio put/call historis untuk instrumen ini.
Menggunakan Rasio Put/Call sebagai indikator sentimen investor mengatasi salah satu kekurangan utama dari penggunaan total kepemilikan institusional, yaitu sejumlah besar aset yang dikelola diinvestasikan secara pasif untuk melacak indeks. Dana yang dikelola secara pasif biasanya tidak membeli opsi, sehingga indikator rasio put/call lebih akurat dalam melacak sentimen dana yang dikelola secara aktif.
Pengajuan 13F dan NPORT
Detail pada pengajuan 13F tersedia gratis. Detail pada pengajuan NP memerlukan keanggotaan premium. Baris berwarna hijau menunjukkan posisi baru. Baris berwarna merah menunjukkan posisi yang sudah ditutup. Klik tautan ini ikon untuk melihat riwayat transaksi selengkapnya.
Tingkatkan
untuk membuka data premium dan mengekspor ke Excel ![]() .
.
| Tanggal File | Sumber | Investor | Ketik | Presyo ng Avg (Silangan) |
Saham | Δ Saham (%) |
Dilaporkan Nilai ($1000) |
Nilai Δ (%) |
Alokasi Port (%) |
|
|---|---|---|---|---|---|---|---|---|---|---|
| 2025-06-25 | NP | VPC - Virtus Private Credit Strategy ETF | 217,436 | -0.37 | 1,320 | -25.01 | ||||
| 2025-06-27 | NP | COAGX - Caldwell & Orkin - Gator Capital Long/Short Fund | Short | -8,500 | -52 | |||||
| 2025-07-15 | 13F | Norden Group Llc | 56,848 | 36.37 | 399 | 37.24 | ||||
| 2025-05-05 | 13F | Diversify Advisory Services, LLC | 0 | -100.00 | 0 | |||||
| 2025-08-13 | 13F | Virtus Investment Advisers, Inc. | 237,903 | -0.06 | 1,668 | 0.36 | ||||
| 2025-08-12 | 13F | O'shaughnessy Asset Management, Llc | 13,575 | 95 | ||||||
| 2025-08-13 | 13F | Northwestern Mutual Wealth Management Co | 5,000 | 35 | ||||||
| 2025-08-14 | 13F | Wells Fargo & Company/mn | 64,814 | -2.57 | 454 | -2.16 | ||||
| 2025-08-14 | 13F | Raymond James Financial Inc | 19,133 | -8.55 | 134 | -8.22 | ||||
| 2025-08-14 | 13F | Verition Fund Management LLC | 19,877 | 139 | ||||||
| 2025-08-15 | 13F | Morgan Stanley | 83,601 | -55.99 | 586 | -55.81 | ||||
| 2025-08-18 | 13F | Wolverine Trading, Llc | Put | 12,200 | 16.19 | 85 | 14.86 | |||
| 2025-08-14 | 13F | Quarry LP | 0 | -100.00 | 0 | |||||
| 2025-08-01 | 13F | Y-Intercept (Hong Kong) Ltd | 0 | -100.00 | 0 | |||||
| 2025-08-12 | 13F | Winnow Wealth Llc | 1,400 | 10 | ||||||
| 2025-05-15 | 13F | Point72 (DIFC) Ltd | 0 | -100.00 | 0 | |||||
| 2025-05-15 | 13F | Parvin Asset Management, LLC | 0 | -100.00 | 0 | |||||
| 2025-08-06 | 13F | Commonwealth Equity Services, Llc | 18,296 | -1.95 | 0 | |||||
| 2025-08-14 | 13F | Financial Network Wealth Advisors LLC | 847 | 0.00 | 6 | 0.00 | ||||
| 2025-08-12 | 13F | Clear Street Markets Llc | 0 | -100.00 | 0 | |||||
| 2025-08-12 | 13F | LPL Financial LLC | 50,420 | 3.43 | 353 | 3.82 | ||||
| 2025-08-07 | 13F | Connor, Clark & Lunn Investment Management Ltd. | 18,669 | 131 | ||||||
| 2025-08-14 | 13F | Ameriprise Financial Inc | 223,483 | -20.64 | 1,564 | -20.45 | ||||
| 2025-08-15 | 13F | Great West Life Assurance Co /can/ | 38,025 | 0.00 | 0 | |||||
| 2025-05-15 | 13F | Hrt Financial Lp | 0 | -100.00 | 0 | |||||
| 2025-07-22 | 13F | Red Tortoise LLC | 2,351 | 16 | ||||||
| 2025-08-08 | 13F | Flaharty Asset Management, LLC | 360 | 0.00 | 3 | 0.00 | ||||
| 2025-07-24 | 13F | Us Bancorp \de\ | 0 | -100.00 | 0 | |||||
| 2025-08-14 | 13F | Avenir Corp | 10,000 | 0.00 | 70 | 1.45 | ||||
| 2025-08-06 | 13F | Ethos Financial Group, LLC | 46,627 | 84.91 | 327 | 85.23 | ||||
| 2025-08-12 | 13F | CIBC Private Wealth Group, LLC | 4,430 | -0.02 | 31 | 24.00 | ||||
| 2025-08-13 | 13F | PharVision Advisers, LLC | 0 | -100.00 | 0 | |||||
| 2025-08-08 | 13F | Pnc Financial Services Group, Inc. | 2,404 | 0.00 | 17 | 0.00 | ||||
| 2025-08-11 | 13F | Delta Asset Management Llc/tn | 13 | 0.00 | 0 | |||||
| 2025-08-05 | 13F | GPS Wealth Strategies Group, LLC | 2,327 | 0.00 | 16 | 0.00 | ||||
| 2025-07-28 | 13F | Harbour Investments, Inc. | 0 | -100.00 | 0 | |||||
| 2025-08-13 | 13F | Marshall Wace, Llp | 529,201 | 44.87 | 3,710 | 45.51 | ||||
| 2025-07-31 | 13F | Caitong International Asset Management Co., Ltd | 906 | 466.25 | 6 | 500.00 | ||||
| 2025-05-15 | 13F | Cubist Systematic Strategies, LLC | 0 | -100.00 | 0 | |||||
| 2025-05-01 | 13F | Diversify Wealth Management, Llc | 0 | -100.00 | 0 | |||||
| 2025-08-13 | 13F | EverSource Wealth Advisors, LLC | 10,000 | 0.00 | 70 | 1.45 | ||||
| 2025-08-14 | 13F | Susquehanna International Group, Llp | 19,416 | 136 | ||||||
| 2025-08-14 | 13F | Susquehanna International Group, Llp | Call | 113,900 | -4.12 | 798 | -3.74 | |||
| 2025-08-14 | 13F | Susquehanna International Group, Llp | Put | 59,400 | 198.49 | 416 | 201.45 | |||
| 2025-08-14 | 13F | Aquatic Capital Management LLC | 11,710 | -49.91 | 82 | -49.69 | ||||
| 2025-05-06 | 13F | Assetmark, Inc | 0 | -100.00 | 0 | |||||
| 2025-08-13 | 13F | Townsquare Capital Llc | 0 | -100.00 | 0 | |||||
| 2025-07-30 | 13F | Atlantic Edge Private Wealth Management, LLC | 200 | -50.00 | 1 | -50.00 | ||||
| 2025-05-13 | 13F | Bokf, Na | 0 | -100.00 | 0 | |||||
| 2025-08-12 | 13F | Trexquant Investment LP | 88,155 | -37.06 | 618 | -36.85 | ||||
| 2025-08-14 | 13F | Brevan Howard Capital Management LP | 0 | -100.00 | 0 | |||||
| 2025-06-27 | NP | LBO - WHITEWOLF Publicly Listed Private Equity ETF | 1,373 | 14.23 | 8 | -11.11 | ||||
| 2025-08-14 | 13F | Jane Street Group, Llc | 72,663 | 7.34 | 509 | 7.84 | ||||
| 2025-08-14 | 13F | Bank Of America Corp /de/ | 12,737 | -11.16 | 89 | -11.00 | ||||
| 2025-05-13 | 13F | Quantbot Technologies LP | 0 | -100.00 | 0 | -100.00 | ||||
| 2025-07-31 | 13F | Cambridge Investment Research Advisors, Inc. | 12,252 | -6.70 | 0 | |||||
| 2025-08-14 | 13F | Bnp Paribas Arbitrage, Sa | 2,704 | -87.73 | 19 | -88.24 | ||||
| 2025-07-18 | 13F | SOA Wealth Advisors, LLC. | 3,000 | 0.00 | 21 | 5.00 | ||||
| 2025-05-12 | 13F | Fmr Llc | 0 | -100.00 | 0 | |||||
| 2025-08-14 | 13F | Comerica Bank | 8,700 | -6.86 | 61 | -7.69 | ||||
| 2025-08-14 | 13F | UBS Group AG | 9,752 | -57.92 | 68 | -57.76 | ||||
| 2025-08-14 | 13F | McIlrath & Eck, LLC | 7,274 | 0.00 | 51 | 0.00 | ||||
| 2025-09-04 | 13F/A | Advisor Group Holdings, Inc. | 35,945 | 75.62 | 252 | 77.46 | ||||
| 2025-07-25 | 13F | Cwm, Llc | 979 | 10.75 | 0 | |||||
| 2025-08-12 | 13F | BlackRock, Inc. | 225,216 | 34.13 | 1,579 | 34.64 | ||||
| 2025-08-11 | 13F | Hexagon Capital Partners LLC | 0 | -100.00 | 0 | |||||
| 2025-07-17 | 13F | Sound Income Strategies, LLC | 1,279 | -5.47 | 9 | -11.11 | ||||
| 2025-08-08 | 13F | Cetera Investment Advisers | 43,121 | -4.02 | 302 | -3.51 | ||||
| 2025-08-13 | 13F | Lido Advisors, LLC | 83,570 | -1.68 | 586 | -1.35 | ||||
| 2025-05-08 | 13F | XTX Topco Ltd | 0 | -100.00 | 0 | |||||
| 2025-08-12 | 13F | MAI Capital Management | 1,347 | 54.47 | 9 | 50.00 | ||||
| 2025-08-05 | 13F | Simplex Trading, Llc | 24,032 | 0 | ||||||
| 2025-08-12 | 13F | Jpmorgan Chase & Co | 0 | -100.00 | 0 | |||||
| 2025-08-13 | 13F | Neuberger Berman Group LLC | 0 | -100.00 | 0 | |||||
| 2025-07-16 | 13F | St Germain D J Co Inc | 500 | 0.00 | 4 | 0.00 | ||||
| 2025-07-14 | 13F | U.S. Capital Wealth Advisors, LLC | 40,380 | 23.18 | 283 | 24.12 | ||||
| 2025-08-14 | 13F | Bluefin Capital Management, Llc | 15,000 | 105 | ||||||
| 2025-05-14 | 13F | Campbell & CO Investment Adviser LLC | 0 | -100.00 | 0 | |||||
| 2025-07-14 | 13F | Farmers & Merchants Investments Inc | 5,700 | 21.28 | 40 | 21.88 | ||||
| 2025-08-19 | 13F | Newbridge Financial Services Group, Inc. | 1,000 | 7 | ||||||
| 2025-08-12 | 13F | Accordant Advisory Group Inc | 1,400 | 0.00 | 10 | 0.00 | ||||
| 2025-08-14 | 13F | Citadel Advisors Llc | 30,558 | -77.21 | 214 | -77.11 | ||||
| 2025-08-14 | 13F | Citadel Advisors Llc | Put | 33,200 | -48.69 | 233 | -48.56 | |||
| 2025-08-12 | 13F | Legal & General Group Plc | 276,451 | 4.52 | 1,935 | 4.76 | ||||
| 2025-08-04 | 13F | Kovack Advisors, Inc. | 50,319 | 10.55 | 353 | 11.04 | ||||
| 2025-08-11 | 13F | Private Advisor Group, LLC | 0 | -100.00 | 0 | |||||
| 2025-08-14 | 13F | Citadel Advisors Llc | Call | 68,600 | 7.02 | 481 | 7.38 | |||
| 2025-08-14 | 13F | D. E. Shaw & Co., Inc. | 0 | -100.00 | 0 | |||||
| 2025-08-14 | 13F | Qube Research & Technologies Ltd | 0 | -100.00 | 0 | |||||
| 2025-08-07 | 13F | Samalin Investment Counsel, LLC | 92,636 | 13.10 | 649 | 13.66 | ||||
| 2025-08-04 | 13F | Spire Wealth Management | 0 | -100.00 | 0 | |||||
| 2025-08-11 | 13F | Nomura Asset Management Co Ltd | 3,720 | 26 | ||||||
| 2025-08-14 | 13F | Millennium Management Llc | 0 | -100.00 | 0 | |||||
| 2025-08-14 | 13F | Group One Trading, L.p. | 2,430 | -16.24 | 17 | -15.00 | ||||
| 2025-08-13 | 13F | Jones Financial Companies Lllp | 1,000 | 7 | ||||||
| 2025-08-08 | 13F | CFO4Life Group, LLC | 13,610 | 0.00 | 95 | 1.06 | ||||
| 2025-07-30 | NP | ORR - Militia Long/Short Equity ETF | Short | -350,952 | 313.01 | -2,443 | 255.46 | |||
| 2025-05-15 | 13F | Schonfeld Strategic Advisors LLC | 0 | -100.00 | 0 | |||||
| 2025-07-29 | 13F | International Assets Investment Management, Llc | 15,245 | 0.00 | 107 | 0.00 | ||||
| 2025-08-12 | 13F | Proequities, Inc. | 0 | 0 | ||||||
| 2025-05-14 | 13F | ExodusPoint Capital Management, LP | 0 | -100.00 | 0 | |||||
| 2025-05-15 | 13F | Balyasny Asset Management Llc | 0 | -100.00 | 0 | |||||
| 2025-08-14 | 13F | Two Sigma Investments, Lp | 386,248 | -28.88 | 2,708 | -28.58 | ||||
| 2025-08-15 | 13F | Tower Research Capital LLC (TRC) | 0 | -100.00 | 0 | |||||
| 2025-08-11 | 13F | Brown Brothers Harriman & Co | 100 | 1 | ||||||
| 2025-08-14 | 13F | Royal Bank Of Canada | 22,627 | 48.09 | 159 | 48.60 | ||||
| 2025-08-13 | 13F | Northern Trust Corp | 29,032 | 92.04 | 204 | 93.33 | ||||
| 2025-04-25 | NP | KBWD - Invesco KBW High Dividend Yield Financial ETF This fund is a listed as child fund of Invesco Ltd. and if that institution has disclosed ownership in this security, then these positions will not be double counted when calculating total shares and total value | 0 | -100.00 | 0 | -100.00 | ||||
| 2025-08-19 | 13F | National Asset Management, Inc. | 0 | -100.00 | 0 | |||||
| 2025-08-28 | NP | SMSAX - SIMT Multi-Strategy Alternative Fund Class F | Short | -33,765 | 59.35 | -237 | 60.54 | |||
| 2025-05-15 | 13F | Alpine Global Management, LLC | 0 | -100.00 | 0 | -100.00 | ||||
| 2025-05-14 | 13F | Virtus ETF Advisers LLC | 0 | -100.00 | 0 | |||||
| 2025-08-14 | 13F | Two Sigma Advisers, Lp | 567,874 | -24.24 | 3,981 | -23.93 | ||||
| 2025-08-11 | 13F | HighTower Advisors, LLC | 0 | -100.00 | 0 |