Mga Batayang Estadistika
| Saham Institusional (Jangka Panjang) | 20,326,095 - 28.91% (ex 13D/G) - change of 1.22MM shares 6.40% MRQ |
| Nilai Institusional (Jangka Panjang) | $ 283,327 USD ($1000) |
Kepemilikan Institusional dan Pemegang Saham
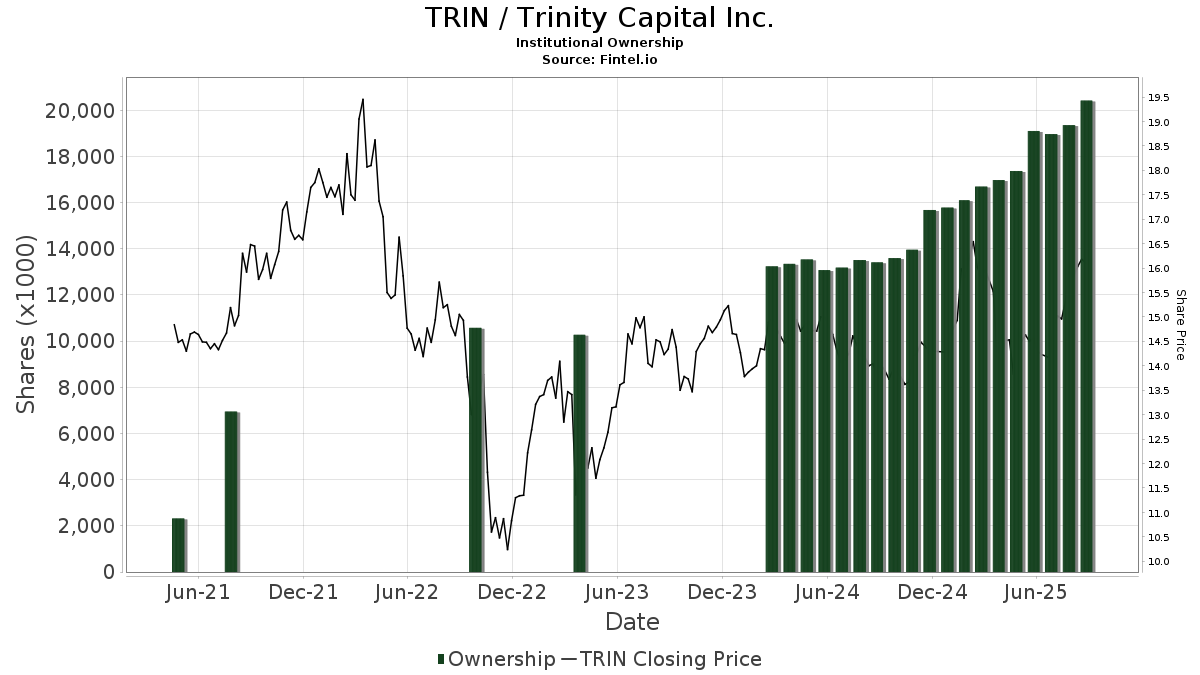
Trinity Capital Inc. (US:TRIN) memiliki 154 pemilik institusional dan pemegang saham yang telah mengajukan formulir 13D/G atau 13F kepada Komisi Bursa Efek (Securities Exchange Commission/SEC). Lembaga-lembaga ini memegang total 20,326,095 saham. Pemegang saham terbesar meliputi Van Eck Associates Corp, BIZD - VanEck Vectors BDC Income ETF, Melia Wealth LLC, Rockefeller Capital Management L.P., Invesco Ltd., Emerald Advisers, Llc, KBWD - Invesco KBW High Dividend Yield Financial ETF, QVT Financial LP, Two Sigma Advisers, Lp, and UBS Group AG .
Struktur kepemilikan institusional Trinity Capital Inc. (NasdaqGS:TRIN) menunjukkan posisi terkini di perusahaan oleh institusi dan dana, serta perubahan terbaru dalam ukuran posisi. Pemegang saham utama dapat mencakup investor individu, reksa dana, dana lindung nilai, atau institusi. Jadwal 13D menunjukkan bahwa investor memegang (atau pernah memegang) lebih dari 5% saham perusahaan dan bermaksud (atau pernah bermaksud) untuk secara aktif mengejar perubahan strategi bisnis. Jadwal 13G menunjukkan investasi pasif lebih dari 5%.
The share price as of September 5, 2025 is 16.23 / share. Previously, on September 6, 2024, the share price was 13.84 / share. This represents an increase of 17.27% over that period.
Skor Sentimen Dana
Skor Sentimen Dana (sebelumnya dikenal sebagai Skor Akumulasi Kepemilikan) menemukan saham-saham yang paling banyak dibeli oleh dana. Ini adalah hasil dari model kuantitatif multi-faktor yang canggih yang mengidentifikasi perusahaan dengan tingkat akumulasi institusional tertinggi. Model penilaian menggunakan kombinasi dari total peningkatan pemilik yang diungkapkan, perubahan dalam alokasi portofolio pada pemilik tersebut, dan metrik lainnya. Angka berkisar dari 0 hingga 100, dengan angka yang lebih tinggi menunjukkan tingkat akumulasi yang lebih tinggi dibandingkan dengan perusahaan sejenisnya, dan 50 adalah rata-ratanya.
Frekuensi Pembaruan: Setiap Hari
Lihat Ownership Explorer, yang menyediakan daftar perusahaan dengan peringkat tertinggi.
Rasio Put/Call Institusional
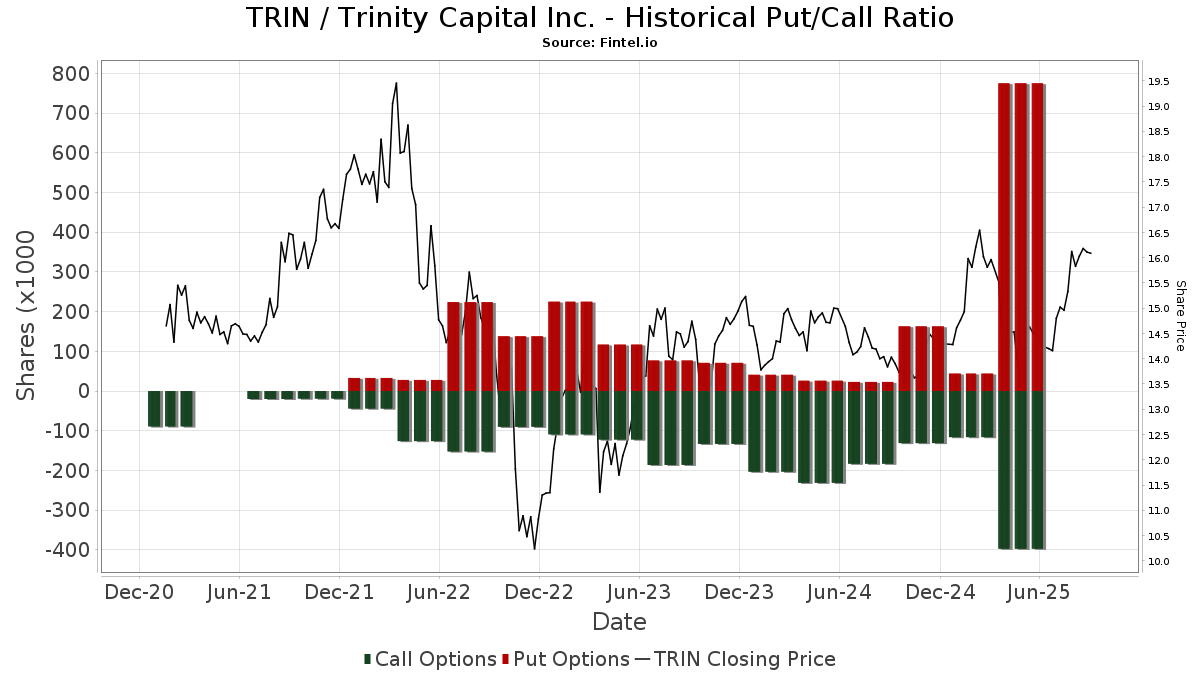
Selain melaporkan isu ekuitas dan utang standar, institusi dengan aset di bawah manajemen lebih dari 100 juta dolar AS juga harus mengungkapkan kepemilikan opsi put dan call mereka. Karena opsi put umumnya menunjukkan sentimen negatif, dan opsi call menunjukkan sentimen positif, kita dapat mengetahui sentimen institusional secara keseluruhan dengan memplot rasio put terhadap call. Grafik di sebelah kanan memplot rasio put/call historis untuk instrumen ini.
Menggunakan Rasio Put/Call sebagai indikator sentimen investor mengatasi salah satu kekurangan utama dari penggunaan total kepemilikan institusional, yaitu sejumlah besar aset yang dikelola diinvestasikan secara pasif untuk melacak indeks. Dana yang dikelola secara pasif biasanya tidak membeli opsi, sehingga indikator rasio put/call lebih akurat dalam melacak sentimen dana yang dikelola secara aktif.
Pengajuan 13D/G
Kami menyajikan pengajuan 13D/G secara terpisah dari pengajuan 13F karena perlakuan yang berbeda oleh SEC. Pengajuan 13D/G dapat diajukan oleh kelompok investor (dengan satu pemimpin), sedangkan pengajuan 13F tidak bisa. Hal ini mengakibatkan situasi di mana seorang investor dapat mengajukan 13D/G yang melaporkan satu nilai untuk total saham (mewakili semua saham yang dimiliki oleh kelompok investor), tetapi kemudian mengajukan 13F yang melaporkan nilai yang berbeda untuk total saham (mewakili kepemilikan mereka sendiri). Ini berarti bahwa kepemilikan saham dari pengajuan 13D/G dan pengajuan 13F seringkali tidak dapat dibandingkan secara langsung, sehingga kami menyajikannya secara terpisah.
Catatan: Mulai 16 Mei 2021, kami tidak lagi menampilkan pemilik yang belum mengajukan 13D/G dalam setahun terakhir. Sebelumnya, kami menampilkan riwayat lengkap pengajuan 13D/G. Secara umum, entitas yang diwajibkan untuk mengajukan pengajuan 13D/G harus mengajukan setidaknya setiap tahun sebelum mengirimkan pengajuan penutupan. Namun, terkadang dana keluar dari posisi tanpa mengirimkan pengajuan penutupan (misalnya, mereka menghentikan operasi), sehingga menampilkan riwayat lengkap terkadang menyebabkan kebingungan tentang kepemilikan saat ini. Untuk mencegah kebingungan, kami sekarang hanya menampilkan pemilik 'saat ini' - yaitu - pemilik yang telah mengajukan dalam setahun terakhir.
Upgrade to unlock premium data.
| Tanggal File | Formulir | Investor | Sebelumnya Saham |
Terbaru Saham |
Δ Saham (Persen) |
Kepemilikan (Persen) |
Δ Pagmamay-ari (Persen) |
|
|---|---|---|---|---|---|---|---|---|
| 2025-02-27 | Eagle Point Credit Management LLC | 3,336,668 | 360,475 | -89.20 | 0.60 | -96.13 |
Pengajuan 13F dan NPORT
Detail pada pengajuan 13F tersedia gratis. Detail pada pengajuan NP memerlukan keanggotaan premium. Baris berwarna hijau menunjukkan posisi baru. Baris berwarna merah menunjukkan posisi yang sudah ditutup. Klik tautan ini ikon untuk melihat riwayat transaksi selengkapnya.
Tingkatkan
untuk membuka data premium dan mengekspor ke Excel ![]() .
.
| Tanggal File | Sumber | Investor | Ketik | Presyo ng Avg (Silangan) |
Saham | Δ Saham (%) |
Dilaporkan Nilai ($1000) |
Nilai Δ (%) |
Alokasi Port (%) |
|
|---|---|---|---|---|---|---|---|---|---|---|
| 2025-08-06 | 13F | Round Rock Advisors, LLC | 580,619 | 8.95 | 8,169 | 1.11 | ||||
| 2025-07-31 | 13F | Oppenheimer & Co Inc | 30,390 | 15.50 | 428 | 7.29 | ||||
| 2025-08-06 | 13F | First Horizon Advisors, Inc. | 2,289 | 32 | ||||||
| 2025-08-13 | 13F | Invesco Ltd. | 838,194 | 2.66 | 11,793 | -4.72 | ||||
| 2025-06-25 | NP | HSSAX - Emerald Banking and Finance Fund Class A | 59,403 | 0.00 | 863 | -4.96 | ||||
| 2025-08-13 | 13F | Texas Capital Bank Wealth Management Services Inc | 22,066 | -48.84 | 310 | -52.53 | ||||
| 2025-03-28 | NP | DVDN - Kingsbarn Dividend Opportunity ETF | 3,879 | 59 | ||||||
| 2025-08-14 | 13F | Tudor Investment Corp Et Al | 20,077 | 36.31 | 282 | 26.46 | ||||
| 2025-08-13 | 13F | Legacy Capital Wealth Partners, LLC | 89,257 | -3.08 | 1,256 | -10.10 | ||||
| 2025-06-18 | NP | Putnam ETF Trust - Putnam BDC ETF - | 419,126 | 49.49 | 6,090 | 41.97 | ||||
| 2025-08-06 | 13F | Commonwealth Equity Services, Llc | 138,248 | 16.22 | 2 | 0.00 | ||||
| 2025-08-01 | 13F | Y-Intercept (Hong Kong) Ltd | 151,828 | 2,136 | ||||||
| 2025-08-14 | 13F | Kovitz Investment Group Partners, LLC | 18,553 | -4.07 | 271 | -7.85 | ||||
| 2025-08-13 | 13F | Townsquare Capital Llc | 0 | -100.00 | 0 | |||||
| 2025-07-28 | 13F | Axxcess Wealth Management, Llc | 0 | -100.00 | 0 | |||||
| 2025-08-12 | 13F | Advisors Asset Management, Inc. | 268,699 | 40.29 | 3,781 | 30.21 | ||||
| 2025-08-01 | 13F | Envestnet Asset Management Inc | 54,411 | 0.25 | 766 | -6.93 | ||||
| 2025-05-15 | 13F | CAPROCK Group, Inc. | 21,000 | 329 | ||||||
| 2025-07-30 | 13F | D.a. Davidson & Co. | 20,590 | 95.39 | 290 | 81.76 | ||||
| 2025-08-14 | 13F | Jane Street Group, Llc | Put | 0 | -100.00 | 0 | ||||
| 2025-08-14 | 13F | Ameriprise Financial Inc | 296,212 | 6.31 | 4,157 | -1.59 | ||||
| 2025-08-14 | 13F | Vident Advisory, LLC | 46,640 | 109.91 | 656 | 95.24 | ||||
| 2025-07-08 | 13F/A | Salem Investment Counselors Inc | 500 | 7 | ||||||
| 2025-08-12 | 13F | CIBC Private Wealth Group, LLC | 2,253 | 0.00 | 32 | 3.33 | ||||
| 2025-08-15 | 13F | Morgan Stanley | 276,839 | 48.85 | 3,895 | 38.17 | ||||
| 2025-07-01 | 13F | Confluence Investment Management Llc | 59,052 | 0.01 | 831 | -7.26 | ||||
| 2025-07-18 | 13F | PFG Investments, LLC | 13,129 | -0.57 | 185 | -8.00 | ||||
| 2025-08-13 | 13F | ExodusPoint Capital Management, LP | 0 | -100.00 | 0 | |||||
| 2025-08-13 | 13F | Kennedy Capital Management, Inc. | 265,864 | 8.56 | 3,741 | 0.75 | ||||
| 2025-08-14 | 13F | Bank Of America Corp /de/ | 188,121 | 67.64 | 2,647 | 55.56 | ||||
| 2025-05-15 | 13F | Mariner, LLC | 0 | -100.00 | 0 | |||||
| 2025-08-14 | 13F | Jane Street Group, Llc | Call | 10,300 | 1.98 | 145 | -5.88 | |||
| 2025-08-14 | 13F | Jane Street Group, Llc | 19,186 | 270 | ||||||
| 2025-08-12 | 13F | Jpmorgan Chase & Co | 3,843 | 54 | ||||||
| 2025-08-22 | NP | Eagle Point Enhanced Income Trust | 74,896 | 1,054 | ||||||
| 2025-08-06 | 13F | Smh Capital Advisors Inc | 135,485 | -0.39 | 1,906 | -7.52 | ||||
| 2025-08-12 | 13F | Hillsdale Investment Management Inc. | 0 | -100.00 | 0 | |||||
| 2025-08-14 | 13F | Millennium Management Llc | 491,727 | 34.99 | 6,919 | 25.28 | ||||
| 2025-08-13 | 13F | Beacon Pointe Advisors, LLC | 52,400 | 737 | ||||||
| 2025-08-14 | 13F | Aquatic Capital Management LLC | 27,140 | -39.77 | 382 | -44.22 | ||||
| 2025-07-31 | 13F | MQS Management LLC | 10,114 | 142 | ||||||
| 2025-07-18 | 13F | Trust Co Of Vermont | 1,400 | -79.86 | 20 | -81.90 | ||||
| 2025-08-14 | 13F | UBS Group AG | 591,316 | 30.47 | 8,320 | 21.09 | ||||
| 2025-08-14 | 13F | Schonfeld Strategic Advisors LLC | 15,332 | 216 | ||||||
| 2025-07-10 | 13F | Moody National Bank Trust Division | 18,537 | 1.12 | 261 | -6.14 | ||||
| 2025-07-10 | 13F | Wealth Enhancement Advisory Services, Llc | 16,524 | 22.60 | 236 | 15.69 | ||||
| 2025-05-15 | 13F | Concentric Capital Strategies, LP | 0 | -100.00 | 0 | |||||
| 2025-08-13 | 13F | Russell Investments Group, Ltd. | 25 | -92.82 | 0 | -100.00 | ||||
| 2025-09-04 | 13F/A | Advisor Group Holdings, Inc. | 60,877 | 49.63 | 857 | 38.74 | ||||
| 2025-08-14 | 13F | McIlrath & Eck, LLC | 4,186 | 0.00 | 59 | -7.94 | ||||
| 2025-08-29 | 13F | Total Investment Management Inc | 100 | 1 | ||||||
| 2025-08-05 | 13F | Simplex Trading, Llc | 261 | 0 | ||||||
| 2025-07-22 | 13F | Awm Capital, Llc | 64,583 | 14.77 | 952 | 8.06 | ||||
| 2025-08-12 | 13F | BlackRock, Inc. | 315,266 | 30.74 | 4,436 | 21.34 | ||||
| 2025-08-12 | 13F | Dynamic Technology Lab Private Ltd | 26,177 | 24.06 | 368 | 15.00 | ||||
| 2025-08-04 | 13F | Emerald Mutual Fund Advisers Trust | 577,713 | 0.00 | 8,128 | -7.19 | ||||
| 2025-08-08 | 13F | Cetera Investment Advisers | 72,808 | -1.69 | 1,024 | -8.73 | ||||
| 2025-08-14 | 13F | Principal Street Partners, LLC | 24,713 | -7.54 | 348 | -14.32 | ||||
| 2025-08-13 | 13F | Quantbot Technologies LP | 155,851 | 322.26 | 2,193 | 292.13 | ||||
| 2025-08-13 | 13F | PharVision Advisers, LLC | 26,488 | 89.73 | 373 | 76.30 | ||||
| 2025-08-15 | 13F | CI Private Wealth, LLC | 209,838 | 159.64 | 2,952 | 140.98 | ||||
| 2025-08-14 | 13F/A | Rockefeller Capital Management L.P. | 895,784 | 1.89 | 12,604 | -5.43 | ||||
| 2025-07-28 | 13F | Melia Wealth LLC | 1,148,936 | 4.08 | 16,166 | -3.41 | ||||
| 2025-04-17 | 13F | Sound Income Strategies, LLC | 0 | -100.00 | 0 | |||||
| 2025-08-14 | 13F | Gotham Asset Management, LLC | 50,000 | 54.80 | 704 | 43.76 | ||||
| 2025-08-15 | 13F | Tower Research Capital LLC (TRC) | 90 | 172.73 | 1 | |||||
| 2025-08-14 | 13F | Van Eck Associates Corp | 1,520,403 | 10.63 | 21 | 5.00 | ||||
| 2025-08-12 | 13F | Financial Advocates Investment Management | 15,250 | 215 | ||||||
| 2025-08-13 | 13F | Bare Financial Services, Inc | 258 | 4 | ||||||
| 2025-08-12 | 13F | Entropy Technologies, LP | 0 | -100.00 | 0 | |||||
| 2025-08-28 | NP | TRIFX - Catalyst/SMH Total Return Income Fund Class A | 70,337 | 0.00 | 990 | -7.22 | ||||
| 2025-05-30 | NP | PRISX - T. Rowe Price Financial Services Fund, Inc. This fund is a listed as child fund of Price T Rowe Associates Inc /md/ and if that institution has disclosed ownership in this security, then these positions will not be double counted when calculating total shares and total value | 93,024 | -52.42 | 1,410 | -50.16 | ||||
| 2025-08-14 | 13F | Balyasny Asset Management Llc | 0 | -100.00 | 0 | |||||
| 2025-07-28 | NP | KBWD - Invesco KBW High Dividend Yield Financial ETF This fund is a listed as child fund of Invesco Ltd. and if that institution has disclosed ownership in this security, then these positions will not be double counted when calculating total shares and total value | 803,349 | -16.31 | 11,697 | -26.42 | ||||
| 2025-08-13 | 13F | Truvestments Capital Llc | 2,573 | -10.25 | 36 | -16.28 | ||||
| 2025-08-14 | 13F | Royal Bank Of Canada | 34,239 | 33.07 | 482 | 23.59 | ||||
| 2025-08-08 | 13F | Geode Capital Management, Llc | 14,443 | 0.00 | 203 | -6.88 | ||||
| 2025-08-12 | 13F | SRS Capital Advisors, Inc. | 622 | 0.00 | 9 | -11.11 | ||||
| 2025-07-25 | NP | First Trust Specialty Finance & Financial Opportunities Fund This fund is a listed as child fund of First Trust Advisors Lp and if that institution has disclosed ownership in this security, then these positions will not be double counted when calculating total shares and total value | 48,000 | 0.00 | 699 | -12.09 | ||||
| 2025-08-11 | 13F | Lsv Asset Management | 10,161 | 3.54 | 0 | |||||
| 2025-05-14 | 13F | Northwestern Mutual Wealth Management Co | 0 | -100.00 | 0 | |||||
| 2025-08-15 | 13F | Keel Point, LLC | 12,426 | 0.00 | 175 | -7.45 | ||||
| 2025-07-16 | 13F | Eagle Global Advisors Llc | 21,280 | 0.00 | 299 | -7.14 | ||||
| 2025-08-14 | 13F | Sovereign's Capital Management, LLC | 140,268 | 0.00 | 1,974 | -7.20 | ||||
| 2025-08-11 | 13F | Alps Advisors Inc | 23,152 | 3.46 | 326 | -4.13 | ||||
| 2025-08-13 | 13F | Rinkey Investments | 11,957 | -41.63 | 168 | -45.81 | ||||
| 2025-07-29 | 13F | Private Trust Co Na | 1,685 | 24 | ||||||
| 2025-08-12 | 13F | Clear Street Markets Llc | 0 | -100.00 | 0 | |||||
| 2025-07-16 | 13F | Exeter Financial, LLC | 10,166 | 143 | ||||||
| 2025-07-31 | 13F | Catalyst Capital Advisors LLC | 70,337 | 0.00 | 990 | -7.22 | ||||
| 2025-08-14 | 13F | Wells Fargo & Company/mn | 154,759 | 257.68 | 2,177 | 232.37 | ||||
| 2025-08-14 | 13F | Raymond James Financial Inc | 58,792 | 9.90 | 827 | 2.10 | ||||
| 2025-08-18 | 13F | Geneos Wealth Management Inc. | 7,566 | 6.53 | 106 | -0.93 | ||||
| 2025-07-10 | 13F | Peoples Bank/KS | 0 | -100.00 | 0 | |||||
| 2025-04-22 | 13F | Synergy Financial Management, LLC | 0 | -100.00 | 0 | |||||
| 2025-08-14 | 13F | Smartleaf Asset Management LLC | 76 | -50.97 | 1 | -50.00 | ||||
| 2025-07-21 | 13F | Mirae Asset Global Investments Co., Ltd. | 25,000 | 78.57 | 352 | 58.82 | ||||
| 2025-07-28 | 13F | Naviter Wealth, LLC | 21,970 | 18.12 | 320 | 8.84 | ||||
| 2025-06-23 | NP | PPNMX - SmallCap Growth Fund I R-3 | 179,519 | 0.00 | 2,608 | -5.03 | ||||
| 2025-07-22 | 13F | Gsa Capital Partners Llp | 12,330 | -38.77 | 0 | |||||
| 2025-07-18 | 13F | Union Bancaire Privee, UBP SA | 11,760 | 5.08 | 24,658 | 14,489.94 | ||||
| 2025-07-31 | 13F | Quest Partners LLC | 61,157 | 64,275.79 | 860 | 85,900.00 | ||||
| 2025-08-04 | 13F | Emerald Advisers, Llc | 829,710 | 3.87 | 11,674 | -3.59 | ||||
| 2025-08-11 | 13F | Empowered Funds, LLC | 14,168 | -8.33 | 199 | -14.96 | ||||
| 2025-08-26 | NP | GAFCX - Virtus AlphaSimplex Global Alternatives Fund Class C | 2,493 | 35 | ||||||
| 2025-08-12 | 13F | Aigen Investment Management, Lp | 12,758 | 180 | ||||||
| 2025-07-24 | 13F | Ronald Blue Trust, Inc. | 5,929 | 40.33 | 83 | 29.69 | ||||
| 2025-08-11 | 13F | Hexagon Capital Partners LLC | 0 | -100.00 | 0 | |||||
| 2025-08-13 | 13F | EverSource Wealth Advisors, LLC | 1,598 | 58.06 | 22 | 46.67 | ||||
| 2025-08-15 | 13F | Kestra Advisory Services, LLC | 13,677 | 192 | ||||||
| 2025-08-08 | 13F | Creative Planning | 0 | -100.00 | 0 | |||||
| 2025-08-12 | 13F | LPL Financial LLC | 459,325 | 23.15 | 6,463 | 14.29 | ||||
| 2025-06-27 | NP | LBO - WHITEWOLF Publicly Listed Private Equity ETF | 15,456 | 14.29 | 225 | 8.74 | ||||
| 2025-05-15 | 13F | Talon Private Wealth, LLC | 0 | -100.00 | 0 | -100.00 | ||||
| 2025-08-14 | 13F | Susquehanna International Group, Llp | Call | 223,200 | 3,140 | |||||
| 2025-08-08 | 13F | Pnc Financial Services Group, Inc. | 3,000 | 0.00 | 42 | -6.67 | ||||
| 2025-08-14 | 13F | Susquehanna International Group, Llp | Put | 15,100 | 212 | |||||
| 2025-07-31 | 13F | Caitong International Asset Management Co., Ltd | 32 | 0.00 | 0 | |||||
| 2025-08-13 | 13F | Marshall Wace, Llp | 24,563 | 346 | ||||||
| 2025-08-14 | 13F | Cubist Systematic Strategies, LLC | 92,690 | -20.94 | 1,304 | -26.62 | ||||
| 2025-07-02 | 13F | First Financial Bank - Trust Division | 38,665 | 0.00 | 544 | -7.17 | ||||
| 2025-04-22 | 13F | Cambridge Investment Research Advisors, Inc. | 0 | -100.00 | 0 | |||||
| 2025-07-25 | 13F | Cwm, Llc | 288 | 3.60 | 0 | |||||
| 2025-08-14 | 13F | Alliancebernstein L.p. | 0 | -100.00 | 0 | |||||
| 2025-08-19 | 13F | Advisory Services Network, LLC | 160,176 | 52.66 | 2,401 | 51.01 | ||||
| 2025-08-11 | 13F | Private Advisor Group, LLC | 26,478 | 19.47 | 373 | 11.04 | ||||
| 2025-08-14 | 13F | Price T Rowe Associates Inc /md/ | 0 | -100.00 | 0 | |||||
| 2025-08-14 | 13F | State Street Corp | 56,370 | 257.75 | 822 | 233.74 | ||||
| 2025-07-24 | NP | FNCMX - Fidelity Nasdaq Composite Index Fund This fund is a listed as child fund of Fmr Llc and if that institution has disclosed ownership in this security, then these positions will not be double counted when calculating total shares and total value | 14,443 | 0.00 | 210 | -12.13 | ||||
| 2025-07-09 | 13F | Triumph Capital Management | 0 | -100.00 | 0 | |||||
| 2025-07-30 | 13F | Denali Advisors Llc | 102,530 | 1,443 | ||||||
| 2025-08-14 | 13F | Bnp Paribas Arbitrage, Sa | 68 | 1 | ||||||
| 2025-08-12 | 13F | Trexquant Investment LP | 190,369 | -23.78 | 2,678 | -29.27 | ||||
| 2025-08-12 | 13F | Franklin Resources Inc | 507,169 | 53.28 | 7,136 | 42.24 | ||||
| 2025-05-14 | 13F | Susquehanna International Group, Llp | 0 | -100.00 | 0 | -100.00 | ||||
| 2025-08-14 | 13F | Verition Fund Management LLC | 0 | -100.00 | 0 | |||||
| 2025-07-15 | 13F | Colonial River Wealth Management, LLC | 0 | -100.00 | 0 | |||||
| 2025-08-13 | 13F | Jump Financial, LLC | 135,320 | 1,904 | ||||||
| 2025-08-14 | 13F | Hrt Financial Lp | 210,981 | 39.16 | 3 | 0.00 | ||||
| 2025-08-14 | 13F | Ambassador Advisors, LLC | 247,098 | 4.38 | 3,477 | -3.12 | ||||
| 2025-08-14 | 13F | Qube Research & Technologies Ltd | 264,187 | 8.12 | 3,717 | 0.35 | ||||
| 2025-08-14 | 13F | First Commonwealth Financial Corp /pa/ | 23,741 | 0.00 | 334 | -6.96 | ||||
| 2025-08-21 | NP | BIZD - VanEck Vectors BDC Income ETF | 1,464,692 | 5.83 | 20,608 | -1.77 | ||||
| 2025-05-12 | 13F | Fmr Llc | 0 | -100.00 | 0 | |||||
| 2025-08-14 | 13F | Citadel Advisors Llc | Put | 10,400 | -61.90 | 146 | -64.65 | |||
| 2025-08-14 | 13F | Harvest Investment Services, LLC | 11,979 | 0.13 | 169 | -7.18 | ||||
| 2025-08-14 | 13F | GWM Advisors LLC | 10,238 | 2.84 | 144 | -4.00 | ||||
| 2025-07-29 | 13F | Chicago Partners Investment Group LLC | 97,296 | -0.10 | 1,461 | 8.54 | ||||
| 2025-08-14 | 13F | PDT Partners, LLC | 0 | -100.00 | 0 | |||||
| 2025-08-11 | 13F | Citigroup Inc | 0 | -100.00 | 0 | |||||
| 2025-08-14 | 13F | Citadel Advisors Llc | Call | 163,500 | 54.25 | 2,300 | 43.21 | |||
| 2025-05-28 | NP | SMLV - SPDR SSGA US Small Cap Low Volatility Index ETF This fund is a listed as child fund of State Street Corp and if that institution has disclosed ownership in this security, then these positions will not be double counted when calculating total shares and total value | 80,482 | 28.20 | 1,220 | 34.36 | ||||
| 2025-08-07 | 13F | Allworth Financial LP | 3,778 | 53 | ||||||
| 2025-08-14 | 13F | Boothbay Fund Management, Llc | 10,058 | 142 | ||||||
| 2025-08-12 | 13F | Cornerstone Wealth Management, LLC | 32,453 | 10.48 | 457 | 2.47 | ||||
| 2025-07-30 | NP | BFOR - Barron's 400 ETF | 23,152 | -8.89 | 337 | -19.76 | ||||
| 2025-07-14 | 13F | U.S. Capital Wealth Advisors, LLC | 21,000 | 295 | ||||||
| 2025-05-15 | 13F | EJF Capital LLC | 0 | -100.00 | 0 | |||||
| 2025-07-17 | 13F | GraniteShares Advisors LLC | 193,748 | 6.67 | 2,726 | -0.98 | ||||
| 2025-07-11 | 13F | Annex Advisory Services, LLC | 12,227 | 0.00 | 172 | -7.03 | ||||
| 2025-08-13 | 13F | Guggenheim Capital Llc | 39,261 | 5.73 | 552 | -1.78 | ||||
| 2025-08-14 | 13F | Group One Trading, L.p. | 14,378 | -2.98 | 202 | -9.82 | ||||
| 2025-08-14 | 13F | QVT Financial LP | Put | 750,000 | 10,552 | |||||
| 2025-08-13 | 13F | Jones Financial Companies Lllp | 326 | 226.00 | 5 | 300.00 | ||||
| 2025-05-14 | 13F | Comerica Bank | 0 | -100.00 | 0 | |||||
| 2025-08-07 | 13F | Hennion & Walsh Asset Management, Inc. | 255,096 | 3.22 | 3,589 | -4.19 | ||||
| 2025-05-14 | 13F | Campbell & CO Investment Adviser LLC | 0 | -100.00 | 0 | |||||
| 2025-07-09 | 13F | Sunpointe, LLC | 12,000 | 175 | ||||||
| 2025-07-11 | 13F | Farther Finance Advisors, LLC | 2,450 | 0.00 | 34 | -10.53 | ||||
| 2025-08-13 | 13F | M&t Bank Corp | 12,000 | 0.00 | 169 | -7.18 | ||||
| 2025-08-14 | 13F | Two Sigma Investments, Lp | 537,558 | -43.17 | 7,563 | -47.26 | ||||
| 2025-08-04 | 13F | Canton Hathaway, LLC | 96,571 | 1.38 | 1 | 0.00 | ||||
| 2025-05-13 | 13F | BKD Wealth Advisors, LLC | 0 | -100.00 | 0 | |||||
| 2025-08-12 | 13F | Global Retirement Partners, LLC | 1,203 | 0.00 | 17 | -5.88 | ||||
| 2025-08-14 | 13F | Quarry LP | 8,746 | 96.89 | 123 | 83.58 | ||||
| 2025-08-14 | 13F | Brevan Howard Capital Management LP | 62,231 | 876 | ||||||
| 2025-08-13 | 13F | Northern Trust Corp | 93,592 | 785.78 | 1,317 | 722.50 | ||||
| 2025-07-21 | 13F | Ameriflex Group, Inc. | 0 | -100.00 | 0 | |||||
| 2025-08-13 | 13F | JT Stratford LLC | 10,855 | 153 | ||||||
| 2025-08-14 | 13F | D. E. Shaw & Co., Inc. | 19,452 | -81.59 | 274 | -82.95 | ||||
| 2025-07-29 | NP | NKMCX - North Square Kennedy MicroCap Fund Class I | 11,913 | 81.35 | 173 | 60.19 | ||||
| 2025-07-28 | 13F | Harbour Investments, Inc. | 0 | -100.00 | 0 | |||||
| 2025-08-12 | 13F | Proequities, Inc. | 0 | 0 | ||||||
| 2025-08-14 | 13F | Citadel Advisors Llc | 0 | -100.00 | 0 | |||||
| 2025-08-14 | 13F | Ares Management Llc | 545,723 | 0.00 | 7,678 | -7.19 | ||||
| 2025-08-14 | 13F | Goldman Sachs Group Inc | 97,208 | -28.87 | 1,368 | -33.99 | ||||
| 2025-08-29 | NP | GraniteShares ETF Trust - GraniteShares HIPS US High Income ETF | 193,748 | 6.67 | 2,726 | -0.98 | ||||
| 2025-07-03 | 13F | Garde Capital, Inc. | 1,548 | 0.00 | 22 | -8.70 | ||||
| 2025-06-25 | NP | HSPGX - Emerald Growth Fund Class A | 338,791 | 0.00 | 4,923 | -5.04 | ||||
| 2025-08-14 | 13F | Two Sigma Advisers, Lp | 709,500 | -35.12 | 9,983 | -39.79 | ||||
| 2025-08-14 | 13F | Stifel Financial Corp | 423,164 | -0.30 | 5,954 | -7.48 | ||||
| 2025-08-12 | 13F | XTX Topco Ltd | 0 | -100.00 | 0 |
Other Listings
| DE:9F7 | € 13.61 |