Mga Batayang Estadistika
| Pemilik Institusional | 239 total, 238 long only, 0 short only, 1 long/short - change of 3.91% MRQ |
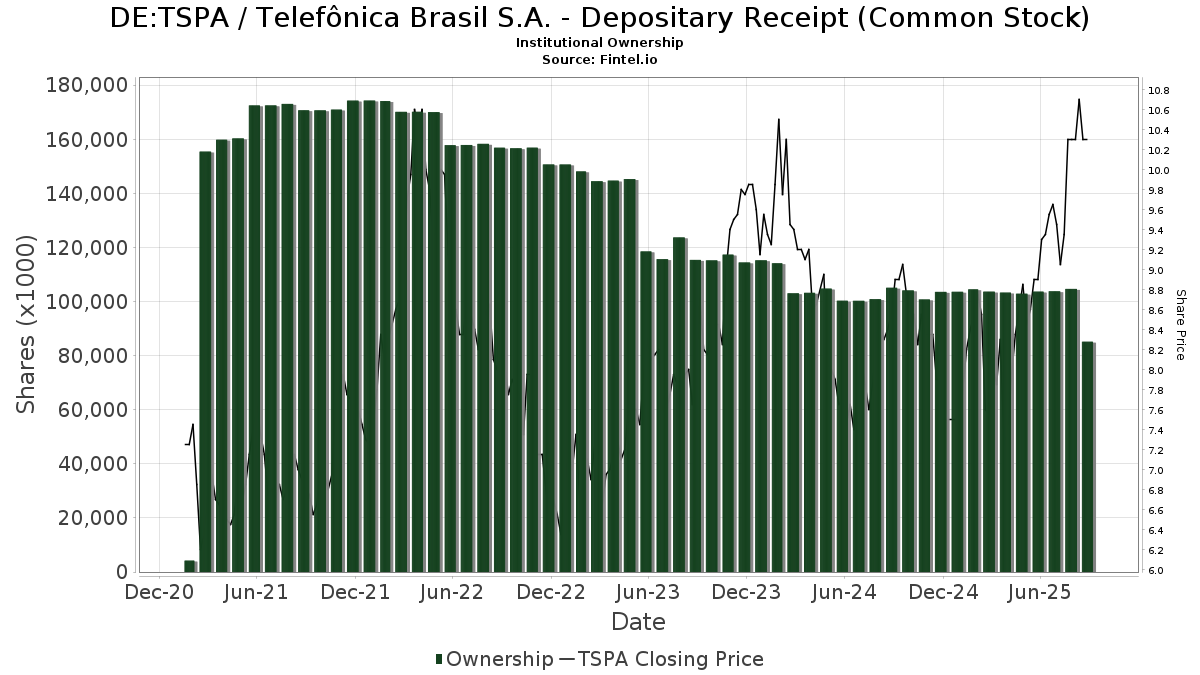
| Harga Saham | 10.40 |
| Alokasi Portofolio Rata-rata | 0.0870 % - change of 33.49% MRQ |
| Saham Institusional (Jangka Panjang) | 85,156,549 (ex 13D/G) - change of -19.00MM shares -18.24% MRQ |
| Nilai Institusional (Jangka Panjang) | $ 897,707 USD ($1000) |
Kepemilikan Institusional dan Pemegang Saham
Telefônica Brasil S.A. - Depositary Receipt (Common Stock) (DE:TSPA) memiliki 239 pemilik institusional dan pemegang saham yang telah mengajukan formulir 13D/G atau 13F kepada Komisi Bursa Efek (Securities Exchange Commission/SEC). Lembaga-lembaga ini memegang total 85,156,549 saham. Pemegang saham terbesar meliputi ARTKX - Artisan International Value Fund Investor Shares, Robeco Institutional Asset Management B.V., Arrowstreet Capital, Limited Partnership, BlackRock, Inc., Brandes Investment Partners, Lp, Macquarie Group Ltd, Standard Life Aberdeen plc, DEMAX - Delaware Emerging Markets Fund Class A, Renaissance Technologies Llc, and ILF - iShares Latin America 40 ETF .
Struktur kepemilikan institusional Telefônica Brasil S.A. - Depositary Receipt (Common Stock) (DB:TSPA) menunjukkan posisi terkini di perusahaan oleh institusi dan dana, serta perubahan terbaru dalam ukuran posisi. Pemegang saham utama dapat mencakup investor individu, reksa dana, dana lindung nilai, atau institusi. Jadwal 13D menunjukkan bahwa investor memegang (atau pernah memegang) lebih dari 5% saham perusahaan dan bermaksud (atau pernah bermaksud) untuk secara aktif mengejar perubahan strategi bisnis. Jadwal 13G menunjukkan investasi pasif lebih dari 5%.
The share price as of September 5, 2025 is 10.40 / share. Previously, on September 9, 2024, the share price was 8.70 / share. This represents an increase of 19.54% over that period.
Skor Sentimen Dana
Skor Sentimen Dana (sebelumnya dikenal sebagai Skor Akumulasi Kepemilikan) menemukan saham-saham yang paling banyak dibeli oleh dana. Ini adalah hasil dari model kuantitatif multi-faktor yang canggih yang mengidentifikasi perusahaan dengan tingkat akumulasi institusional tertinggi. Model penilaian menggunakan kombinasi dari total peningkatan pemilik yang diungkapkan, perubahan dalam alokasi portofolio pada pemilik tersebut, dan metrik lainnya. Angka berkisar dari 0 hingga 100, dengan angka yang lebih tinggi menunjukkan tingkat akumulasi yang lebih tinggi dibandingkan dengan perusahaan sejenisnya, dan 50 adalah rata-ratanya.
Frekuensi Pembaruan: Setiap Hari
Lihat Ownership Explorer, yang menyediakan daftar perusahaan dengan peringkat tertinggi.
Pengajuan 13F dan NPORT
Detail pada pengajuan 13F tersedia gratis. Detail pada pengajuan NP memerlukan keanggotaan premium. Baris berwarna hijau menunjukkan posisi baru. Baris berwarna merah menunjukkan posisi yang sudah ditutup. Klik tautan ini ikon untuk melihat riwayat transaksi selengkapnya.
Tingkatkan
untuk membuka data premium dan mengekspor ke Excel ![]() .
.
| Tanggal File | Sumber | Investor | Ketik | Presyo ng Avg (Silangan) |
Saham | Δ Saham (%) |
Dilaporkan Nilai ($1000) |
Nilai Δ (%) |
Alokasi Port (%) |
|
|---|---|---|---|---|---|---|---|---|---|---|
| 2025-05-08 | 13F | Plante Moran Financial Advisors, LLC | 0 | -100.00 | 0 | |||||
| 2025-05-15 | 13F | CAPROCK Group, Inc. | 145,704 | 64.42 | 1,289 | 92.68 | ||||
| 2025-08-14 | 13F | CIBC World Markets Inc. | 204,832 | 0.17 | 2,335 | 30.96 | ||||
| 2025-05-21 | 13F/A | Geneos Wealth Management Inc. | 0 | -100.00 | 0 | |||||
| 2025-08-14 | 13F | Optiver Holding B.V. | 17,765 | 0.00 | 203 | 31.17 | ||||
| 2025-08-14 | 13F | Wetherby Asset Management Inc | 81,497 | -0.68 | 929 | 50.08 | ||||
| 2025-08-26 | NP | ILF - iShares Latin America 40 ETF | 1,377,807 | 10.05 | 15,707 | 43.87 | ||||
| 2025-07-25 | 13F | JustInvest LLC | 54,279 | 10.57 | 619 | 44.39 | ||||
| 2025-08-14 | 13F | State Of Wisconsin Investment Board | 81,791 | 27.78 | 932 | 67.03 | ||||
| 2025-09-04 | 13F/A | Advisor Group Holdings, Inc. | 6,562 | 6.94 | 75 | 39.62 | ||||
| 2025-08-12 | 13F | Legal & General Group Plc | 84,000 | 0.00 | 957 | 30.74 | ||||
| 2025-08-13 | 13F | EverSource Wealth Advisors, LLC | 4,766 | 213.97 | 54 | 315.38 | ||||
| 2025-08-13 | 13F | Federated Hermes, Inc. | 713,677 | 16.44 | 8,136 | 52.23 | ||||
| 2025-08-12 | 13F | BlackRock, Inc. | 5,749,593 | -2.11 | 65,545 | 27.97 | ||||
| 2025-08-14 | 13F | Aquatic Capital Management LLC | 153,486 | 32.28 | 1,750 | 73.00 | ||||
| 2025-07-08 | 13F | Arlington Trust Co LLC | 65 | 1 | ||||||
| 2025-07-30 | 13F | Legacy Wealth Asset Management, LLC | 62,060 | -17.39 | 707 | 7.94 | ||||
| 2025-08-29 | NP | LIVR - Intelligent Livermore ETF | 19,803 | 226 | ||||||
| 2025-08-13 | 13F | Cerity Partners LLC | 106,166 | 2.60 | 1,210 | 34.15 | ||||
| 2025-08-14 | 13F | Vident Advisory, LLC | 46,299 | 36.08 | 528 | 78.04 | ||||
| 2025-08-04 | 13F | Assetmark, Inc | 40 | 0 | ||||||
| 2025-08-11 | 13F | Bell Investment Advisors, Inc | 183 | 200.00 | 2 | |||||
| 2025-08-14 | 13F | Citadel Advisors Llc | Call | 0 | -100.00 | 0 | ||||
| 2025-06-26 | NP | DFA INVESTMENT DIMENSIONS GROUP INC - Emerging Markets Sustainability Core 1 Portfolio Institutional Class This fund is a listed as child fund of Dimensional Fund Advisors Lp and if that institution has disclosed ownership in this security, then these positions will not be double counted when calculating total shares and total value | 18,532 | 0.00 | 180 | 9.82 | ||||
| 2025-07-08 | 13F | Nbc Securities, Inc. | 42,455 | 1.28 | 0 | |||||
| 2025-08-05 | 13F | Bank of New York Mellon Corp | 11,255 | -28.32 | 128 | -5.88 | ||||
| 2025-08-15 | 13F | Tower Research Capital LLC (TRC) | 893 | -86.36 | 10 | -82.46 | ||||
| 2025-07-10 | 13F | Umb Bank N A/mo | 488 | 0.00 | 4 | 0.00 | ||||
| 2025-05-15 | 13F | American Trust Investment Advisors, LLC | 0 | -100.00 | 0 | -100.00 | ||||
| 2025-05-14 | 13F | Itau Unibanco Holding S.A. | 0 | -100.00 | 0 | |||||
| 2025-07-25 | NP | DEMAX - Delaware Emerging Markets Fund Class A | 2,050,000 | 0.00 | 20,356 | 21.54 | ||||
| 2025-08-14 | 13F | Schonfeld Strategic Advisors LLC | 0 | -100.00 | 0 | |||||
| 2025-07-31 | 13F | Oppenheimer Asset Management Inc. | 40,454 | 2.82 | 461 | 34.40 | ||||
| 2025-08-14 | 13F | Toroso Investments, LLC | 54,714 | 624 | ||||||
| 2025-08-14 | 13F | Engineers Gate Manager LP | 65,468 | 63.30 | 746 | 113.75 | ||||
| 2025-08-14 | 13F | Fmr Llc | 6,863 | 6.88 | 78 | 41.82 | ||||
| 2025-08-14 | 13F | Aprio Wealth Management, LLC | 38,549 | 43.66 | 439 | 88.41 | ||||
| 2025-07-29 | 13F | Lesa Sroufe & Co | 225,286 | 4.85 | 3 | 100.00 | ||||
| 2025-08-14 | 13F | Lazard Asset Management Llc | 27,383 | 0.00 | 0 | |||||
| 2025-08-12 | 13F | Handelsbanken Fonder AB | 91,125 | 0.00 | 1 | |||||
| 2025-05-06 | 13F | Venturi Wealth Management, LLC | 0 | -100.00 | 0 | |||||
| 2025-08-14 | 13F | Boston Private Wealth Llc | 0 | -100.00 | 0 | |||||
| 2025-08-13 | 13F | Northwestern Mutual Wealth Management Co | 5,198 | 1.52 | 59 | 34.09 | ||||
| 2025-07-29 | 13F | Beverly Hills Private Wealth, LLC | 21,543 | 3.19 | 246 | 34.62 | ||||
| 2025-08-15 | 13F | Great West Life Assurance Co /can/ | 179,297 | -8.50 | 2 | 100.00 | ||||
| 2025-08-14 | 13F | Bnp Paribas Arbitrage, Sa | 109,571 | 22.26 | 1,249 | 59.92 | ||||
| 2025-08-12 | 13F | Coldstream Capital Management Inc | 0 | -100.00 | 0 | |||||
| 2025-08-13 | 13F | OMERS ADMINISTRATION Corp | 417,400 | 0.00 | 4,758 | 30.75 | ||||
| 2025-07-28 | NP | AVEM - Avantis Emerging Markets Equity ETF This fund is a listed as child fund of American Century Companies Inc and if that institution has disclosed ownership in this security, then these positions will not be double counted when calculating total shares and total value | 113,701 | 8.85 | 1,129 | 32.36 | ||||
| 2025-08-13 | 13F | Grantham, Mayo, Van Otterloo & Co. LLC | 0 | -100.00 | 0 | |||||
| 2025-07-07 | 13F | Investors Research Corp | 4,412 | -94.43 | 50 | -92.75 | ||||
| 2025-07-28 | NP | AVSE - Avantis Responsible Emerging Markets Equity ETF | 8,971 | 45.66 | 89 | 78.00 | ||||
| 2025-05-27 | NP | RMEAX - Aspiriant Risk-Managed Equity Allocation Fund Advisor Shares | 4,831 | 0.00 | 42 | 16.67 | ||||
| 2025-08-07 | 13F | Campbell & CO Investment Adviser LLC | 111,919 | 111.23 | 1,276 | 175.97 | ||||
| 2025-08-14 | 13F | Royal Bank Of Canada | 466,226 | 8.16 | 5,314 | 41.41 | ||||
| 2025-08-05 | 13F | NewSquare Capital LLC | 67 | 0.00 | 1 | |||||
| 2025-08-07 | 13F | Vise Technologies, Inc. | 10,017 | 114 | ||||||
| 2025-08-08 | 13F | Larson Financial Group LLC | 87 | 1 | ||||||
| 2025-08-14 | 13F | Ameriprise Financial Inc | 96,843 | 309.73 | 1,105 | 416.36 | ||||
| 2025-08-12 | 13F | SRS Capital Advisors, Inc. | 3,296 | 363.57 | 38 | 516.67 | ||||
| 2025-08-14 | 13F | Banque Transatlantique SA | 0 | -100.00 | 0 | |||||
| 2025-08-28 | NP | QEMM - SPDR MSCI Emerging Markets StrategicFactors ETF | 601 | -3.99 | 7 | 20.00 | ||||
| 2025-08-08 | 13F | Cetera Investment Advisers | 48,646 | 13.81 | 555 | 48.92 | ||||
| 2025-08-06 | 13F | First Horizon Advisors, Inc. | 1,014 | 79.15 | 12 | 175.00 | ||||
| 2025-07-11 | 13F | Pinnacle Bancorp, Inc. | 756 | 0.00 | 9 | 33.33 | ||||
| 2025-03-28 | NP | GERIX - Goldman Sachs Emerging Markets Equity Insights Fund Institutional | 74,600 | 0.00 | 659 | -3.09 | ||||
| 2025-08-14 | 13F | Quantinno Capital Management LP | 123,756 | 35.19 | 1,411 | 76.69 | ||||
| 2025-07-25 | 13F | Sequoia Financial Advisors, LLC | 37,156 | 424 | ||||||
| 2025-08-04 | 13F | Waterfront Wealth Inc. | 131,475 | -26.78 | 1,499 | -4.28 | ||||
| 2025-08-13 | 13F | Quadrant Capital Group Llc | 13,123 | -37.38 | 150 | -18.13 | ||||
| 2025-08-12 | 13F | MAI Capital Management | 1,269 | 14 | ||||||
| 2025-07-18 | 13F | Robeco Institutional Asset Management B.V. | 15,264,157 | -2.24 | 174,011 | 27.81 | ||||
| 2025-05-14 | 13F | Walleye Capital LLC | 0 | -100.00 | 0 | |||||
| 2025-06-30 | NP | VEU - Vanguard FTSE All-World ex-US Index Fund ETF Shares | 160,185 | -11.04 | 1,555 | -2.14 | ||||
| 2025-07-24 | 13F | Us Bancorp \de\ | 46,265 | 2.70 | 527 | 34.44 | ||||
| 2025-07-28 | 13F | BRYN MAWR TRUST Co | 0 | -100.00 | 0 | |||||
| 2025-08-14 | 13F | Macquarie Group Ltd | 2,895,585 | -0.44 | 33,010 | 30.16 | ||||
| 2025-05-13 | 13F | Daiwa Securities Group Inc. | 0 | -100.00 | 0 | |||||
| 2025-06-26 | NP | DFAE - Dimensional Emerging Core Equity Market ETF | 130,675 | 11.86 | 1,269 | 22.99 | ||||
| 2025-08-14 | 13F | Two Sigma Securities, Llc | 58,326 | 665 | ||||||
| 2025-08-12 | 13F | Advisors Asset Management, Inc. | 7,620 | 28.74 | 87 | 68.63 | ||||
| 2025-05-09 | 13F | GeoWealth Management, LLC | 0 | -100.00 | 0 | |||||
| 2025-08-11 | 13F | Principal Securities, Inc. | 140 | 8.53 | 2 | |||||
| 2025-08-13 | 13F | Groupama Asset Managment | 0 | -100.00 | 0 | |||||
| 2025-08-29 | NP | JVANX - International Equity Index Trust NAV | 6,017 | 0.00 | 69 | 30.77 | ||||
| 2025-08-04 | 13F | Spire Wealth Management | 777 | -14.62 | 9 | 14.29 | ||||
| 2025-08-12 | 13F | Proequities, Inc. | Put | 0 | 0 | |||||
| 2025-08-14 | 13F | Modern Wealth Management, LLC | 33,673 | -30.61 | 384 | -9.46 | ||||
| 2025-08-12 | 13F | Proequities, Inc. | Call | 0 | 0 | |||||
| 2025-08-12 | 13F | Proequities, Inc. | 0 | 0 | ||||||
| 2025-08-01 | 13F | Bessemer Group Inc | 34,176 | 19.72 | 0 | |||||
| 2025-08-14 | 13F | Driehaus Capital Management Llc | 173,081 | 0.00 | 1,973 | 30.75 | ||||
| 2025-07-29 | 13F | Private Trust Co Na | 1,071 | 0.00 | 12 | 33.33 | ||||
| 2025-08-14 | 13F | Qube Research & Technologies Ltd | 321,153 | -39.79 | 3,661 | -21.27 | ||||
| 2025-05-14 | 13F | SPX Equities Gestao de Recursos Ltda | 0 | -100.00 | 0 | |||||
| 2025-08-25 | NP | NXTG - First Trust Indxx NextG ETF This fund is a listed as child fund of First Trust Advisors Lp and if that institution has disclosed ownership in this security, then these positions will not be double counted when calculating total shares and total value | 193,265 | -15.24 | 2,203 | 10.81 | ||||
| 2025-08-13 | 13F | First Trust Advisors Lp | 582,690 | -11.47 | 6,643 | 15.73 | ||||
| 2025-07-18 | 13F | BSW Wealth Partners | 24,332 | -0.88 | 277 | 29.44 | ||||
| 2025-07-21 | 13F | Ameritas Advisory Services, LLC | 1,171 | 13 | ||||||
| 2025-07-24 | 13F | Standard Life Aberdeen plc | 2,847,740 | 0.10 | 32,464 | 30.87 | ||||
| 2025-07-31 | 13F | Carrera Capital Advisors | 13,650 | 156 | ||||||
| 2025-08-12 | 13F | LPL Financial LLC | 231,552 | 148.83 | 2,640 | 225.40 | ||||
| 2025-04-22 | NP | APIE - ActivePassive International Equity ETF | 0 | -100.00 | 0 | -100.00 | ||||
| 2025-08-05 | 13F | Simplex Trading, Llc | Put | 500 | 0.00 | 0 | ||||
| 2025-05-23 | NP | ARTKX - Artisan International Value Fund Investor Shares | 16,476,483 | 0.00 | 143,675 | 15.50 | ||||
| 2025-08-05 | 13F | Simplex Trading, Llc | 3,142 | 0 | ||||||
| 2025-08-06 | 13F | Moors & Cabot, Inc. | 0 | -100.00 | 0 | |||||
| 2025-08-05 | 13F | Simplex Trading, Llc | Call | 1,200 | -29.41 | 0 | ||||
| 2025-06-26 | NP | DFA INVESTMENT DIMENSIONS GROUP INC - World ex U.S. Core Equity Portfolio Institutional Class Shares | 1,013 | 0.00 | 10 | 12.50 | ||||
| 2025-07-08 | 13F | Parallel Advisors, LLC | 21,088 | 41.85 | 240 | 86.05 | ||||
| 2025-08-14 | 13F | Headlands Technologies LLC | 350 | 4 | ||||||
| 2025-08-05 | 13F | Huntington National Bank | 1 | 0.00 | 0 | |||||
| 2025-08-14 | 13F | Wells Fargo & Company/mn | 692,961 | 5.10 | 7,900 | 37.40 | ||||
| 2025-08-08 | 13F | SBI Securities Co., Ltd. | 3,440 | -9.07 | 39 | 21.88 | ||||
| 2025-07-21 | 13F | Mirae Asset Global Investments Co., Ltd. | 21,383 | 8.21 | 244 | 40.46 | ||||
| 2025-07-31 | 13F | AlTi Global, Inc. | 10,283 | 0.00 | 118 | 29.67 | ||||
| 2025-08-14 | 13F | Axa S.a. | 55,465 | 0.00 | 632 | 30.85 | ||||
| 2025-08-26 | NP | BINV - Brandes International ETF | 305,999 | 21.93 | 3,488 | 59.41 | ||||
| 2025-07-28 | NP | AVXC - Avantis Emerging Markets ex-China Equity ETF | 8,468 | 37.38 | 84 | 68.00 | ||||
| 2025-07-11 | 13F | Caldwell Securities, Inc | 202 | 0.00 | 2 | 100.00 | ||||
| 2025-08-14 | 13F | Raymond James Financial Inc | 86,030 | 9.52 | 981 | 43.27 | ||||
| 2025-07-16 | 13F | Signaturefd, Llc | 24,005 | 13.64 | 274 | 48.37 | ||||
| 2025-08-13 | 13F | Arrowstreet Capital, Limited Partnership | 5,754,523 | 54.77 | 65,602 | 102.33 | ||||
| 2025-07-17 | 13F | V-Square Quantitative Management LLC | 69,423 | 0.00 | 791 | 30.74 | ||||
| 2025-08-07 | 13F | Connor, Clark & Lunn Investment Management Ltd. | 226,538 | -41.73 | 2,583 | -23.83 | ||||
| 2025-03-27 | NP | BLACKROCK FUNDS - BlackRock Defensive Advantage Emerging Markets Fund Institutional This fund is a listed as child fund of BlackRock, Inc. and if that institution has disclosed ownership in this security, then these positions will not be double counted when calculating total shares and total value | 8,164 | 0.00 | 72 | -2.70 | ||||
| 2025-08-14 | 13F | State Street Corp | 210,225 | -35.35 | 2,472 | -17.11 | ||||
| 2025-05-01 | 13F | Bleakley Financial Group, LLC | 0 | -100.00 | 0 | -100.00 | ||||
| 2025-08-14 | 13F | Cubist Systematic Strategies, LLC | 8,071 | -89.61 | 92 | -86.41 | ||||
| 2025-05-15 | 13F | Jain Global LLC | 0 | -100.00 | 0 | |||||
| 2025-08-07 | 13F | Parkside Financial Bank & Trust | 0 | -100.00 | 0 | |||||
| 2025-08-14 | 13F | UBS Group AG | 365,552 | -40.73 | 4,167 | -22.52 | ||||
| 2025-07-29 | 13F | Commons Capital, Llc | 0 | -100.00 | 0 | |||||
| 2025-07-25 | 13F | Cwm, Llc | 148 | 0.00 | 0 | |||||
| 2025-08-15 | 13F | CI Private Wealth, LLC | 42,984 | 100.86 | 490 | 163.44 | ||||
| 2025-08-08 | 13F | Creative Planning | 45,545 | -31.53 | 519 | -10.52 | ||||
| 2025-08-14 | 13F | Bank Of America Corp /de/ | 1,035,304 | -36.42 | 11,802 | -16.88 | ||||
| 2025-08-08 | 13F | Crossmark Global Holdings, Inc. | 33,942 | 0.33 | 387 | 30.85 | ||||
| 2025-07-30 | 13F | Eqis Capital Management, Inc. | 51,906 | 592 | ||||||
| 2025-05-14 | 13F | Banco BTG Pactual S.A. | 0 | -100.00 | 0 | |||||
| 2025-08-12 | 13F | Summit Global Investments | 0 | -100.00 | 0 | |||||
| 2025-06-26 | NP | DAADX - Emerging Markets ex China Core Equity Portfolio Institutional Class | 13,442 | 0.00 | 131 | 10.17 | ||||
| 2025-08-11 | 13F | Citigroup Inc | 252 | -99.42 | 3 | -99.48 | ||||
| 2025-07-24 | 13F | Ramirez Asset Management, Inc. | 426,868 | 4,866 | ||||||
| 2025-08-14 | 13F | Mariner, LLC | 51,022 | 48.21 | 582 | 93.67 | ||||
| 2025-07-24 | 13F | Ronald Blue Trust, Inc. | 1,167 | -17.82 | 13 | 8.33 | ||||
| 2025-08-12 | 13F | Country Trust Bank | 251 | 3 | ||||||
| 2025-08-07 | 13F | Kestra Private Wealth Services, Llc | 26,855 | 306 | ||||||
| 2025-08-27 | 13F/A | Squarepoint Ops LLC | 33,058 | 23.25 | 377 | 61.37 | ||||
| 2025-08-07 | 13F | Allworth Financial LP | 4,452 | 0.00 | 51 | 19.05 | ||||
| 2025-08-11 | 13F | B. Metzler seel. Sohn & Co. AG | 19,293 | 0.00 | 220 | 30.36 | ||||
| 2025-07-18 | 13F | Truist Financial Corp | 59,465 | 41.63 | 678 | 84.97 | ||||
| 2025-08-08 | 13F | D'Orazio & Associates, Inc. | 22,131 | 80.66 | 252 | 137.74 | ||||
| 2025-07-31 | 13F | MQS Management LLC | 0 | -100.00 | 0 | |||||
| 2025-08-12 | 13F | Rhumbline Advisers | 6,611 | 56.18 | 75 | 108.33 | ||||
| 2025-08-14 | 13F | Millennium Management Llc | 67,913 | -48.35 | 774 | -32.46 | ||||
| 2025-08-11 | 13F | Empowered Funds, LLC | 19,803 | 226 | ||||||
| 2025-08-14 | 13F | Susquehanna International Group, Llp | 27,260 | 311 | ||||||
| 2025-08-08 | 13F | Pnc Financial Services Group, Inc. | 5,163 | 45.68 | 59 | 93.33 | ||||
| 2025-08-26 | NP | IXP - iShares Global Comm Services ETF | 43,638 | 35.15 | 497 | 76.87 | ||||
| 2025-07-21 | 13F | Ascent Group, LLC | 22,701 | 25.15 | 259 | 63.29 | ||||
| 2025-08-12 | 13F | Dimensional Fund Advisors Lp | 518,970 | 14.66 | 5,902 | 49.43 | ||||
| 2025-07-25 | 13F | CBOE Vest Financial, LLC | 11,798 | 7.49 | 134 | 41.05 | ||||
| 2025-08-07 | 13F | Montag A & Associates Inc | 868 | 0.00 | 10 | 28.57 | ||||
| 2025-07-30 | 13F | FNY Investment Advisers, LLC | 20,000 | 0 | ||||||
| 2025-05-05 | 13F | Lindbrook Capital, Llc | 4,920 | 74.59 | 43 | 100.00 | ||||
| 2025-07-30 | 13F | DekaBank Deutsche Girozentrale | 19,293 | 0.00 | 0 | |||||
| 2025-08-14 | 13F | Two Sigma Advisers, Lp | 364,300 | 38.46 | 4,153 | 81.04 | ||||
| 2025-07-15 | 13F | Ballentine Partners, LLC | 54,898 | 10.67 | 626 | 44.68 | ||||
| 2025-08-12 | 13F | Franklin Resources Inc | 63,176 | 10.07 | 720 | 44.00 | ||||
| 2025-08-14 | 13F | GWM Advisors LLC | 72 | 0.00 | 1 | |||||
| 2025-07-31 | 13F | R Squared Ltd | 0 | -100.00 | 0 | |||||
| 2025-07-14 | 13F | GAMMA Investing LLC | 10,034 | 7.03 | 114 | 40.74 | ||||
| 2025-06-30 | NP | VGTSX - Vanguard Total International Stock Index Fund Investor Shares | 898,342 | 0.00 | 8,723 | 9.96 | ||||
| 2025-07-29 | NP | SGLIX - SGI Global Equity Fund Class I Shares | 123,858 | -6.91 | 1,230 | 13.06 | ||||
| 2025-08-13 | 13F | Brandes Investment Partners, Lp | 3,480,597 | 3.54 | 39,679 | 35.36 | ||||
| 2025-06-26 | NP | DFEM - Dimensional Emerging Markets Core Equity 2 ETF | 88,514 | 36.15 | 859 | 49.65 | ||||
| 2025-08-14 | 13F | Graham Capital Management, L.P. | 0 | -100.00 | 0 | |||||
| 2025-07-28 | NP | NSI - National Security Emerging Markets Index ETF | 1,414 | 38.09 | 14 | 75.00 | ||||
| 2025-08-05 | 13F | Bank Of Montreal /can/ | 54,966 | 5.35 | 627 | 37.89 | ||||
| 2025-08-06 | 13F | True Wealth Design, LLC | 4 | 0.00 | 0 | |||||
| 2025-08-14 | 13F | Goldman Sachs Group Inc | 826,507 | 22.37 | 9,422 | 59.99 | ||||
| 2025-08-06 | 13F | Fox Run Management, L.l.c. | 19,098 | -69.80 | 218 | -60.62 | ||||
| 2025-08-14 | 13F | Point72 Asset Management, L.P. | 131,800 | 53.26 | 1,503 | 100.53 | ||||
| 2025-07-24 | 13F | Jfs Wealth Advisors, Llc | 91 | 0.00 | 1 | |||||
| 2025-08-14 | 13F | Group One Trading, L.p. | 0 | -100.00 | 0 | |||||
| 2025-07-25 | 13F | Hemington Wealth Management | 711 | 0.00 | 0 | |||||
| 2025-08-04 | 13F | Strs Ohio | 840,000 | 2.49 | 9,576 | 34.01 | ||||
| 2025-08-12 | 13F | Steward Partners Investment Advisory, Llc | 393 | 0.00 | 4 | 33.33 | ||||
| 2025-08-14 | 13F | Two Sigma Investments, Lp | 1,365,446 | 120.59 | 15,566 | 188.42 | ||||
| 2025-08-13 | 13F | PineBridge Investments, L.P. | 0 | -100.00 | 0 | |||||
| 2025-08-14 | 13F | Smartleaf Asset Management LLC | 18 | 0.00 | 0 | |||||
| 2025-08-14 | 13F | Stifel Financial Corp | 296,907 | 1.62 | 3,385 | 32.86 | ||||
| 2025-08-13 | 13F | Hudson Portfolio Management LLC | 16,084 | -1.96 | 84 | 10.53 | ||||
| 2025-08-13 | 13F | Amundi | 1,257,476 | 22.38 | 14,599 | 52.79 | ||||
| 2025-05-12 | 13F | Virtu Financial LLC | 0 | -100.00 | 0 | |||||
| 2025-07-11 | 13F | Farther Finance Advisors, LLC | 4,918 | 543.72 | 56 | 833.33 | ||||
| 2025-08-14 | 13F | Gould Capital, LLC | 150 | 0.00 | 2 | 0.00 | ||||
| 2025-08-21 | NP | MEMSX - Mercer Emerging Markets Equity Fund Class I | 124,215 | -11.36 | 1,416 | 15.97 | ||||
| 2025-07-15 | 13F | Public Employees Retirement System Of Ohio | 47,432 | -35.96 | 541 | -16.28 | ||||
| 2025-08-13 | 13F | Northern Trust Corp | 320,308 | 33.84 | 3,652 | 75.02 | ||||
| 2025-08-12 | 13F | XTX Topco Ltd | 0 | -100.00 | 0 | |||||
| 2025-08-29 | NP | Gabelli Global Utility & Income Trust | 17,000 | 0.00 | 194 | 30.41 | ||||
| 2025-08-29 | NP | GATAX - The Gabelli Asset Fund Class A | 36,000 | 0.00 | 410 | 30.99 | ||||
| 2025-06-26 | NP | DFCEX - Emerging Markets Core Equity Portfolio - Institutional Class This fund is a listed as child fund of Dimensional Fund Advisors Lp and if that institution has disclosed ownership in this security, then these positions will not be double counted when calculating total shares and total value | 78,886 | 0.00 | 766 | 9.91 | ||||
| 2025-08-13 | 13F | M&t Bank Corp | 38,982 | 20.67 | 444 | 58.01 | ||||
| 2025-07-31 | 13F | Sumitomo Mitsui Trust Holdings, Inc. | 144,687 | 1,649 | ||||||
| 2025-07-14 | 13F | UMA Financial Services, Inc. | 236 | 0.00 | 3 | 0.00 | ||||
| 2025-08-14 | 13F | Federation des caisses Desjardins du Quebec | 2,000 | 82.98 | 23 | 144.44 | ||||
| 2025-07-15 | 13F | Alhambra Investment Partners LLC | 11,437 | 130 | ||||||
| 2025-05-28 | NP | QCVAX - Clearwater International Fund | 148,021 | 0.00 | 1,291 | 15.49 | ||||
| 2025-08-14 | 13F | VPR Management LLC | 72,375 | 0.00 | 825 | 30.74 | ||||
| 2025-06-26 | NP | DFA INVESTMENT DIMENSIONS GROUP INC - Emerging Markets Social Core Equity Portfolio Shares | 10,963 | 0.00 | 106 | 10.42 | ||||
| 2025-06-26 | NP | DFSE - Dimensional Emerging Markets Sustainability Core 1 ETF | 13,200 | 4.76 | 128 | 15.32 | ||||
| 2025-08-01 | 13F | Envestnet Asset Management Inc | 729,193 | 62.33 | 8,313 | 112.20 | ||||
| 2025-07-07 | 13F | Northwest & Ethical Investments L.P. | 0 | -100.00 | 0 | -100.00 | ||||
| 2025-08-14 | 13F | Barometer Capital Management Inc. | 32,200 | 366 | ||||||
| 2025-07-30 | 13F | Cullen/frost Bankers, Inc. | 0 | -100.00 | 0 | |||||
| 2025-04-28 | 13F | DAVENPORT & Co LLC | 0 | -100.00 | 0 | |||||
| 2025-08-13 | 13F | Twin Peaks Wealth Advisors, LLC | 8 | 0 | ||||||
| 2025-08-14 | 13F/A | Barclays Plc | 1,290,641 | -2.46 | 15 | 27.27 | ||||
| 2025-07-14 | 13F | Kapitalo Investimentos Ltda | 209,476 | 2,388 | ||||||
| 2025-05-16 | 13F/A | Kestra Investment Management, LLC | 0 | -100.00 | 0 | |||||
| 2025-05-13 | 13F | Quadrature Capital Ltd | 0 | -100.00 | 0 | |||||
| 2025-08-14 | 13F | Atomi Financial Group, Inc. | 13,173 | 0.64 | 150 | 31.58 | ||||
| 2025-08-14 | 13F | Verition Fund Management LLC | 65,056 | 2.46 | 742 | 34.00 | ||||
| 2025-06-23 | NP | UBPIX - Ultralatin America Profund Investor Class | 7,768 | -7.44 | 75 | 1.35 | ||||
| 2025-08-12 | 13F | Jpmorgan Chase & Co | 79,937 | 31.13 | 911 | 71.56 | ||||
| 2025-08-12 | 13F | ABN AMRO Bank N.V. | 122,444 | 15.76 | 1,402 | 52.12 | ||||
| 2025-08-14 | 13F/A | Skopos Labs, Inc. | 11,447 | 44.10 | 130 | 88.41 | ||||
| 2025-07-16 | 13F | Kathmere Capital Management, LLC | 64,377 | 79.56 | 734 | 134.94 | ||||
| 2025-03-31 | NP | VIHAX - Vanguard International High Dividend Yield Index Fund Admiral Shares | 75,372 | 0.00 | 666 | -3.06 | ||||
| 2025-07-21 | 13F | Quent Capital, LLC | 0 | -100.00 | 0 | |||||
| 2025-08-14 | 13F | Parvin Asset Management, LLC | 6,775 | 0.00 | 77 | 30.51 | ||||
| 2025-06-13 | NP | abrdn Funds - abrdn Emerging Markets Dividend Active ETF | 115,657 | 1,123 | ||||||
| 2025-06-26 | NP | DEXC - Dimensional Emerging Markets ex China Core Equity ETF | 5,000 | 13.64 | 49 | 26.32 | ||||
| 2025-08-13 | 13F | Natixis Advisors, L.p. | 158,223 | 8.11 | 2 | 0.00 | ||||
| 2025-08-29 | NP | GAUAX - The Gabelli Utilities Fund Class A | 125,000 | 0.00 | 1,425 | 30.73 | ||||
| 2025-06-26 | NP | DFAX - Dimensional World ex U.S. Core Equity 2 ETF | 43,649 | 207.52 | 424 | 238.40 | ||||
| 2025-08-12 | 13F | Wayfinding Financial, LLC | 0 | -100.00 | 0 | |||||
| 2025-08-14 | 13F | Wellington Management Group Llp | 390,702 | -0.94 | 4,454 | 29.51 | ||||
| 2025-07-28 | NP | AVEEX - Avantis Emerging Markets Equity Fund Institutional Class This fund is a listed as child fund of American Century Companies Inc and if that institution has disclosed ownership in this security, then these positions will not be double counted when calculating total shares and total value | 23,694 | 0.00 | 235 | 21.76 | ||||
| 2025-08-12 | 13F | American Century Companies Inc | 164,985 | 9.90 | 1,881 | 43.62 | ||||
| 2025-06-26 | 13F/A | Deutsche Bank Ag\ | 0 | -100.00 | 0 | |||||
| 2025-04-23 | 13F | Wealthquest Corp | 17,883 | 2,088 | ||||||
| 2025-08-06 | 13F | Savant Capital, LLC | 17,045 | 194 | ||||||
| 2025-06-25 | NP | IEMGX - Voya Multi-Manager Emerging Markets Equity Fund Class I | 37,141 | -47.67 | 361 | -42.49 | ||||
| 2025-08-04 | 13F | Hantz Financial Services, Inc. | 146,177 | 10.94 | 2 | 0.00 | ||||
| 2025-08-13 | 13F | Renaissance Technologies Llc | 1,935,600 | -8.66 | 22,066 | 19.41 | ||||
| 2025-08-13 | 13F | Invesco Ltd. | 1,196,143 | -17.25 | 13,636 | 8.19 | ||||
| 2025-08-12 | 13F | O'shaughnessy Asset Management, Llc | 974,798 | 36.71 | 11,113 | 78.74 | ||||
| 2025-08-14 | 13F | Voloridge Investment Management, Llc | 270,170 | -3.41 | 3,080 | 26.24 | ||||
| 2025-08-14 | 13F | Wiley Bros.-aintree Capital, Llc | 12,108 | 138 | ||||||
| 2025-08-15 | 13F | WealthCollab, LLC | 994 | 0.00 | 11 | 37.50 | ||||
| 2025-07-24 | 13F | IFP Advisors, Inc | 2,976 | 0.00 | 34 | 32.00 | ||||
| 2025-08-14 | 13F | Ieq Capital, Llc | 10,219 | 116 | ||||||
| 2025-04-11 | 13F | First Affirmative Financial Network | 28,784 | 26.61 | 251 | 46.78 | ||||
| 2025-08-11 | 13F | Vanguard Group Inc | 976,903 | -18.58 | 11,137 | 6.43 | ||||
| 2025-07-22 | 13F | JGP Global Gestao de Recursos Ltda. | 100,000 | 1,140 | ||||||
| 2025-08-13 | 13F | Gabelli Funds Llc | 268,000 | 0.00 | 3,055 | 30.78 | ||||
| 2025-08-26 | NP | Delaware Vip Trust - Delaware Vip Emerging Markets Series Standard Class | 259,915 | 0.00 | 2,963 | 30.76 | ||||
| 2025-05-20 | 13F/A | Colony Group, LLC | 0 | -100.00 | 0 | |||||
| 2025-08-25 | NP | TDIV - First Trust NASDAQ Technology Dividend Index Fund This fund is a listed as child fund of First Trust Advisors Lp and if that institution has disclosed ownership in this security, then these positions will not be double counted when calculating total shares and total value | 383,409 | -9.23 | 4,371 | 18.65 | ||||
| 2025-07-29 | NP | RBB FUND, INC. - Aquarius International Fund | 13,700 | 0.00 | 136 | 22.52 | ||||
| 2025-08-14 | 13F | Sei Investments Co | 16,475 | -98.18 | 188 | -97.63 | ||||
| 2025-06-25 | NP | TDVI - FT Vest Technology Dividend Target Income ETF | 12,170 | 16.82 | 118 | 29.67 | ||||
| 2025-07-28 | 13F | Ritholtz Wealth Management | 151,259 | 80.36 | 1,724 | 135.84 | ||||
| 2025-07-31 | 13F | Stegent Equity Advisors, Inc. | 35,778 | 408 | ||||||
| 2025-08-11 | 13F | Brown Brothers Harriman & Co | 108 | 1 | ||||||
| 2025-06-25 | NP | VVIFX - Voya VACS Series EME Fund | 48,372 | -30.88 | 470 | -23.99 | ||||
| 2025-08-14 | 13F | Citadel Advisors Llc | Put | 0 | -100.00 | 0 | ||||
| 2025-08-12 | 13F | Longfellow Investment Management Co Llc | 260,062 | -4.95 | 2,965 | 24.28 | ||||
| 2025-08-14 | 13F | Mercer Global Advisors Inc /adv | 31,752 | 5.32 | 362 | 37.79 | ||||
| 2025-08-15 | 13F | Morgan Stanley | 563,373 | 3.16 | 6,422 | 34.86 | ||||
| 2025-07-31 | 13F | Caitong International Asset Management Co., Ltd | 51 | 1 | ||||||
| 2025-08-14 | 13F | Jane Street Group, Llc | 367,686 | 4,192 | ||||||
| 2025-08-14 | 13F | Aqr Capital Management Llc | 34,231 | -9.72 | 390 | 18.18 | ||||
| 2025-05-01 | 13F | Schechter Investment Advisors, LLC | 74,812 | 64.41 | 652 | 90.09 | ||||
| 2025-05-13 | 13F | Quantbot Technologies LP | 0 | -100.00 | 0 | -100.00 | ||||
| 2025-08-29 | NP | Gabelli Multimedia Trust Inc. | 20,000 | 0.00 | 228 | 31.03 | ||||
| 2025-08-11 | 13F | Covestor Ltd | 1,966 | 736.60 | 0 | |||||
| 2025-05-15 | 13F | D. E. Shaw & Co., Inc. | 0 | -100.00 | 0 | |||||
| 2025-08-12 | 13F | Artisan Partners Limited Partnership | 0 | -100.00 | 0 | |||||
| 2025-08-14 | 13F | Citadel Advisors Llc | 162,176 | -15.78 | 1,849 | 10.07 | ||||
| 2025-08-12 | 13F | Global Retirement Partners, LLC | 271 | 204.49 | 3 | |||||
| 2025-08-29 | NP | Gabelli Equity Trust Inc | 70,000 | 0.00 | 798 | 30.82 | ||||
| 2025-04-14 | 13F | Yousif Capital Management, Llc | 0 | -100.00 | 0 | |||||
| 2025-08-13 | 13F | Hsbc Holdings Plc | 188,198 | 19.84 | 2,147 | 58.73 | ||||
| 2025-07-30 | 13F | Ethic Inc. | 140,576 | 11.79 | 1,562 | 35.98 | ||||
| 2025-08-13 | 13F | Jones Financial Companies Lllp | 4,354 | 69.28 | 48 | 118.18 |