Mga Batayang Estadistika
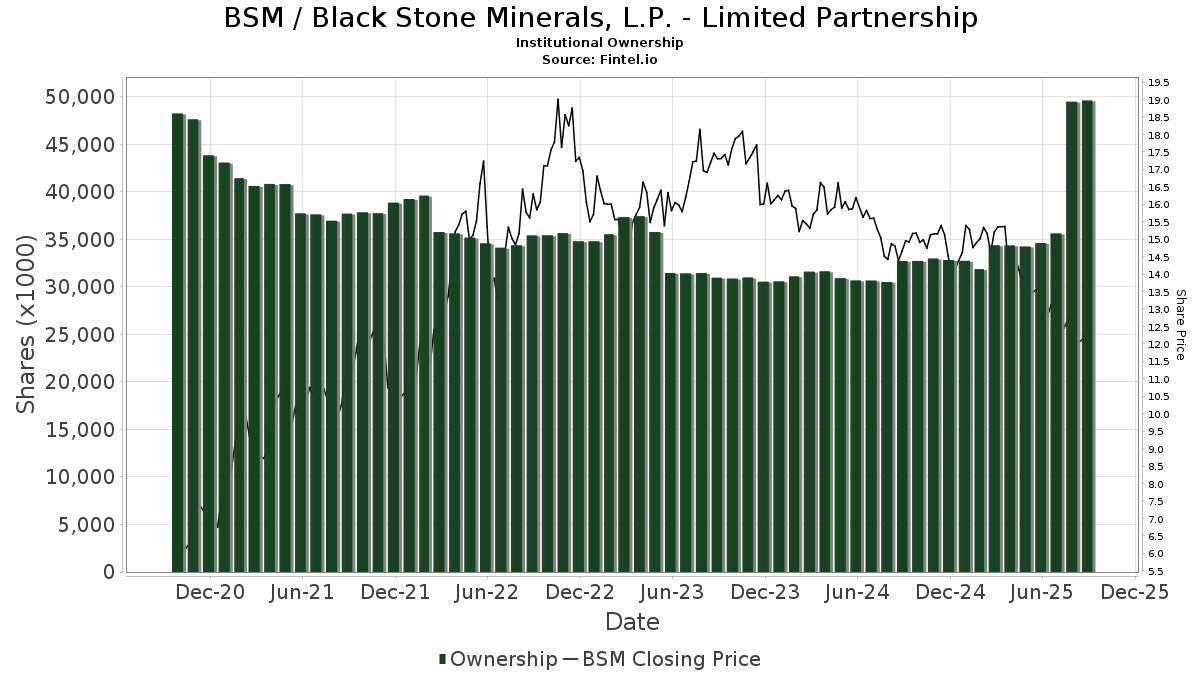
| Saham Institusional (Jangka Panjang) | 49,612,875 - 23.42% (ex 13D/G) - change of 15.03MM shares 43.42% MRQ |
| Nilai Institusional (Jangka Panjang) | $ 467,414 USD ($1000) |
Kepemilikan Institusional dan Pemegang Saham
Black Stone Minerals, L.P. - Limited Partnership (US:BSM) memiliki 211 pemilik institusional dan pemegang saham yang telah mengajukan formulir 13D/G atau 13F kepada Komisi Bursa Efek (Securities Exchange Commission/SEC). Lembaga-lembaga ini memegang total 49,612,875 saham. Pemegang saham terbesar meliputi Kingstone Capital Partners Texas, LLC, William Marsh Rice University, Morgan Stanley, Bank Of America Corp /de/, Penn Davis Mcfarland Inc, Investment Management Associates Inc /adv, Natixis, UBS Group AG, MIRAE ASSET GLOBAL ETFS HOLDINGS Ltd., and DIV - Global X SuperDividend U.S. ETF .
Struktur kepemilikan institusional Black Stone Minerals, L.P. - Limited Partnership (NYSE:BSM) menunjukkan posisi terkini di perusahaan oleh institusi dan dana, serta perubahan terbaru dalam ukuran posisi. Pemegang saham utama dapat mencakup investor individu, reksa dana, dana lindung nilai, atau institusi. Jadwal 13D menunjukkan bahwa investor memegang (atau pernah memegang) lebih dari 5% saham perusahaan dan bermaksud (atau pernah bermaksud) untuk secara aktif mengejar perubahan strategi bisnis. Jadwal 13G menunjukkan investasi pasif lebih dari 5%.
The share price as of September 5, 2025 is 11.95 / share. Previously, on September 6, 2024, the share price was 14.10 / share. This represents a decline of 15.25% over that period.
Skor Sentimen Dana
Skor Sentimen Dana (sebelumnya dikenal sebagai Skor Akumulasi Kepemilikan) menemukan saham-saham yang paling banyak dibeli oleh dana. Ini adalah hasil dari model kuantitatif multi-faktor yang canggih yang mengidentifikasi perusahaan dengan tingkat akumulasi institusional tertinggi. Model penilaian menggunakan kombinasi dari total peningkatan pemilik yang diungkapkan, perubahan dalam alokasi portofolio pada pemilik tersebut, dan metrik lainnya. Angka berkisar dari 0 hingga 100, dengan angka yang lebih tinggi menunjukkan tingkat akumulasi yang lebih tinggi dibandingkan dengan perusahaan sejenisnya, dan 50 adalah rata-ratanya.
Frekuensi Pembaruan: Setiap Hari
Lihat Ownership Explorer, yang menyediakan daftar perusahaan dengan peringkat tertinggi.
Rasio Put/Call Institusional
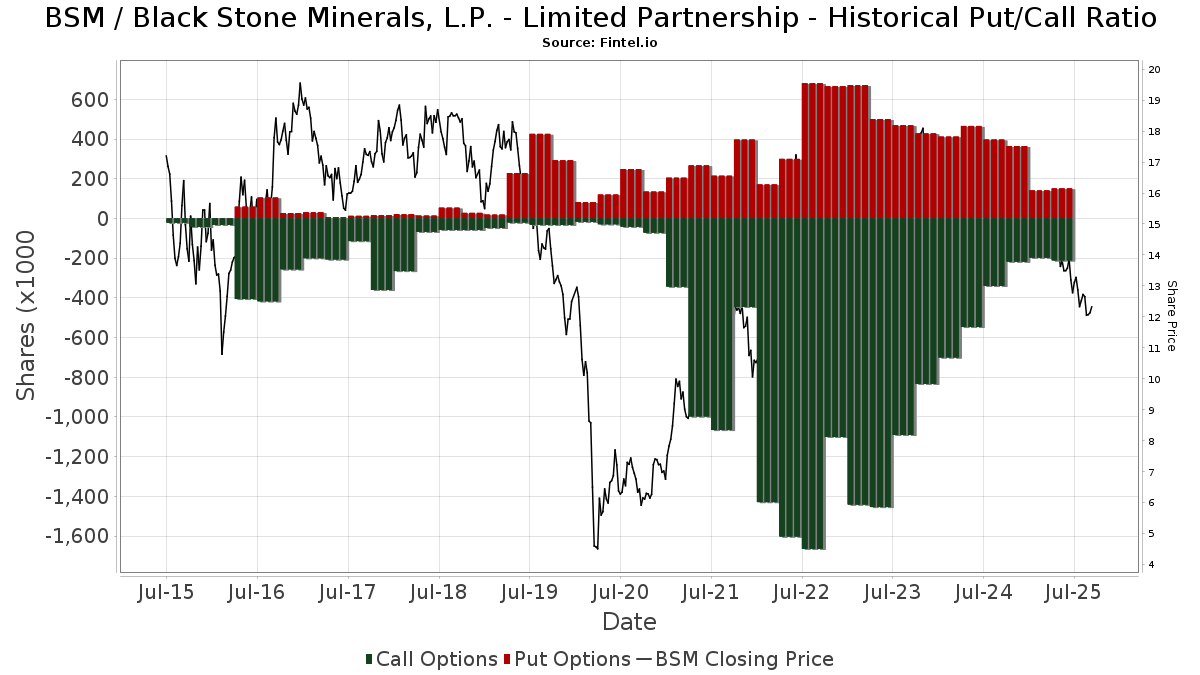
Selain melaporkan isu ekuitas dan utang standar, institusi dengan aset di bawah manajemen lebih dari 100 juta dolar AS juga harus mengungkapkan kepemilikan opsi put dan call mereka. Karena opsi put umumnya menunjukkan sentimen negatif, dan opsi call menunjukkan sentimen positif, kita dapat mengetahui sentimen institusional secara keseluruhan dengan memplot rasio put terhadap call. Grafik di sebelah kanan memplot rasio put/call historis untuk instrumen ini.
Menggunakan Rasio Put/Call sebagai indikator sentimen investor mengatasi salah satu kekurangan utama dari penggunaan total kepemilikan institusional, yaitu sejumlah besar aset yang dikelola diinvestasikan secara pasif untuk melacak indeks. Dana yang dikelola secara pasif biasanya tidak membeli opsi, sehingga indikator rasio put/call lebih akurat dalam melacak sentimen dana yang dikelola secara aktif.
Pengajuan 13D/G
Kami menyajikan pengajuan 13D/G secara terpisah dari pengajuan 13F karena perlakuan yang berbeda oleh SEC. Pengajuan 13D/G dapat diajukan oleh kelompok investor (dengan satu pemimpin), sedangkan pengajuan 13F tidak bisa. Hal ini mengakibatkan situasi di mana seorang investor dapat mengajukan 13D/G yang melaporkan satu nilai untuk total saham (mewakili semua saham yang dimiliki oleh kelompok investor), tetapi kemudian mengajukan 13F yang melaporkan nilai yang berbeda untuk total saham (mewakili kepemilikan mereka sendiri). Ini berarti bahwa kepemilikan saham dari pengajuan 13D/G dan pengajuan 13F seringkali tidak dapat dibandingkan secara langsung, sehingga kami menyajikannya secara terpisah.
Catatan: Mulai 16 Mei 2021, kami tidak lagi menampilkan pemilik yang belum mengajukan 13D/G dalam setahun terakhir. Sebelumnya, kami menampilkan riwayat lengkap pengajuan 13D/G. Secara umum, entitas yang diwajibkan untuk mengajukan pengajuan 13D/G harus mengajukan setidaknya setiap tahun sebelum mengirimkan pengajuan penutupan. Namun, terkadang dana keluar dari posisi tanpa mengirimkan pengajuan penutupan (misalnya, mereka menghentikan operasi), sehingga menampilkan riwayat lengkap terkadang menyebabkan kebingungan tentang kepemilikan saat ini. Untuk mencegah kebingungan, kami sekarang hanya menampilkan pemilik 'saat ini' - yaitu - pemilik yang telah mengajukan dalam setahun terakhir.
Upgrade to unlock premium data.
| Tanggal File | Formulir | Investor | Sebelumnya Saham |
Terbaru Saham |
Δ Saham (Persen) |
Kepemilikan (Persen) |
Δ Pagmamay-ari (Persen) |
|
|---|---|---|---|---|---|---|---|---|
| 2025-05-13 | Carlyle Group Inc. | 14,711,219 | 0 | -100.00 | 0.00 | -100.00 |
Pengajuan 13F dan NPORT
Detail pada pengajuan 13F tersedia gratis. Detail pada pengajuan NP memerlukan keanggotaan premium. Baris berwarna hijau menunjukkan posisi baru. Baris berwarna merah menunjukkan posisi yang sudah ditutup. Klik tautan ini ikon untuk melihat riwayat transaksi selengkapnya.
Tingkatkan
untuk membuka data premium dan mengekspor ke Excel ![]() .
.
| Tanggal File | Sumber | Investor | Ketik | Presyo ng Avg (Silangan) |
Saham | Δ Saham (%) |
Dilaporkan Nilai ($1000) |
Nilai Δ (%) |
Alokasi Port (%) |
|
|---|---|---|---|---|---|---|---|---|---|---|
| 2025-07-11 | 13F | Farther Finance Advisors, LLC | 1,475 | 0.00 | 19 | -13.64 | ||||
| 2025-07-15 | 13F | Kempner Capital Management Inc. | 759,343 | 52.29 | 9,932 | 141,785.71 | ||||
| 2025-07-25 | 13F | Hazlett, Burt & Watson, Inc. | 14 | 0.00 | 0 | |||||
| 2025-08-12 | 13F | Franklin Resources Inc | 67,018 | -7.38 | 877 | -20.65 | ||||
| 2025-07-16 | 13F | William Marsh Rice University | 5,663,476 | 0.00 | 74,078 | -14.34 | ||||
| 2025-08-13 | 13F | Beacon Pointe Advisors, LLC | 99,903 | 0.13 | 1,307 | -14.25 | ||||
| 2025-08-14 | 13F | Hilltop Holdings Inc. | 12,900 | 0.00 | 169 | -14.29 | ||||
| 2025-04-07 | 13F | AdvisorNet Financial, Inc | 0 | -100.00 | 0 | |||||
| 2025-08-01 | 13F | Motco | 3,650 | 46 | ||||||
| 2025-07-14 | 13F | Clear Harbor Asset Management, LLC | 52,032 | 0.00 | 681 | -14.36 | ||||
| 2025-07-10 | 13F | Redhawk Wealth Advisors, Inc. | 10,489 | 137 | ||||||
| 2025-08-13 | 13F | Northern Trust Corp | 298,164 | -1.65 | 3,900 | -15.77 | ||||
| 2025-09-04 | 13F/A | Advisor Group Holdings, Inc. | 33,567 | -20.01 | 439 | -31.41 | ||||
| 2025-05-16 | 13F | Coppell Advisory Solutions LLC | 0 | -100.00 | 0 | |||||
| 2025-08-14 | 13F | Mariner, LLC | 14,057 | -71.53 | 184 | -75.73 | ||||
| 2025-08-04 | 13F | Flagship Harbor Advisors, Llc | 26,323 | 1.32 | 344 | -13.13 | ||||
| 2025-07-08 | 13F | Baker Ellis Asset Management LLC | 11,000 | -8.33 | 144 | -21.86 | ||||
| 2025-08-11 | 13F | Rahlfs Capital, Llc | 84,267 | 0.00 | 1,102 | -14.31 | ||||
| 2025-08-12 | 13F | BlackRock, Inc. | 700 | 16.67 | 9 | 0.00 | ||||
| 2025-08-06 | 13F | Pekin Hardy Strauss, Inc. | 18,000 | 0.00 | 235 | -14.23 | ||||
| 2025-08-12 | 13F | Holderness Investments Co | 10,650 | 139 | ||||||
| 2025-05-12 | 13F | Virtu Financial LLC | 0 | -100.00 | 0 | |||||
| 2025-05-13 | 13F | Aptus Capital Advisors, LLC | 0 | -100.00 | 0 | |||||
| 2025-07-16 | 13F | Eagle Global Advisors Llc | 89,122 | 0.00 | 1,166 | -14.34 | ||||
| 2025-05-13 | 13F | Lee Financial Co | 0 | -100.00 | 0 | |||||
| 2025-08-14 | 13F | Bank Of America Corp /de/ | 2,543,814 | 0.69 | 33,273 | -13.74 | ||||
| 2025-08-12 | 13F | Indie Asset Partners, LLC | 15,500 | -1.27 | 203 | -15.48 | ||||
| 2025-08-14 | 13F | Evergreen Capital Management Llc | 260,190 | -1.11 | 3,403 | -15.29 | ||||
| 2025-07-10 | 13F | Wealth Enhancement Advisory Services, Llc | 10,281 | 135 | ||||||
| 2025-08-06 | 13F | Adviser Investments LLC | 58,873 | 0.00 | 770 | -14.25 | ||||
| 2025-08-14 | 13F | Vident Advisory, LLC | 0 | -100.00 | 0 | |||||
| 2025-07-31 | 13F | Sumitomo Mitsui Trust Holdings, Inc. | 68,000 | 0.00 | 889 | -14.35 | ||||
| 2025-08-12 | 13F | MAI Capital Management | 11,509 | -23.20 | 151 | -34.21 | ||||
| 2025-07-15 | 13F | Penn Davis Mcfarland Inc | 1,851,892 | -0.53 | 24,223 | -14.80 | ||||
| 2025-06-25 | NP | VRAI - Virtus Real Asset Income ETF | 10,196 | -3.73 | 144 | -6.54 | ||||
| 2025-08-18 | 13F | Geneos Wealth Management Inc. | 5,180 | 0.00 | 68 | -15.19 | ||||
| 2025-06-25 | NP | FTLS - First Trust Long/Short Equity ETF This fund is a listed as child fund of First Trust Advisors Lp and if that institution has disclosed ownership in this security, then these positions will not be double counted when calculating total shares and total value | 26,114 | -84.67 | 368 | -86.83 | ||||
| 2025-08-14 | 13F | Sunbelt Securities, Inc. | 21,294 | -0.34 | 311 | -4.91 | ||||
| 2025-05-27 | NP | AZBAX - AllianzGI Small-Cap Fund Class A | 15,285 | 98.89 | 233 | 395.74 | ||||
| 2025-08-13 | 13F | Virtus Investment Advisers, Inc. | 12,987 | 21.29 | 170 | 3.68 | ||||
| 2025-07-24 | 13F | Us Bancorp \de\ | 19,775 | 10.17 | 259 | -5.84 | ||||
| 2025-07-28 | 13F | Kiker Wealth Management, LLC | 10,750 | 0.00 | 141 | -14.63 | ||||
| 2025-07-22 | 13F | MAS Advisors LLC | 26,176 | 4.14 | 342 | -10.70 | ||||
| 2025-08-13 | 13F | Fiduciary Group LLC | 25,120 | 18.39 | 329 | 1.55 | ||||
| 2025-08-20 | NP | LSPAX - LoCorr Spectrum Income Fund Class A | 61,024 | 0.00 | 798 | -14.29 | ||||
| 2025-06-26 | NP | GYLD - Arrow Dow Jones Global Yield ETF | 8,868 | -5.55 | 125 | -7.41 | ||||
| 2025-08-11 | 13F | Annis Gardner Whiting Capital Advisors, LLC | 500 | 0.00 | 7 | -14.29 | ||||
| 2025-08-14 | 13F | IHT Wealth Management, LLC | 22,598 | 5.14 | 296 | -10.06 | ||||
| 2025-08-20 | NP | CONWX - Concorde Wealth Management Fund | 100,336 | 0.00 | 1,312 | -14.36 | ||||
| 2025-07-11 | 13F | Caldwell Securities, Inc | 55,790 | 0.00 | 730 | -14.34 | ||||
| 2025-06-25 | NP | CCNR - ALPS | CoreCommodity Natural Resources ETF | 45,177 | 13.46 | 637 | 10.59 | ||||
| 2025-07-29 | 13F | Regions Financial Corp | 395,999 | 1.41 | 5,180 | -13.13 | ||||
| 2025-07-31 | 13F | Cambridge Investment Research Advisors, Inc. | 399,907 | 1.02 | 5 | -16.67 | ||||
| 2025-08-14 | 13F | Icon Wealth Advisors, LLC | 84,263 | 2.71 | 1,102 | -11.98 | ||||
| 2025-04-15 | 13F | SJS Investment Consulting Inc. | 0 | -100.00 | 0 | -100.00 | ||||
| 2025-08-11 | 13F | Strategic Wealth Partners, Ltd. | 534 | 7 | ||||||
| 2025-07-17 | 13F | Sound Income Strategies, LLC | 1,300 | 17 | ||||||
| 2025-08-13 | 13F | Van Hulzen Asset Management, LLC | 0 | -100.00 | 0 | |||||
| 2025-08-13 | 13F | ARGI Investment Services, LLC | 157 | -3.09 | 315 | -14.40 | ||||
| 2025-08-28 | NP | KVLE - KFA Value Line(R) Dynamic Core Equity Index ETF | 0 | -100.00 | 0 | -100.00 | ||||
| 2025-08-01 | 13F | Chilton Capital Management Llc | 209 | 0.00 | 3 | -33.33 | ||||
| 2025-07-31 | 13F | Mcdaniel Terry & Co | 119,987 | 0.00 | 1,569 | 156,800.00 | ||||
| 2025-08-06 | 13F | O'Brien Greene & Co. Inc | 100,000 | 0.00 | 1,308 | -14.34 | ||||
| 2025-07-10 | 13F | Exchange Traded Concepts, Llc | 20,855 | 173.58 | 273 | 134.48 | ||||
| 2025-08-14 | 13F | BancorpSouth Bank | 40,097 | 2.72 | 524 | -12.08 | ||||
| 2025-07-30 | NP | SOAEX - Spirit of America Energy Fund Class A | 164,999 | -27.31 | 2,203 | -35.14 | ||||
| 2025-07-21 | 13F | Hilltop National Bank | 11,900 | 3.48 | 156 | -7.19 | ||||
| 2025-08-12 | 13F | AlphaCore Capital LLC | 93,980 | 18.99 | 1,229 | 1.91 | ||||
| 2025-08-12 | 13F | SRS Capital Advisors, Inc. | 2,303 | 2.72 | 30 | -11.76 | ||||
| 2025-08-05 | 13F | Chase Investment Counsel Corp | 34,914 | 0.00 | 0 | |||||
| 2025-05-15 | 13F | Hrt Financial Lp | 0 | -100.00 | 0 | |||||
| 2025-08-14 | 13F | UBS Group AG | 1,253,920 | 29.20 | 16,401 | 10.68 | ||||
| 2025-07-15 | 13F | Colonial River Wealth Management, LLC | 19,050 | -3.05 | 253 | -16.00 | ||||
| 2025-07-28 | 13F | Harbour Investments, Inc. | 2 | 0 | ||||||
| 2025-08-06 | 13F | Moors & Cabot, Inc. | 63,000 | 1.45 | 824 | -13.08 | ||||
| 2025-08-11 | 13F | Lummis Asset Management, LP | 340,513 | 0.00 | 4,268 | -11.23 | ||||
| 2025-08-14 | 13F | Mercer Global Advisors Inc /adv | 93,592 | -1.34 | 1,224 | -15.47 | ||||
| 2025-07-01 | 13F | Cullen Investment Group, Ltd. | 15,667 | 2.71 | 205 | -12.07 | ||||
| 2025-08-11 | 13F | HighTower Advisors, LLC | 655,630 | 62.73 | 8,576 | 39.39 | ||||
| 2025-08-06 | 13F | Ing Groep Nv | 161,000 | 2,106 | ||||||
| 2025-08-08 | 13F | Hartland & Co., LLC | 0 | -100.00 | 0 | |||||
| 2025-08-07 | 13F | Zions Bancorporation, National Association /ut/ | 82,533 | 0.00 | 1,080 | -14.37 | ||||
| 2025-05-29 | NP | DSMC - Distillate Small/Mid Cash Flow ETF | 30,452 | -4.05 | 465 | 0.43 | ||||
| 2025-08-14 | 13F | Mudita Advisors LLP | 760,877 | 0.00 | 9,952 | -14.34 | ||||
| 2025-07-25 | 13F | Cwm, Llc | 538 | 0.00 | 0 | |||||
| 2025-07-29 | 13F | LMG Wealth Partners, LLC | 150,245 | 0.00 | 1,965 | -14.34 | ||||
| 2025-08-04 | 13F | Savvy Advisors, Inc. | 15,420 | 202 | ||||||
| 2025-08-14 | 13F | Jane Street Group, Llc | Call | 47,400 | 620 | |||||
| 2025-08-06 | 13F | Savant Capital, LLC | 90,742 | 0.00 | 1,187 | -14.37 | ||||
| 2025-08-19 | 13F | State of Wyoming | 31,657 | -8.22 | 414 | -21.29 | ||||
| 2025-08-12 | 13F | CIBC Private Wealth Group, LLC | 125,295 | -19.72 | 1,639 | -19.94 | ||||
| 2025-08-12 | 13F | Horizon Kinetics Asset Management Llc | 268,638 | 0.00 | 3,514 | -14.36 | ||||
| 2025-07-30 | 13F | Avidian Wealth Solutions, LLC | 29,000 | 0.00 | 379 | -14.25 | ||||
| 2025-08-12 | 13F | Jpmorgan Chase & Co | 17,982 | -84.55 | 235 | -86.77 | ||||
| 2025-08-14 | 13F | Bramshill Investments, LLC | 66,594 | 2.87 | 871 | -11.84 | ||||
| 2025-08-13 | 13F | SCS Capital Management LLC | 0 | -100.00 | 0 | |||||
| 2025-07-21 | 13F | Franklin Street Advisors Inc /nc | 20,000 | 0.00 | 0 | |||||
| 2025-08-04 | 13F | Creekmur Asset Management LLC | 12 | 0 | ||||||
| 2025-08-05 | 13F | Magnolia Capital Advisors Llc | 10,000 | 0.00 | 131 | -14.47 | ||||
| 2025-08-07 | 13F | Cypress Capital Management LLC (WY) | 600 | 0.00 | 8 | -22.22 | ||||
| 2025-08-12 | 13F | Bahl & Gaynor Inc | 61,500 | 0.00 | 804 | -14.38 | ||||
| 2025-07-14 | 13F | U.S. Capital Wealth Advisors, LLC | 21,956 | 0.86 | 287 | -13.55 | ||||
| 2025-08-12 | 13F | Clear Street Markets Llc | 0 | -100.00 | 0 | |||||
| 2025-07-21 | 13F | Vaughan Nelson Investment Management, L.p. | 5,600 | 0.00 | 73 | |||||
| 2025-07-10 | 13F | Moody National Bank Trust Division | 19,136 | 1.18 | 250 | -13.19 | ||||
| 2025-06-27 | NP | ZIG - The Acquirers Fund | 78,737 | -18.52 | 1,111 | -23.61 | ||||
| 2025-07-28 | 13F | Axxcess Wealth Management, Llc | 19,050 | -3.05 | 249 | -17.00 | ||||
| 2025-08-28 | NP | Amplify ETF Trust - Amplify Natural Resources Dividend Income ETF | 12,537 | -55.83 | 164 | -62.36 | ||||
| 2025-08-14 | 13F | EP Wealth Advisors, Inc. | 11,438 | 0.01 | 150 | -14.37 | ||||
| 2025-08-06 | 13F | Commonwealth Equity Services, Llc | 34,411 | 2.36 | 0 | |||||
| 2025-07-21 | 13F | F&V Capital Management, LLC | 0 | -100.00 | 0 | |||||
| 2025-08-13 | 13F | Invesco Ltd. | 94,180 | 10.22 | 1,232 | -5.60 | ||||
| 2025-07-24 | 13F | WMG Financial Advisors, LLC | 15,750 | 206 | ||||||
| 2025-08-13 | 13F | Aristides Capital LLC | 34,396 | 0.00 | 450 | -14.48 | ||||
| 2025-08-13 | 13F | Twin Peaks Wealth Advisors, LLC | 30 | 0 | ||||||
| 2025-08-13 | 13F | Cresset Asset Management, LLC | 596,853 | 0.00 | 7,807 | -14.34 | ||||
| 2025-08-13 | 13F | Natixis | 1,457,000 | -1.40 | 19,058 | -15.43 | ||||
| 2025-08-06 | 13F | North Capital, Inc. | 3,000 | 0.00 | 39 | -13.33 | ||||
| 2025-05-06 | 13F | Corps Capital Advisors, LLC | 0 | -100.00 | 0 | |||||
| 2025-07-29 | 13F | LB Partners LLC | 10,000 | 0.00 | 131 | -14.47 | ||||
| 2025-08-14 | 13F | Goldman Sachs Group Inc | 37,352 | 489 | ||||||
| 2025-08-14 | 13F | Avenir Corp | 73,900 | 0.00 | 967 | -14.36 | ||||
| 2025-08-18 | 13F | Wolverine Trading, Llc | Put | 0 | -100.00 | 0 | ||||
| 2025-08-05 | 13F | Simplex Trading, Llc | 3,513 | 0 | ||||||
| 2025-08-05 | 13F | Simplex Trading, Llc | Call | 56,000 | -7.13 | 1 | ||||
| 2025-08-06 | 13F | First Eagle Investment Management, LLC | 14,564 | 0.00 | 190 | -14.41 | ||||
| 2025-07-08 | 13F | Parallel Advisors, LLC | 381 | 2.70 | 5 | -20.00 | ||||
| 2025-07-11 | 13F | Arrow Investment Advisors, LLC | 10,943 | 143 | ||||||
| 2025-04-21 | 13F | ORG Partners LLC | 0 | -100.00 | 0 | |||||
| 2025-08-05 | 13F | Simplex Trading, Llc | Put | 10,900 | 67.69 | 0 | ||||
| 2025-08-11 | 13F | Krane Funds Advisors LLC | 0 | -100.00 | 0 | |||||
| 2025-08-14 | 13F | Wells Fargo & Company/mn | 127,301 | 42.19 | 1,665 | 21.80 | ||||
| 2025-08-12 | 13F | DiMeo Schneider & Associates, L.L.C. | 477,189 | -35.98 | 6,242 | -45.17 | ||||
| 2025-07-31 | 13F | Anthracite Investment Company, Inc. | 88,104 | 0.00 | 1,152 | -14.35 | ||||
| 2025-07-08 | 13F | Nbc Securities, Inc. | 2,053 | 1.38 | 0 | |||||
| 2025-08-01 | 13F | Envestnet Asset Management Inc | 58,036 | 0.00 | 759 | -14.33 | ||||
| 2025-05-12 | 13F | Fmr Llc | 0 | -100.00 | 0 | |||||
| 2025-08-15 | 13F | Tower Research Capital LLC (TRC) | 7,289 | 7,822.83 | 95 | 9,400.00 | ||||
| 2025-07-29 | NP | FIKDX - Kempner Multi-Cap Deep Value Fund Institutional Class | 169,300 | 2,260 | ||||||
| 2025-07-11 | 13F | Kingstone Capital Partners Texas, LLC | 13,434,351 | 226 | ||||||
| 2025-07-15 | 13F | Financial Management Professionals, Inc. | 1,418 | 2.68 | 19 | -14.29 | ||||
| 2025-08-14 | 13F | Fayez Sarofim & Co | 515,045 | 4.95 | 6,737 | -10.10 | ||||
| 2025-07-15 | 13F | BCS Wealth Management | 17,213 | 16.42 | 0 | |||||
| 2025-07-02 | 13F | Doliver Advisors, Lp | 31,374 | -1.13 | 410 | -15.29 | ||||
| 2025-08-15 | 13F | Morgan Stanley | 3,876,819 | -5.62 | 50,709 | -19.16 | ||||
| 2025-07-15 | 13F | Clarus Group, Inc. | 333,996 | 0.00 | 4,369 | -14.35 | ||||
| 2025-08-08 | 13F/A | Sterling Capital Management LLC | 13,483 | 1.34 | 176 | -13.30 | ||||
| 2025-08-26 | NP | MDIV - Multi-Asset Diversified Income Index Fund This fund is a listed as child fund of First Trust Advisors Lp and if that institution has disclosed ownership in this security, then these positions will not be double counted when calculating total shares and total value | 315,949 | -9.95 | 4,133 | -22.87 | ||||
| 2025-08-14 | 13F | Susquehanna International Group, Llp | 36,638 | 51.52 | 479 | 29.81 | ||||
| 2025-08-14 | 13F | Susquehanna International Group, Llp | Put | 52,900 | 71.75 | 692 | 47.02 | |||
| 2025-08-14 | 13F | Susquehanna International Group, Llp | Call | 23,500 | -61.22 | 307 | -66.81 | |||
| 2025-08-12 | 13F | Jefferies Financial Group Inc. | 62,400 | 0.00 | 816 | -14.29 | ||||
| 2025-08-13 | 13F | Epacria Capital Partners, Llc | 578,422 | 0.00 | 7,566 | -14.35 | ||||
| 2025-08-13 | 13F | Rsm Us Wealth Management Llc | 13,205 | 1.07 | 173 | -13.57 | ||||
| 2025-08-14 | 13F | CoreCap Advisors, LLC | 1,021 | 2.51 | 13 | -13.33 | ||||
| 2025-08-12 | 13F | TCTC Holdings, LLC | 6,666 | 0.00 | 87 | -13.86 | ||||
| 2025-07-11 | 13F | LongView Wealth Management | 12,681 | -12.95 | 166 | -25.68 | ||||
| 2025-07-15 | 13F | Mather Group, Llc. | 0 | -100.00 | 0 | |||||
| 2025-08-15 | 13F | Kestra Advisory Services, LLC | 12,598 | 11.24 | 165 | -4.65 | ||||
| 2025-08-12 | 13F | Global Retirement Partners, LLC | 29,450 | 385 | ||||||
| 2025-08-14 | 13F | CoreCommodity Management, LLC | 49,725 | -3.22 | 650 | -17.09 | ||||
| 2025-08-15 | 13F | CI Private Wealth, LLC | 174,476 | 50.15 | 2,282 | 28.64 | ||||
| 2025-07-17 | 13F | GraniteShares Advisors LLC | 191,917 | 6.66 | 2,510 | -8.63 | ||||
| 2025-08-13 | 13F | Jones Financial Companies Lllp | 2,000 | -34.21 | 26 | -43.48 | ||||
| 2025-07-30 | 13F | Cullen/frost Bankers, Inc. | 67,359 | 0.00 | 881 | -14.30 | ||||
| 2025-08-13 | 13F | Brown Advisory Inc | 896,934 | 0.00 | 11,732 | -14.35 | ||||
| 2025-08-05 | 13F | Welch & Forbes Llc | 58,966 | 0.00 | 771 | -14.33 | ||||
| 2025-08-14 | 13F | Family Management Corp | 39,767 | 0.00 | 520 | -14.33 | ||||
| 2025-08-08 | 13F | Pnc Financial Services Group, Inc. | 500 | -73.68 | 7 | -79.31 | ||||
| 2025-07-22 | 13F | Autumn Glory Partners, LLC | 31,600 | 0.00 | 413 | -14.32 | ||||
| 2025-06-30 | NP | CVY - Invesco Zacks Multi-Asset Income ETF This fund is a listed as child fund of Invesco Ltd. and if that institution has disclosed ownership in this security, then these positions will not be double counted when calculating total shares and total value | 84,689 | 3.50 | 1,195 | 0.84 | ||||
| 2025-08-14 | 13F | Stifel Financial Corp | 137,887 | -19.80 | 1,804 | -31.31 | ||||
| 2025-05-13 | 13F | Wealthedge Investment Advisors, Llc | 0 | -100.00 | 0 | |||||
| 2025-07-23 | 13F | Mraz, Amerine & Associates, Inc. | 132,598 | 7.58 | 1,734 | -7.62 | ||||
| 2025-08-14 | 13F | Boston Private Wealth Llc | 0 | -100.00 | 0 | |||||
| 2025-05-13 | 13F | Clear Street Markets Llc | Put | 0 | -100.00 | 0 | ||||
| 2025-07-18 | 13F | Truist Financial Corp | 22,288 | 0.00 | 292 | -14.41 | ||||
| 2025-07-17 | 13F | Nicholson Meyer Capital Management, Inc. | 14,687 | 0.00 | 192 | -14.29 | ||||
| 2025-07-16 | 13F | ORG Wealth Partners, LLC | 14,238 | 0.00 | 187 | -14.22 | ||||
| 2025-05-08 | 13F | Clark Estates Inc/ny | 0 | -100.00 | 0 | |||||
| 2025-07-24 | 13F | IFP Advisors, Inc | 1,353 | 32.00 | 18 | 13.33 | ||||
| 2025-07-17 | 13F | Wolff Wiese Magana Llc | 1,000 | 0.00 | 13 | -13.33 | ||||
| 2025-08-12 | 13F | Skopos Labs, Inc. | 51 | 0.00 | 1 | |||||
| 2025-07-29 | 13F | Stratos Wealth Partners, LTD. | 10,113 | 132 | ||||||
| 2025-08-12 | 13F | Waterloo Capital, L.P. | 21,000 | 0.00 | 275 | -14.37 | ||||
| 2025-08-13 | 13F | Virtus ETF Advisers LLC | 0 | -100.00 | 0 | |||||
| 2025-08-11 | 13F | Independent Advisor Alliance | 74,998 | 2.06 | 981 | -12.66 | ||||
| 2025-08-14 | 13F | Royal Bank Of Canada | 142,886 | 19.18 | 1,869 | 2.08 | ||||
| 2025-08-14 | 13F | Concorde Financial Corp | 601,495 | -0.31 | 7,868 | -14.61 | ||||
| 2025-07-29 | 13F | Tweedy, Browne Co LLC | 20,855 | 273 | ||||||
| 2025-08-13 | 13F | Annandale Capital, LLC | 14,382 | 0.00 | 0 | |||||
| 2025-08-19 | 13F | Newbridge Financial Services Group, Inc. | 2,981 | 71.72 | 39 | 46.15 | ||||
| 2025-08-14 | 13F | Peak6 Llc | Call | 12,400 | 0.00 | 162 | -14.29 | |||
| 2025-08-04 | 13F | Investment Management Associates Inc /adv | 1,577,887 | 2.77 | 20,639 | -11.97 | ||||
| 2025-06-27 | NP | DIV - Global X SuperDividend U.S. ETF This fund is a listed as child fund of Mirae Asset Global Investments Co., Ltd. and if that institution has disclosed ownership in this security, then these positions will not be double counted when calculating total shares and total value | 899,843 | 15.20 | 12,697 | 1.91 | ||||
| 2025-07-31 | 13F | Board of Trustees of The Leland Stanford Junior University | 147,852 | 0.00 | 1,934 | -14.36 | ||||
| 2025-05-14 | 13F | Custom Index Systems, Llc | 0 | -100.00 | 0 | |||||
| 2025-08-08 | 13F | Creative Planning | 13,685 | 2.01 | 179 | -12.75 | ||||
| 2025-08-13 | 13F | Jump Financial, LLC | 94,025 | 1,230 | ||||||
| 2025-08-14 | 13F | Ancora Advisors, LLC | 41,899 | -9.19 | 548 | -22.16 | ||||
| 2025-07-21 | 13F | Empirical Financial Services, LLC d.b.a. Empirical Wealth Management | 17,000 | 0.00 | 222 | -14.29 | ||||
| 2025-08-05 | 13F | Gruss & Co., LLC | 71,016 | 0.00 | 929 | -14.39 | ||||
| 2025-08-12 | 13F | Proequities, Inc. | Put | 0 | 0 | |||||
| 2025-08-12 | 13F | Proequities, Inc. | Call | 0 | 0 | |||||
| 2025-08-12 | 13F | Proequities, Inc. | 0 | 0 | ||||||
| 2025-07-18 | 13F | Bartlett & Co. Wealth Management Llc | 32,746 | 0.00 | 428 | -14.40 | ||||
| 2025-07-29 | 13F | Private Trust Co Na | 500 | 0.00 | 7 | -14.29 | ||||
| 2025-07-24 | 13F | Jfs Wealth Advisors, Llc | 32,747 | 0.00 | 428 | -14.40 | ||||
| 2025-08-12 | 13F | Steward Partners Investment Advisory, Llc | 20,290 | -25.79 | 265 | -36.45 | ||||
| 2025-08-08 | 13F | Grandfield & Dodd, Llc | 30,382 | 397 | ||||||
| 2025-08-14 | 13F | Group One Trading, L.p. | Call | 39,700 | -8.31 | 519 | -21.48 | |||
| 2025-08-19 | 13F | Advisory Services Network, LLC | 48,375 | 207.63 | 606 | 152.50 | ||||
| 2025-08-14 | 13F | Wealth Preservation Advisors, LLC | 0 | -100.00 | 0 | |||||
| 2025-08-14 | 13F | Guardian Wealth Management, Inc. | 12,082 | 0.60 | 158 | -13.66 | ||||
| 2025-08-14 | 13F | Group One Trading, L.p. | Put | 1,700 | -69.64 | 22 | -74.12 | |||
| 2025-07-07 | 13F | Thurston, Springer, Miller, Herd & Titak, Inc. | 300 | 0.00 | 4 | -25.00 | ||||
| 2025-05-14 | 13F | Group One Trading, L.p. | 0 | -100.00 | 0 | -100.00 | ||||
| 2025-07-22 | 13F | Belpointe Asset Management LLC | 14,975 | 8.02 | 196 | -7.58 | ||||
| 2025-07-22 | 13F | Gsa Capital Partners Llp | 36,463 | 0 | ||||||
| 2025-08-14 | 13F | Jane Street Group, Llc | 0 | -100.00 | 0 | |||||
| 2025-05-29 | NP | PMEFX - PENN MUTUAL AM 1847 INCOME FUND I Shares | 0 | -100.00 | 0 | -100.00 | ||||
| 2025-08-06 | 13F | Golden State Wealth Management, LLC | 515 | 0.00 | 7 | -14.29 | ||||
| 2025-08-12 | 13F | LPL Financial LLC | 175,728 | 19.13 | 2,299 | 2.04 | ||||
| 2025-08-04 | 13F | Bristlecone Advisors, LLC | 0 | -100.00 | 0 | |||||
| 2025-08-27 | NP | TPDAX - Timothy Plan Defensive Strategies Fund Class A | 1,128 | 0.00 | 15 | -17.65 | ||||
| 2025-06-27 | NP | FERRX - First Eagle Global Real Assets Fund Class R6 | 14,564 | 154.84 | 205 | 150.00 | ||||
| 2025-07-30 | 13F | Bogart Wealth, LLC | 1,623 | 0.00 | 21 | -12.50 | ||||
| 2025-08-26 | NP | GAFCX - Virtus AlphaSimplex Global Alternatives Fund Class C | 7,667 | 92.30 | 100 | 66.67 | ||||
| 2025-08-14 | 13F | Citadel Advisors Llc | Call | 32,100 | 52.86 | 420 | 30.94 | |||
| 2025-07-29 | 13F | Spirit Of America Management Corp/ny | 142,999 | -34.70 | 1,870 | -44.08 | ||||
| 2025-08-14 | 13F | Citadel Advisors Llc | 114,864 | -16.25 | 1,502 | -28.27 | ||||
| 2025-07-29 | NP | COPY - Tweedy, Browne Insider + Value ETF | 12,936 | 146.54 | 173 | 120.51 | ||||
| 2025-08-14 | 13F | Citadel Advisors Llc | Put | 86,000 | 1.18 | 1,125 | -13.34 | |||
| 2025-08-08 | 13F | Cetera Investment Advisers | 71,222 | -2.17 | 932 | -16.20 | ||||
| 2025-08-14 | 13F | Toroso Investments, LLC | 12,537 | -88.30 | 164 | -90.03 | ||||
| 2025-05-06 | 13F | Venturi Wealth Management, LLC | 0 | -100.00 | 0 | |||||
| 2025-07-02 | 13F | Howard Financial Services, Ltd. | 91,882 | 0.24 | 1,202 | -14.15 | ||||
| 2025-08-14 | 13F/A | Barclays Plc | 1,632 | -25.24 | 0 | |||||
| 2025-05-13 | 13F | Penn Mutual Asset Management, LLC | 0 | -100.00 | 0 | |||||
| 2025-08-14 | 13F | Raymond James Financial Inc | 263,307 | 6.57 | 3,444 | -8.70 | ||||
| 2025-08-29 | NP | GraniteShares ETF Trust - GraniteShares HIPS US High Income ETF | 191,917 | 6.66 | 2,510 | -8.63 | ||||
| 2025-08-14 | 13F | Fwl Investment Management, Llc | 285 | 0.00 | 4 | -25.00 | ||||
| 2025-07-08 | 13F | Arlington Trust Co LLC | 6,250 | 0.00 | 82 | -14.74 | ||||
| 2025-08-12 | 13F | Bokf, Na | 0 | -100.00 | 0 | |||||
| 2025-08-12 | 13F | Hill Investment Group Partners, LLC | 177,487 | 0.00 | 2,322 | -14.35 | ||||
| 2025-07-11 | 13F | Diversified Trust Co | 16,787 | 0.00 | 220 | -14.45 | ||||
| 2025-08-14 | 13F | MIRAE ASSET GLOBAL ETFS HOLDINGS Ltd. | 963,313 | 5.45 | 12,600 | -9.67 | ||||
| 2025-08-11 | 13F | Citigroup Inc | 255,007 | 53.63 | 3,335 | 31.61 | ||||
| 2025-08-13 | 13F | Fort Sheridan Advisors Llc | 36,540 | -34.36 | 478 | -43.88 | ||||
| 2025-08-13 | 13F | First Trust Advisors Lp | 333,834 | -11.33 | 4,367 | -24.06 | ||||
| 2025-07-30 | 13F/A | Alpha Wealth Funds, LLC | 11,200 | -20.00 | 146 | -31.46 | ||||
| 2025-06-26 | NP | HMSFX - Hennessy BP Midstream Fund Investor Class | 25,000 | 353 | ||||||
| 2025-05-12 | 13F | Linscomb & Williams, Inc. | 0 | -100.00 | 0 | -100.00 | ||||
| 2025-07-28 | 13F | Cypress Wealth Services, LLC | 21,437 | 0.00 | 280 | -14.37 | ||||
| 2025-07-30 | NP | ALTY - Global X SuperDividend Alternatives ETF This fund is a listed as child fund of Mirae Asset Global Investments Co., Ltd. and if that institution has disclosed ownership in this security, then these positions will not be double counted when calculating total shares and total value | 29,184 | 3.55 | 390 | -7.60 |