Mga Batayang Estadistika
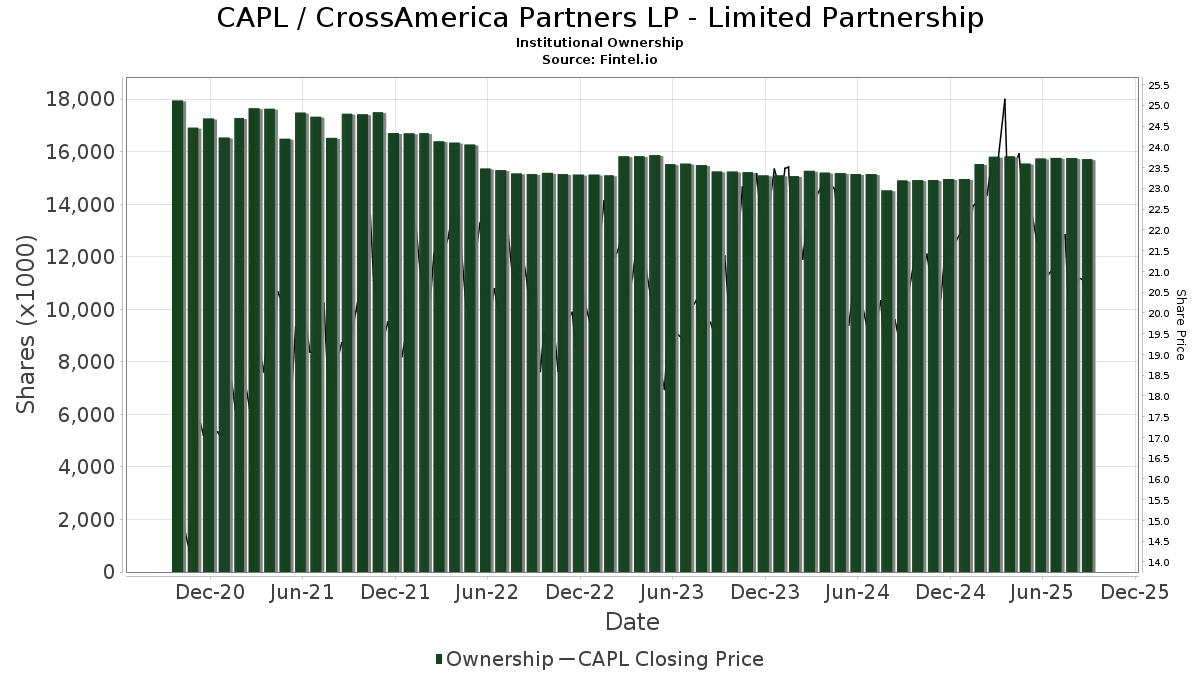
| Saham Institusional (Jangka Panjang) | 15,718,436 - 41.24% (ex 13D/G) - change of -0.02MM shares -0.15% MRQ |
| Nilai Institusional (Jangka Panjang) | $ 330,890 USD ($1000) |
Kepemilikan Institusional dan Pemegang Saham
CrossAmerica Partners LP - Limited Partnership (US:CAPL) memiliki 78 pemilik institusional dan pemegang saham yang telah mengajukan formulir 13D/G atau 13F kepada Komisi Bursa Efek (Securities Exchange Commission/SEC). Lembaga-lembaga ini memegang total 15,718,436 saham. Pemegang saham terbesar meliputi Invesco Ltd., MLPRX - Invesco Oppenheimer SteelPath MLP Income Fund Class C, MLPEX - Invesco Oppenheimer SteelPath MLP Select 40 Fund Class C, MIRAE ASSET GLOBAL ETFS HOLDINGS Ltd., DIV - Global X SuperDividend U.S. ETF, Clearbridge Investments, LLC, Jpmorgan Chase & Co, Raymond James Financial Inc, Quadrant Private Wealth Management, LLC, and First Trust Advisors Lp .
Struktur kepemilikan institusional CrossAmerica Partners LP - Limited Partnership (NYSE:CAPL) menunjukkan posisi terkini di perusahaan oleh institusi dan dana, serta perubahan terbaru dalam ukuran posisi. Pemegang saham utama dapat mencakup investor individu, reksa dana, dana lindung nilai, atau institusi. Jadwal 13D menunjukkan bahwa investor memegang (atau pernah memegang) lebih dari 5% saham perusahaan dan bermaksud (atau pernah bermaksud) untuk secara aktif mengejar perubahan strategi bisnis. Jadwal 13G menunjukkan investasi pasif lebih dari 5%.
The share price as of September 5, 2025 is 20.56 / share. Previously, on September 9, 2024, the share price was 20.41 / share. This represents an increase of 0.73% over that period.
Skor Sentimen Dana
Skor Sentimen Dana (sebelumnya dikenal sebagai Skor Akumulasi Kepemilikan) menemukan saham-saham yang paling banyak dibeli oleh dana. Ini adalah hasil dari model kuantitatif multi-faktor yang canggih yang mengidentifikasi perusahaan dengan tingkat akumulasi institusional tertinggi. Model penilaian menggunakan kombinasi dari total peningkatan pemilik yang diungkapkan, perubahan dalam alokasi portofolio pada pemilik tersebut, dan metrik lainnya. Angka berkisar dari 0 hingga 100, dengan angka yang lebih tinggi menunjukkan tingkat akumulasi yang lebih tinggi dibandingkan dengan perusahaan sejenisnya, dan 50 adalah rata-ratanya.
Frekuensi Pembaruan: Setiap Hari
Lihat Ownership Explorer, yang menyediakan daftar perusahaan dengan peringkat tertinggi.
Rasio Put/Call Institusional
Selain melaporkan isu ekuitas dan utang standar, institusi dengan aset di bawah manajemen lebih dari 100 juta dolar AS juga harus mengungkapkan kepemilikan opsi put dan call mereka. Karena opsi put umumnya menunjukkan sentimen negatif, dan opsi call menunjukkan sentimen positif, kita dapat mengetahui sentimen institusional secara keseluruhan dengan memplot rasio put terhadap call. Grafik di sebelah kanan memplot rasio put/call historis untuk instrumen ini.
Menggunakan Rasio Put/Call sebagai indikator sentimen investor mengatasi salah satu kekurangan utama dari penggunaan total kepemilikan institusional, yaitu sejumlah besar aset yang dikelola diinvestasikan secara pasif untuk melacak indeks. Dana yang dikelola secara pasif biasanya tidak membeli opsi, sehingga indikator rasio put/call lebih akurat dalam melacak sentimen dana yang dikelola secara aktif.

Pengajuan 13F dan NPORT
Detail pada pengajuan 13F tersedia gratis. Detail pada pengajuan NP memerlukan keanggotaan premium. Baris berwarna hijau menunjukkan posisi baru. Baris berwarna merah menunjukkan posisi yang sudah ditutup. Klik tautan ini ikon untuk melihat riwayat transaksi selengkapnya.
Tingkatkan
untuk membuka data premium dan mengekspor ke Excel ![]() .
.
| Tanggal File | Sumber | Investor | Ketik | Presyo ng Avg (Silangan) |
Saham | Δ Saham (%) |
Dilaporkan Nilai ($1000) |
Nilai Δ (%) |
Alokasi Port (%) |
|
|---|---|---|---|---|---|---|---|---|---|---|
| 2025-04-14 | NP | TPYP - Tortoise North American Pipeline Fund | 21,793 | 2.67 | 506 | 15.53 | ||||
| 2025-08-14 | 13F | Raymond James Financial Inc | 284,481 | -1.54 | 5,951 | -16.17 | ||||
| 2025-08-14 | 13F | Group One Trading, L.p. | Call | 1,300 | -96.67 | 27 | -97.18 | |||
| 2025-08-13 | 13F | Philadelphia Trust Co | 21,000 | 0.00 | 0 | |||||
| 2025-08-14 | 13F | Bnp Paribas Arbitrage, Sa | 23,774 | -0.39 | 497 | -15.19 | ||||
| 2025-07-11 | 13F/A | Umb Bank N A/mo | 800 | 0.00 | 17 | -15.79 | ||||
| 2025-07-14 | 13F | U.S. Capital Wealth Advisors, LLC | 80,000 | 0.00 | 1,674 | -14.86 | ||||
| 2025-07-21 | 13F | Credential Qtrade Securities Inc. | 0 | -100.00 | 0 | -100.00 | ||||
| 2025-07-29 | 13F | Mb, Levis & Associates, Llc | 1,081 | 2.27 | 23 | -12.00 | ||||
| 2025-05-14 | 13F/A | Group One Trading, L.p. | Put | 0 | -100.00 | 0 | -100.00 | |||
| 2025-07-18 | 13F | Founders Capital Management | 46 | 2.22 | 1 | -100.00 | ||||
| 2025-08-20 | NP | LSPAX - LoCorr Spectrum Income Fund Class A | 45,273 | 0.00 | 947 | -14.84 | ||||
| 2025-08-12 | 13F | BlackRock, Inc. | 0 | -100.00 | 0 | |||||
| 2025-08-13 | 13F | Invesco Ltd. | 5,720,129 | 0.00 | 119,665 | -14.86 | ||||
| 2025-08-11 | 13F | Hexagon Capital Partners LLC | 0 | -100.00 | 0 | |||||
| 2025-09-04 | 13F/A | Advisor Group Holdings, Inc. | 14,301 | 36.34 | 299 | 16.34 | ||||
| 2025-08-26 | 13F/A | Thrivent Financial For Lutherans | 26,324 | -9.97 | 1 | |||||
| 2025-05-13 | 13F | Lee Financial Co | 0 | -100.00 | 0 | |||||
| 2025-08-12 | 13F | Proequities, Inc. | Put | 0 | 0 | |||||
| 2025-08-12 | 13F | Proequities, Inc. | Call | 0 | 0 | |||||
| 2025-08-12 | 13F | Proequities, Inc. | 0 | 0 | ||||||
| 2025-08-15 | 13F | Morgan Stanley | 77,205 | -21.26 | 1,615 | -32.96 | ||||
| 2025-07-17 | 13F | Janney Montgomery Scott LLC | 27,761 | -1.39 | 1 | |||||
| 2025-08-14 | 13F | Boston Private Wealth Llc | 0 | -100.00 | 0 | |||||
| 2025-08-14 | 13F | Citadel Advisors Llc | Call | 0 | -100.00 | 0 | ||||
| 2025-08-14 | 13F | MIRAE ASSET GLOBAL ETFS HOLDINGS Ltd. | 610,616 | 4.76 | 12,774 | -10.80 | ||||
| 2025-08-18 | 13F | Geneos Wealth Management Inc. | 1,200 | 0.00 | 25 | -13.79 | ||||
| 2025-08-13 | 13F | Jones Financial Companies Lllp | 415 | 9 | ||||||
| 2025-07-29 | 13F | Private Trust Co Na | 200 | 0.00 | 4 | 0.00 | ||||
| 2025-08-15 | 13F | Tower Research Capital LLC (TRC) | 85 | 2 | ||||||
| 2025-08-13 | 13F | Safe Harbor Fiduciary, LLC | 0 | -100.00 | 0 | |||||
| 2025-08-15 | 13F | CI Private Wealth, LLC | 25,441 | 0.00 | 532 | -14.88 | ||||
| 2025-07-29 | NP | MLPRX - Invesco Oppenheimer SteelPath MLP Income Fund Class C | 3,748,183 | 0.00 | 80,923 | -7.02 | ||||
| 2025-06-27 | NP | DIV - Global X SuperDividend U.S. ETF This fund is a listed as child fund of Mirae Asset Global Investments Co., Ltd. and if that institution has disclosed ownership in this security, then these positions will not be double counted when calculating total shares and total value | 592,157 | 4.17 | 14,111 | 6.63 | ||||
| 2025-04-25 | 13F | Smallwood Wealth Investment Management, LLC | 100 | 2 | ||||||
| 2025-08-14 | 13F | Wells Fargo & Company/mn | 3,400 | -77.95 | 71 | -81.22 | ||||
| 2025-07-30 | NP | MLPA - Global X MLP ETF This fund is a listed as child fund of Mirae Asset Global Investments Co., Ltd. and if that institution has disclosed ownership in this security, then these positions will not be double counted when calculating total shares and total value | 100 | 0.00 | 2 | 0.00 | ||||
| 2025-05-16 | 13F | Coppell Advisory Solutions LLC | 0 | -100.00 | 0 | |||||
| 2025-08-11 | 13F | Outlook Wealth Advisors, LLC | 11,700 | 0.00 | 245 | -14.98 | ||||
| 2025-08-14 | 13F | Citadel Advisors Llc | 39,690 | 53.90 | 830 | 31.12 | ||||
| 2025-08-14 | 13F | Citadel Advisors Llc | Put | 26,700 | -9.18 | 559 | -22.71 | |||
| 2025-08-14 | 13F | Mariner, LLC | 100,392 | -3.32 | 2,100 | -17.68 | ||||
| 2025-07-24 | 13F | IFP Advisors, Inc | 249 | 0.00 | 5 | -16.67 | ||||
| 2025-07-29 | NP | MLPEX - Invesco Oppenheimer SteelPath MLP Select 40 Fund Class C | 1,971,946 | 0.00 | 42,574 | -7.02 | ||||
| 2025-07-25 | 13F | Cwm, Llc | 2,500 | 0.00 | 0 | |||||
| 2025-08-07 | 13F | Allworth Financial LP | 2,000 | 0.00 | 42 | -12.77 | ||||
| 2025-07-22 | 13F | Gsa Capital Partners Llp | 34,736 | -8.12 | 1 | |||||
| 2025-08-14 | 13F | Goldman Sachs Group Inc | 38,225 | -2.09 | 800 | -16.68 | ||||
| 2025-07-25 | 13F | Community Bank, N.A. | 500 | 0.00 | 10 | -16.67 | ||||
| 2025-07-25 | 13F | We Are One Seven, LLC | 9,907 | -2.61 | 207 | -16.87 | ||||
| 2025-08-13 | 13F | First Trust Advisors Lp | 161,948 | -17.73 | 3,388 | -29.96 | ||||
| 2025-08-14 | 13F/A | Barclays Plc | 58 | 0 | ||||||
| 2025-08-14 | 13F | Stifel Financial Corp | 49,370 | 14.10 | 1,033 | -2.92 | ||||
| 2025-08-07 | 13F | American Financial Group Inc | 14,500 | 3.57 | 303 | -11.66 | ||||
| 2025-08-14 | 13F | Blackstone Group Inc | 123,610 | 10.59 | 2,586 | -5.86 | ||||
| 2025-07-23 | NP | Lmp Capital & Income Fund Inc. | 101,729 | 0.00 | 2,196 | -7.03 | ||||
| 2025-04-29 | 13F | Lee Danner & Bass Inc | 0 | -100.00 | 0 | -100.00 | ||||
| 2025-08-07 | 13F | Kestra Private Wealth Services, Llc | 17,025 | 7.68 | 356 | -8.25 | ||||
| 2025-07-31 | 13F | Cambridge Investment Research Advisors, Inc. | 38,791 | 26.78 | 1 | |||||
| 2025-08-14 | 13F | GWM Advisors LLC | 1,500 | 0.00 | 31 | -13.89 | ||||
| 2025-03-26 | NP | GYLD - Arrow Dow Jones Global Yield ETF | 6,181 | -13.87 | 144 | -6.54 | ||||
| 2025-07-14 | 13F | Armstrong Advisory Group, Inc | 786 | 4.66 | 16 | 0.00 | ||||
| 2025-08-12 | 13F | Franklin Resources Inc | 11,000 | -13.39 | 230 | -26.28 | ||||
| 2025-08-14 | 13F | Susquehanna International Group, Llp | Call | 47,300 | 24.47 | 990 | 6.00 | |||
| 2025-08-14 | 13F | Bank Of America Corp /de/ | 5,711 | 4.58 | 119 | -11.19 | ||||
| 2025-06-25 | NP | CFLGX - ClearBridge Tactical Dividend Income Fund Class A This fund is a listed as child fund of Clearbridge, Llc and if that institution has disclosed ownership in this security, then these positions will not be double counted when calculating total shares and total value | 102,990 | 0.00 | 2,454 | 2.38 | ||||
| 2025-07-23 | 13F | Ellsworth Advisors, LLC | 26,778 | 1.48 | 560 | -13.58 | ||||
| 2025-08-14 | 13F | Bramshill Investments, LLC | 49,393 | 2.30 | 1,033 | -12.90 | ||||
| 2025-08-13 | 13F | EverSource Wealth Advisors, LLC | 3,648 | 0.00 | 76 | -14.61 | ||||
| 2025-08-12 | 13F | LPL Financial LLC | 111,091 | 5.98 | 2,324 | -9.75 | ||||
| 2025-08-19 | 13F | MRP Capital Investments, LLC | 44 | 0.00 | 1 | -100.00 | ||||
| 2025-07-29 | NP | Tortoise Capital Series Trust - TORTOISE NORTH AMERICAN PIPELINE FUND | 19,520 | 421 | ||||||
| 2025-08-11 | 13F | NewEdge Wealth, LLC | 73,951 | 9.93 | 1,492 | -9.75 | ||||
| 2025-08-04 | 13F | IFG Advisory, LLC | 19,230 | 0.00 | 402 | -14.83 | ||||
| 2025-08-08 | 13F | Pnc Financial Services Group, Inc. | 1,800 | 0.00 | 38 | -15.91 | ||||
| 2025-08-14 | 13F | Royal Bank Of Canada | 4,772 | -18.39 | 100 | -30.07 | ||||
| 2025-07-25 | 13F | Apollon Wealth Management, LLC | 15,413 | 0.00 | 322 | -14.81 | ||||
| 2025-08-06 | 13F | Ing Groep Nv | 13,000 | 0.00 | 272 | -15.05 | ||||
| 2025-07-21 | 13F | Hilltop National Bank | 1,000 | 0.00 | 21 | -9.09 | ||||
| 2025-07-17 | 13F | Sonora Investment Management Group, LLC | 0 | -100.00 | 0 | |||||
| 2025-08-14 | 13F | UBS Group AG | 32,655 | -12.22 | 683 | -25.27 | ||||
| 2025-07-24 | 13F | Morton Brown Family Wealth, LLC | 20,096 | 0.00 | 420 | -14.81 | ||||
| 2025-08-05 | 13F | Simplex Trading, Llc | Put | 300 | -25.00 | 0 | ||||
| 2025-05-14 | 13F/A | Group One Trading, L.p. | 0 | -100.00 | 0 | -100.00 | ||||
| 2025-08-07 | 13F | Acadian Asset Management Llc | 32,756 | 49.52 | 1 | |||||
| 2025-08-06 | 13F | Quadrant Private Wealth Management, LLC | 165,991 | 0.44 | 3,473 | -14.48 | ||||
| 2025-08-12 | 13F | Clearbridge Investments, LLC | 471,012 | 0.00 | 9,854 | -14.85 | ||||
| 2025-08-13 | 13F | Brown Advisory Inc | 12,076 | 0.22 | 253 | -14.86 | ||||
| 2025-08-11 | 13F | Private Advisor Group, LLC | 0 | -100.00 | 0 | |||||
| 2025-08-12 | 13F | Jpmorgan Chase & Co | 425,510 | -4.34 | 8,902 | -18.55 | ||||
| 2025-08-26 | NP | MDIV - Multi-Asset Diversified Income Index Fund This fund is a listed as child fund of First Trust Advisors Lp and if that institution has disclosed ownership in this security, then these positions will not be double counted when calculating total shares and total value | 161,948 | -17.73 | 3,388 | -29.96 | ||||
| 2025-07-22 | 13F | Valley National Advisers Inc | 500 | 0.00 | 0 | |||||
| 2025-08-08 | 13F | Larson Financial Group LLC | 296 | 6 | ||||||
| 2025-07-10 | 13F | Exchange Traded Concepts, Llc | 19,495 | -2.99 | 408 | -17.44 | ||||
| 2025-08-05 | 13F | Simplex Trading, Llc | Call | 4,500 | -16.67 | 0 | ||||
| 2025-08-12 | 13F | CIBC Private Wealth Group, LLC | 25,500 | 0.00 | 533 | -3.96 |