Mga Batayang Estadistika
| Pemilik Institusional | 180 total, 180 long only, 0 short only, 0 long/short - change of 7.69% MRQ |
| Alokasi Portofolio Rata-rata | 0.5323 % - change of 59.75% MRQ |
| Saham Institusional (Jangka Panjang) | 61,564,082 (ex 13D/G) - change of -2.90MM shares -4.50% MRQ |
| Nilai Institusional (Jangka Panjang) | $ 1,981,048 USD ($1000) |
Kepemilikan Institusional dan Pemegang Saham
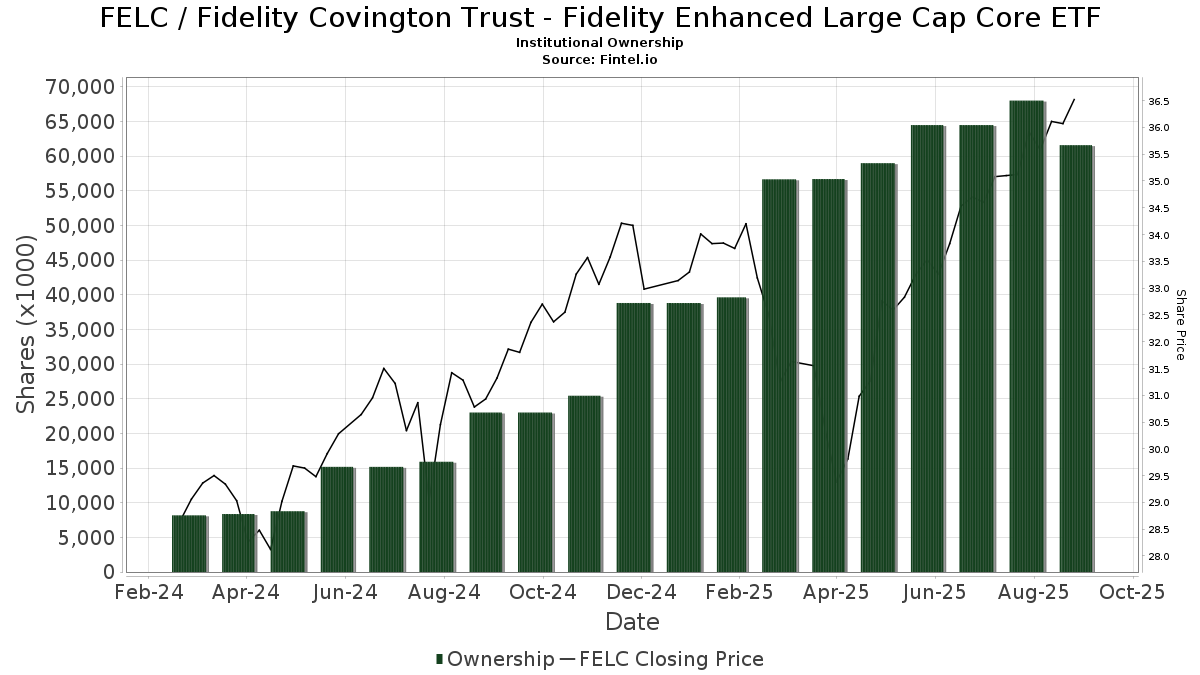
Fidelity Covington Trust - Fidelity Enhanced Large Cap Core ETF (US:FELC) memiliki 180 pemilik institusional dan pemegang saham yang telah mengajukan formulir 13D/G atau 13F kepada Komisi Bursa Efek (Securities Exchange Commission/SEC). Lembaga-lembaga ini memegang total 61,564,082 saham. Pemegang saham terbesar meliputi Fmr Llc, Commonwealth Equity Services, Llc, Fragasso Group Inc., Kfg Wealth Management, Llc, LPL Financial LLC, EdgeRock Capital LLC, HighTower Advisors, LLC, Advisor Group Holdings, Inc., Jane Street Group, Llc, and Variable Insurance Products Fund V - FundsManager 60% Portfolio Investor Class .
Struktur kepemilikan institusional Fidelity Covington Trust - Fidelity Enhanced Large Cap Core ETF (ARCA:FELC) menunjukkan posisi terkini di perusahaan oleh institusi dan dana, serta perubahan terbaru dalam ukuran posisi. Pemegang saham utama dapat mencakup investor individu, reksa dana, dana lindung nilai, atau institusi. Jadwal 13D menunjukkan bahwa investor memegang (atau pernah memegang) lebih dari 5% saham perusahaan dan bermaksud (atau pernah bermaksud) untuk secara aktif mengejar perubahan strategi bisnis. Jadwal 13G menunjukkan investasi pasif lebih dari 5%.
The share price as of September 5, 2025 is 36.24 / share. Previously, on September 6, 2024, the share price was 30.16 / share. This represents an increase of 20.16% over that period.
Skor Sentimen Dana
Skor Sentimen Dana (sebelumnya dikenal sebagai Skor Akumulasi Kepemilikan) menemukan saham-saham yang paling banyak dibeli oleh dana. Ini adalah hasil dari model kuantitatif multi-faktor yang canggih yang mengidentifikasi perusahaan dengan tingkat akumulasi institusional tertinggi. Model penilaian menggunakan kombinasi dari total peningkatan pemilik yang diungkapkan, perubahan dalam alokasi portofolio pada pemilik tersebut, dan metrik lainnya. Angka berkisar dari 0 hingga 100, dengan angka yang lebih tinggi menunjukkan tingkat akumulasi yang lebih tinggi dibandingkan dengan perusahaan sejenisnya, dan 50 adalah rata-ratanya.
Frekuensi Pembaruan: Setiap Hari
Lihat Ownership Explorer, yang menyediakan daftar perusahaan dengan peringkat tertinggi.
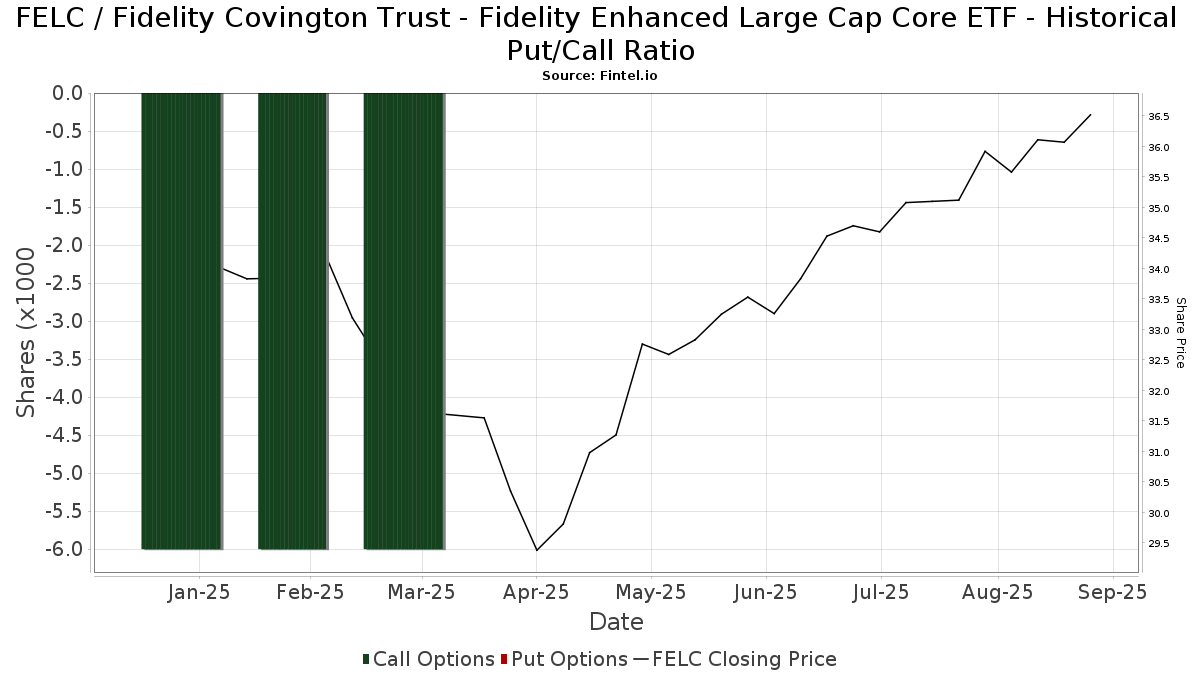
Rasio Put/Call Institusional
Selain melaporkan isu ekuitas dan utang standar, institusi dengan aset di bawah manajemen lebih dari 100 juta dolar AS juga harus mengungkapkan kepemilikan opsi put dan call mereka. Karena opsi put umumnya menunjukkan sentimen negatif, dan opsi call menunjukkan sentimen positif, kita dapat mengetahui sentimen institusional secara keseluruhan dengan memplot rasio put terhadap call. Grafik di sebelah kanan memplot rasio put/call historis untuk instrumen ini.
Menggunakan Rasio Put/Call sebagai indikator sentimen investor mengatasi salah satu kekurangan utama dari penggunaan total kepemilikan institusional, yaitu sejumlah besar aset yang dikelola diinvestasikan secara pasif untuk melacak indeks. Dana yang dikelola secara pasif biasanya tidak membeli opsi, sehingga indikator rasio put/call lebih akurat dalam melacak sentimen dana yang dikelola secara aktif.
Pengajuan 13D/G
Kami menyajikan pengajuan 13D/G secara terpisah dari pengajuan 13F karena perlakuan yang berbeda oleh SEC. Pengajuan 13D/G dapat diajukan oleh kelompok investor (dengan satu pemimpin), sedangkan pengajuan 13F tidak bisa. Hal ini mengakibatkan situasi di mana seorang investor dapat mengajukan 13D/G yang melaporkan satu nilai untuk total saham (mewakili semua saham yang dimiliki oleh kelompok investor), tetapi kemudian mengajukan 13F yang melaporkan nilai yang berbeda untuk total saham (mewakili kepemilikan mereka sendiri). Ini berarti bahwa kepemilikan saham dari pengajuan 13D/G dan pengajuan 13F seringkali tidak dapat dibandingkan secara langsung, sehingga kami menyajikannya secara terpisah.
Catatan: Mulai 16 Mei 2021, kami tidak lagi menampilkan pemilik yang belum mengajukan 13D/G dalam setahun terakhir. Sebelumnya, kami menampilkan riwayat lengkap pengajuan 13D/G. Secara umum, entitas yang diwajibkan untuk mengajukan pengajuan 13D/G harus mengajukan setidaknya setiap tahun sebelum mengirimkan pengajuan penutupan. Namun, terkadang dana keluar dari posisi tanpa mengirimkan pengajuan penutupan (misalnya, mereka menghentikan operasi), sehingga menampilkan riwayat lengkap terkadang menyebabkan kebingungan tentang kepemilikan saat ini. Untuk mencegah kebingungan, kami sekarang hanya menampilkan pemilik 'saat ini' - yaitu - pemilik yang telah mengajukan dalam setahun terakhir.
Upgrade to unlock premium data.
Pengajuan 13F dan NPORT
Detail pada pengajuan 13F tersedia gratis. Detail pada pengajuan NP memerlukan keanggotaan premium. Baris berwarna hijau menunjukkan posisi baru. Baris berwarna merah menunjukkan posisi yang sudah ditutup. Klik tautan ini ikon untuk melihat riwayat transaksi selengkapnya.
Tingkatkan
untuk membuka data premium dan mengekspor ke Excel ![]() .
.
| Tanggal File | Sumber | Investor | Ketik | Presyo ng Avg (Silangan) |
Saham | Δ Saham (%) |
Dilaporkan Nilai ($1000) |
Nilai Δ (%) |
Alokasi Port (%) |
|
|---|---|---|---|---|---|---|---|---|---|---|
| 2025-07-16 | 13F | EdgeRock Capital LLC | 1,887,103 | 65,146 | ||||||
| 2025-08-08 | 13F | Foundations Investment Advisors, LLC | 14,014 | 91.66 | 483 | 111.84 | ||||
| 2025-08-14 | 13F | GWM Advisors LLC | 1,591 | 8.16 | 55 | 20.00 | ||||
| 2025-08-22 | NP | Variable Insurance Products Fund V - FundsManager 50% Portfolio Investor Class | 242,531 | -85.46 | 8,365 | -83.92 | ||||
| 2025-08-12 | 13F | Steward Partners Investment Advisory, Llc | 8,184 | 192.91 | 282 | 224.14 | ||||
| 2025-08-12 | 13F | Jpmorgan Chase & Co | 598,189 | -16.28 | 20,632 | -7.43 | ||||
| 2025-08-14 | 13F | Geneva Partners, LLC | 18,195 | -2.50 | 628 | 7.73 | ||||
| 2025-08-08 | 13F | Apex Wealth Management, LLC | 0 | -100.00 | 0 | |||||
| 2025-08-07 | 13F | Nwam Llc | 6,499 | -10.38 | 228 | 0.88 | ||||
| 2025-07-25 | 13F | Investment Advisory Group, LLC | 6,628 | 0.00 | 229 | 10.68 | ||||
| 2025-08-08 | 13F | Hudock, Inc. | 11,860 | 0.00 | 409 | 10.84 | ||||
| 2025-08-12 | 13F | Global Retirement Partners, LLC | 2,954 | 277.27 | 102 | 304.00 | ||||
| 2025-08-13 | 13F | Fiduciary Group LLC | 6,329 | 218 | ||||||
| 2025-08-13 | 13F | Rsm Us Wealth Management Llc | 10,014 | 0.23 | 345 | 10.93 | ||||
| 2025-08-04 | 13F | Barnes Dennig Private Wealth Management LLC | 33 | 1 | ||||||
| 2025-08-05 | 13F | AAFCPAs Wealth Management, LLC | 53,770 | -0.27 | 1,855 | 10.29 | ||||
| 2025-07-30 | 13F/A | KPP Advisory Services LLC | 151,857 | 29.50 | 5,238 | 43.20 | ||||
| 2025-08-12 | 13F | Northstar Financial Companies, Inc. | 10,430 | -2.27 | 360 | 8.13 | ||||
| 2025-07-14 | 13F | Sowell Financial Services LLC | 7,981 | 275 | ||||||
| 2025-07-17 | 13F | Beacon Capital Management, LLC | 587 | 20 | ||||||
| 2025-08-11 | 13F | Teachers Insurance & Annuity Association Of America | 0 | -100.00 | 0 | |||||
| 2025-08-14 | 13F | Fmr Llc | 33,392,195 | -6.72 | 1,151,697 | 3.15 | ||||
| 2025-08-14 | 13F | Stifel Financial Corp | 84,387 | -22.60 | 2,911 | -14.41 | ||||
| 2025-08-14 | 13F | Snowden Capital Advisors LLC | 9,355 | 0.00 | 323 | 10.65 | ||||
| 2025-08-01 | 13F | Advisory Alpha, LLC | 0 | -100.00 | 0 | |||||
| 2025-07-21 | 13F | Ameritas Advisory Services, LLC | 1,129 | 39 | ||||||
| 2025-08-15 | 13F | Captrust Financial Advisors | 9,823 | -6.34 | 339 | 3.36 | ||||
| 2025-08-14 | 13F | Susquehanna International Group, Llp | 44,740 | -37.99 | 1,543 | -31.42 | ||||
| 2025-08-01 | 13F | Envestnet Asset Management Inc | 437,534 | 5.19 | 15,091 | 16.32 | ||||
| 2025-08-14 | 13F | UBS Group AG | 1,235 | -80.30 | 43 | -78.46 | ||||
| 2025-08-11 | 13F | Regal Investment Advisors LLC | 11,644 | 2.86 | 402 | 13.60 | ||||
| 2025-08-14 | 13F | Clarity Asset Management, Inc. | 0 | -100.00 | 0 | |||||
| 2025-07-29 | 13F | Madison Wealth Partners, Inc | 11,715 | 1.86 | 404 | 12.85 | ||||
| 2025-08-07 | 13F | Allworth Financial LP | 4,076 | -27.47 | 141 | -18.13 | ||||
| 2025-07-30 | 13F | Financial Perspectives, Inc | 10,832 | 20.24 | 374 | 33.21 | ||||
| 2025-08-08 | 13F | Creative Planning | 17,690 | 2.66 | 610 | 13.59 | ||||
| 2025-08-14 | 13F | Betterment LLC | 46,458 | 342.67 | 2 | |||||
| 2025-08-22 | NP | Variable Insurance Products Fund V - FundsManager 85% Portfolio Investor Class | 306,607 | -26.25 | 10,575 | -18.45 | ||||
| 2025-08-06 | 13F | Savant Capital, LLC | 0 | -100.00 | 0 | |||||
| 2025-05-15 | 13F/A | Orion Portfolio Solutions, LLC | 11,150 | 348 | ||||||
| 2025-07-14 | 13F | ABLE Financial Group, LLC | 0 | -100.00 | 0 | |||||
| 2025-08-15 | 13F | Kestra Advisory Services, LLC | 549,587 | 111.98 | 18,955 | 134.42 | ||||
| 2025-07-18 | 13F | Rolek Wealth Management LLC | 6,053 | 209 | ||||||
| 2025-09-04 | 13F/A | Advisor Group Holdings, Inc. | 1,386,341 | -10.21 | 47,820 | -0.71 | ||||
| 2025-07-18 | 13F | Dogwood Wealth Management LLC | 31 | 1 | ||||||
| 2025-08-08 | 13F | Pnc Financial Services Group, Inc. | 2,974 | -0.97 | 103 | 9.68 | ||||
| 2025-08-14 | 13F | McIlrath & Eck, LLC | 1,577 | 0.25 | 54 | 10.20 | ||||
| 2025-05-27 | NP | Variable Insurance Products Fund V - FundsManager 20% Portfolio Investor Class | 283,455 | 83.38 | 8,841 | 73.67 | ||||
| 2025-07-15 | 13F | EWG Elevate Inc. | Call | 0 | -100.00 | 0 | ||||
| 2025-08-12 | 13F | Proequities, Inc. | 0 | 0 | ||||||
| 2025-08-04 | 13F | Flagship Harbor Advisors, Llc | 28,873 | 2.00 | 996 | 12.81 | ||||
| 2025-07-24 | 13F | Ronald Blue Trust, Inc. | 898 | 0.00 | 31 | 7.14 | ||||
| 2025-07-25 | 13F | Priebe Wealth Holdings LLC | 218,695 | 7,543 | ||||||
| 2025-08-11 | 13F | Strategic Wealth Partners, Ltd. | 343 | 12 | ||||||
| 2025-08-06 | 13F | Modera Wealth Management, LLC | 16,622 | 0.05 | 573 | 10.62 | ||||
| 2025-08-06 | 13F | Able Wealth Management LLC | 152,601 | 0.89 | 5,263 | 11.58 | ||||
| 2025-08-15 | 13F | Tower Research Capital LLC (TRC) | 1,316 | -96.23 | 45 | -95.87 | ||||
| 2025-08-12 | 13F | Maripau Wealth Management Llc | 34,555 | 28.00 | 1,192 | 41.45 | ||||
| 2025-05-08 | 13F | Eastern Bank | 0 | -100.00 | 0 | |||||
| 2025-07-15 | 13F | Axis Wealth Partners, LLC | 9,888 | 341 | ||||||
| 2025-08-06 | 13F | AE Wealth Management LLC | 3,546 | 54.38 | 122 | 71.83 | ||||
| 2025-08-07 | 13F | Hughes Financial Services, LLC | 0 | -100.00 | 0 | |||||
| 2025-08-07 | 13F | New England Private Wealth Advisors LLC | 32,253 | 3.20 | 1,132 | 16.22 | ||||
| 2025-07-08 | 13F | Arlington Trust Co LLC | 3,840 | 0.00 | 132 | 10.92 | ||||
| 2025-07-09 | 13F | Fragasso Group Inc. | 3,295,512 | 24.38 | 113,662 | 37.54 | ||||
| 2025-07-31 | 13F | Cambridge Investment Research Advisors, Inc. | 156,612 | 2.31 | 5 | 25.00 | ||||
| 2025-07-15 | 13F | Mather Group, Llc. | 35,750 | 0.00 | 1,233 | 10.58 | ||||
| 2025-08-14 | 13F | Mercer Global Advisors Inc /adv | 20,135 | 3.91 | 695 | 16.64 | ||||
| 2025-07-23 | 13F | Element Wealth, LLC | 16,781 | 35.57 | 579 | 49.74 | ||||
| 2025-08-05 | 13F | Prosperity Wealth Management, Inc. | 12,478 | 4.51 | 430 | 15.59 | ||||
| 2025-08-05 | 13F | GPS Wealth Strategies Group, LLC | 100 | 3 | ||||||
| 2025-08-08 | 13F | Cetera Investment Advisers | 57,143 | 25.37 | 1,971 | 38.63 | ||||
| 2025-07-15 | 13F | Retirement Income Solutions, Inc | 5,926 | 204 | ||||||
| 2025-08-12 | 13F | O'shaughnessy Asset Management, Llc | 1,800 | 47.06 | 62 | 63.16 | ||||
| 2025-04-07 | 13F | Tompkins Financial Corp | 0 | -100.00 | 0 | |||||
| 2025-08-14 | 13F | NCM Capital Management, LLC | 13,361 | 0.27 | 461 | 10.84 | ||||
| 2025-08-08 | 13F | Ogorek Anthony Joseph /ny/ /adv | 2,485 | 0.28 | 0 | |||||
| 2025-07-14 | 13F | Rooted Wealth Advisors, Inc. | 94,814 | 9.63 | 3,278 | 34.25 | ||||
| 2025-08-13 | 13F | Summit Wealth Group Llc / Co | 32,206 | 1,111 | ||||||
| 2025-08-05 | 13F | Dunhill Financial, LLC | 859 | 0.00 | 30 | 11.54 | ||||
| 2025-08-14 | 13F | Old Mission Capital Llc | 0 | -100.00 | 0 | |||||
| 2025-08-14 | 13F | Bank Of America Corp /de/ | 29,729 | -52.09 | 1,025 | -47.03 | ||||
| 2025-08-22 | NP | Variable Insurance Products Fund V - FundsManager 60% Portfolio Investor Class | 705,575 | -76.09 | 24,335 | -73.56 | ||||
| 2025-08-14 | 13F | CoreCap Advisors, LLC | 859 | 0.23 | 30 | 11.54 | ||||
| 2025-08-04 | 13F | Creekmur Asset Management LLC | 5,026 | 173 | ||||||
| 2025-08-06 | 13F | Golden State Wealth Management, LLC | 180 | 0.00 | 6 | 20.00 | ||||
| 2025-08-12 | 13F | Wood Tarver Financial Group, LLC | 129 | 0 | ||||||
| 2025-07-24 | 13F | Wealthstar Advisors, Llc | 6,852 | 4.83 | 236 | 16.26 | ||||
| 2025-05-15 | 13F | Two Sigma Securities, Llc | 0 | -100.00 | 0 | -100.00 | ||||
| 2025-07-02 | 13F | HBW Advisory Services LLC | 7,044 | 0.00 | 243 | 10.50 | ||||
| 2025-07-28 | 13F | Harbour Investments, Inc. | 22,783 | -1.53 | 786 | 8.88 | ||||
| 2025-08-14 | 13F | Hrt Financial Lp | 0 | -100.00 | 0 | |||||
| 2025-08-01 | 13F | First Command Advisory Services, Inc. | 67 | 0.00 | 2 | 0.00 | ||||
| 2025-07-24 | 13F | IFP Advisors, Inc | 2,069 | -39.82 | 71 | -33.64 | ||||
| 2025-08-08 | 13F | Kingsview Wealth Management, LLC | 15,283 | 0.74 | 527 | 11.42 | ||||
| 2025-08-14 | 13F | Wells Fargo & Company/mn | 54,656 | 1,557.75 | 1,885 | 1,748.04 | ||||
| 2025-08-14 | 13F | Citadel Advisors Llc | 22,595 | -78.15 | 779 | -75.84 | ||||
| 2025-07-30 | 13F | D.a. Davidson & Co. | 49,693 | -10.77 | 1,714 | -1.38 | ||||
| 2025-08-19 | 13F | Advisory Services Network, LLC | 20,768 | 4.44 | 727 | 17.10 | ||||
| 2025-08-14 | 13F | Raymond James Financial Inc | 427,288 | -9.50 | 14,737 | 0.08 | ||||
| 2025-08-22 | NP | Variable Insurance Products Fund V - FundsManager 70% Portfolio Investor Class | 402,559 | -59.33 | 13,884 | -55.03 | ||||
| 2025-08-07 | 13F | Flagship Wealth Advisors, Llc | 142,783 | 69.00 | 4,925 | 86.87 | ||||
| 2025-08-14 | 13F | EP Wealth Advisors, Inc. | 4,387 | 5.36 | 151 | 17.05 | ||||
| 2025-08-13 | 13F | Jones Financial Companies Lllp | 0 | -100.00 | 0 | |||||
| 2025-08-12 | 13F | CIBC Private Wealth Group, LLC | 2,812 | 56.74 | 97 | 95.92 | ||||
| 2025-07-25 | 13F | Concord Wealth Partners | 253 | 0.00 | 9 | 14.29 | ||||
| 2025-07-24 | 13F | Leo Wealth, LLC | 7,175 | 2.84 | 247 | 13.82 | ||||
| 2025-08-13 | 13F | Cerity Partners LLC | 186,678 | 5.34 | 6,438 | 16.48 | ||||
| 2025-07-07 | 13F | Kings Path Partners LLC | 117 | 4 | ||||||
| 2025-04-02 | 13F | Global Wealth Strategies & Associates | 0 | -100.00 | 0 | |||||
| 2025-07-22 | 13F | Valeo Financial Advisors, LLC | 16,473 | -3.85 | 568 | 6.37 | ||||
| 2025-08-14 | 13F | Jane Street Group, Llc | 1,370,421 | 406.33 | 47,266 | 459.95 | ||||
| 2025-07-18 | 13F | Truist Financial Corp | 57,848 | 17.56 | 1,995 | 30.05 | ||||
| 2025-08-04 | 13F | IFG Advisory, LLC | 28,112 | 35.34 | 970 | 49.77 | ||||
| 2025-08-14 | 13F | Certified Advisory Corp | 32,665 | 0.27 | 1,127 | 10.83 | ||||
| 2025-08-14 | 13F | D. E. Shaw & Co., Inc. | 6,491 | 224 | ||||||
| 2025-05-16 | 13F | Coppell Advisory Solutions LLC | 0 | -100.00 | 0 | |||||
| 2025-05-27 | NP | Variable Insurance Products Fund V - FundsManager 40% Portfolio Service Class | 10,291 | 81.44 | 321 | 72.04 | ||||
| 2025-08-08 | 13F | TD Capital Management LLC | 7,688 | 0.27 | 265 | 10.88 | ||||
| 2025-07-29 | 13F | Salus Financial Advisors, LLC | 37,597 | -18.19 | 1,297 | -9.56 | ||||
| 2025-08-12 | 13F | Howe & Rusling Inc | 51 | 2 | ||||||
| 2025-07-30 | 13F | Cullen/frost Bankers, Inc. | 0 | -100.00 | 0 | |||||
| 2025-08-14 | 13F | Florida Financial Advisors, Llc | 0 | -100.00 | 0 | |||||
| 2025-08-13 | 13F | Renaissance Technologies Llc | 63,100 | 221.94 | 2,176 | 256.14 | ||||
| 2025-08-15 | 13F | Equitable Holdings, Inc. | 164,458 | 162.78 | 5,672 | 190.72 | ||||
| 2025-07-25 | 13F | Cwm, Llc | 230,866 | 2,583.86 | 8 | |||||
| 2025-08-14 | 13F | Mml Investors Services, Llc | 123,215 | -21.09 | 4 | 0.00 | ||||
| 2025-07-30 | 13F | Strategic Blueprint, LLC | 24,871 | 18.24 | 858 | 30.64 | ||||
| 2025-08-11 | 13F | Aptus Capital Advisors, LLC | 1,874 | 0.32 | 65 | 10.34 | ||||
| 2025-08-27 | 13F/A | Brinker Capital Investments, LLC | 6,863 | -38.45 | 237 | -31.99 | ||||
| 2025-08-15 | 13F | Morgan Stanley | 26,555 | 8.63 | 916 | 20.08 | ||||
| 2025-08-14 | 13F | Qube Research & Technologies Ltd | 4,153 | -69.60 | 143 | -66.43 | ||||
| 2025-08-08 | 13F | Avantax Advisory Services, Inc. | 368,414 | 4.71 | 12,707 | 15.78 | ||||
| 2025-04-25 | 13F | TBH Global Asset Management, LLC | 0 | -100.00 | 0 | |||||
| 2025-07-09 | 13F | WealthCare Investment Partners, LLC | 10,039 | 0.00 | 350 | 21.18 | ||||
| 2025-07-11 | 13F | Farther Finance Advisors, LLC | 5,300 | -13.57 | 183 | -5.21 | ||||
| 2025-08-25 | 13F | Silverlake Wealth Management Llc | 75,397 | 10.10 | 2,600 | 21.78 | ||||
| 2025-08-13 | 13F | Mayfair Advisory Group, LLC | 22,636 | 2.13 | 803 | 16.06 | ||||
| 2025-07-10 | 13F | Wealth Enhancement Advisory Services, Llc | 224,140 | 1,206.02 | 7,805 | 1,358.69 | ||||
| 2025-08-08 | 13F | King Wealth | 6,789 | 0.22 | 0 | |||||
| 2025-08-11 | 13F | HighTower Advisors, LLC | 1,459,228 | 19.06 | 50,329 | 31.66 | ||||
| 2025-07-24 | 13F | Us Bancorp \de\ | 10,059 | 61.43 | 347 | 78.35 | ||||
| 2025-08-12 | 13F | MAI Capital Management | 417 | 0.00 | 14 | 7.69 | ||||
| 2025-07-29 | 13F | Harbor Asset Planning, Inc. | 12,862 | 444 | ||||||
| 2025-08-13 | 13F | Capital Analysts, Inc. | 523 | -96.73 | 0 | |||||
| 2025-08-11 | 13F | Ritter Daniher Financial Advisory LLC / DE | 2,847 | 0.00 | 98 | 11.36 | ||||
| 2025-08-12 | 13F | J.w. Cole Advisors, Inc. | 26,122 | 53.85 | 901 | 70.13 | ||||
| 2025-07-16 | 13F | Legend Financial Advisors, Inc. | 99 | 3 | ||||||
| 2025-07-24 | 13F | Williams & Novak, LLC | 153,685 | 3.46 | 5,301 | 13.88 | ||||
| 2025-08-19 | 13F | National Asset Management, Inc. | 35,019 | 30.84 | 1,208 | 37.00 | ||||
| 2025-08-11 | 13F | Private Advisor Group, LLC | 38,274 | 24.13 | 1,320 | 37.36 | ||||
| 2025-07-07 | 13F | Roxbury Financial LLC | 5,313 | 2.06 | 183 | 6.40 | ||||
| 2025-07-15 | 13F | Financial Partners Group, Inc | 186,226 | -11.90 | 6,423 | -2.59 | ||||
| 2025-08-05 | 13F | EPG Wealth Management LLC | 1,226 | 0.33 | 42 | 10.53 | ||||
| 2025-08-07 | 13F | BOK Financial Private Wealth, Inc. | 141 | 5 | ||||||
| 2025-07-14 | 13F | Kfg Wealth Management, Llc | 2,224,321 | 9.19 | 76,717 | 20.75 | ||||
| 2025-08-11 | 13F | Brown Brothers Harriman & Co | 90 | 0.00 | 3 | 50.00 | ||||
| 2025-08-04 | 13F | Assetmark, Inc | 256 | -12.93 | 9 | -11.11 | ||||
| 2025-08-05 | 13F | GHP Investment Advisors, Inc. | 20 | 33.33 | 1 | |||||
| 2025-08-12 | 13F | Change Path, LLC | 6,926 | 239 | ||||||
| 2025-08-11 | 13F | Principal Securities, Inc. | 193,241 | 3,794.42 | 6,665 | 3,988.34 | ||||
| 2025-08-06 | 13F | SJA Financial Advisory, LLC | 31,394 | -6.58 | 1,083 | 3.24 | ||||
| 2025-08-06 | 13F | Commonwealth Equity Services, Llc | 3,537,702 | 1.14 | 122 | 11.93 | ||||
| 2025-08-13 | 13F | Northwestern Mutual Wealth Management Co | 634,502 | -40.79 | 21,884 | -34.52 | ||||
| 2025-07-08 | 13F | Parallel Advisors, LLC | 110 | -97.18 | 4 | -97.52 | ||||
| 2025-07-10 | 13F | Oliver Lagore Vanvalin Investment Group | 0 | 0 | ||||||
| 2025-08-13 | 13F | Twin Peaks Wealth Advisors, LLC | 516 | 18 | ||||||
| 2025-07-30 | 13F | Canvas Wealth Advisors, LLC | 76,580 | 42.35 | 2,699 | 70.71 | ||||
| 2025-08-14 | 13F | Comerica Bank | 4,519 | 0.00 | 156 | 10.71 | ||||
| 2025-08-14 | 13F | Investmark Advisory Group LLC | 54,498 | 1,880 | ||||||
| 2025-08-04 | 13F | Pinnacle Associates Ltd | 8,371 | -1.51 | 289 | 8.68 | ||||
| 2025-08-18 | 13F | Geneos Wealth Management Inc. | 228 | 100.00 | 8 | 133.33 | ||||
| 2025-08-22 | NP | Variable Insurance Products Fund V - Target Volatility Portfolio Service Class | 386,087 | 508.63 | 13,316 | 573.21 | ||||
| 2025-08-14 | 13F | Goldman Sachs Group Inc | 71,838 | -96.93 | 2,478 | -96.61 | ||||
| 2025-08-13 | 13F | Fisher Asset Management, LLC | 0 | -100.00 | 0 | |||||
| 2025-07-16 | 13F | Signaturefd, Llc | 6,350 | 0.00 | 219 | 10.61 | ||||
| 2025-08-01 | 13F | Schmidt P J Investment Management Inc | 6,708 | 231 | ||||||
| 2025-08-14 | 13F | Mariner, LLC | 29,108 | 61.24 | 1,004 | 78.15 | ||||
| 2025-07-25 | 13F | Concurrent Investment Advisors, LLC | 15,209 | 58.79 | 525 | 75.84 | ||||
| 2025-08-05 | 13F | Bank Of Montreal /can/ | 1,221 | 32.57 | 42 | 50.00 | ||||
| 2025-04-25 | 13F | JNBA Financial Advisors | 0 | -100.00 | 0 | |||||
| 2025-05-27 | NP | Variable Insurance Products Fund V - FundsManager 30% Portfolio Service Class | 7,664 | 130.63 | 239 | 119.27 | ||||
| 2025-07-31 | 13F | Briaud Financial Planning, Inc | 0 | -100.00 | 0 | |||||
| 2025-08-13 | 13F | Lido Advisors, LLC | 19,188 | 3.84 | 662 | 14.76 | ||||
| 2025-08-07 | 13F | Rollins Financial Advisors, LLC | 67,578 | -0.75 | 2,331 | 9.75 | ||||
| 2025-08-05 | 13F | Huntington National Bank | 8 | 14.29 | ||||||
| 2025-07-22 | 13F | Mascoma Wealth Management LLC | 370,885 | 7.61 | 12,792 | 19.00 | ||||
| 2025-07-17 | 13F | Sound Income Strategies, LLC | 16 | 1 | ||||||
| 2025-07-15 | 13F | Bfsg, Llc | 1,389 | 48 | ||||||
| 2025-08-14 | 13F | Fortress Financial Group, Llc | 238,410 | 8,223 | ||||||
| 2025-07-21 | 13F | Ameriflex Group, Inc. | 343 | 0.00 | 12 | 10.00 | ||||
| 2025-08-04 | 13F | Spire Wealth Management | 8,665 | 4.44 | 299 | 15.50 | ||||
| 2025-07-10 | 13F | Signal Advisors Wealth, LLC | 34,555 | 26.98 | 1,192 | 40.45 | ||||
| 2025-08-13 | 13F | Russell Investments Group, Ltd. | 1,279 | -42.47 | 44 | -36.23 | ||||
| 2025-07-15 | 13F | Herbst Group, Llc | 7,195 | 248 | ||||||
| 2025-08-14 | 13F | Royal Bank Of Canada | 155,078 | -39.48 | 5,348 | -33.08 | ||||
| 2025-08-14 | 13F | Colony Group, LLC | 68,153 | -0.84 | 2,351 | 9.66 | ||||
| 2025-08-11 | 13F | Lighthouse Financial LLC | 11,050 | -39.91 | 381 | -33.51 | ||||
| 2025-08-14 | 13F | Sunbelt Securities, Inc. | 1,904 | -40.48 | 63 | -37.37 | ||||
| 2025-07-22 | 13F | BridgePort Financial Solutions, LLC | 20,003 | 0.00 | 690 | 10.59 | ||||
| 2025-07-09 | 13F | Lincoln Capital Corp | 156,134 | 1.40 | 5,385 | 12.14 | ||||
| 2025-08-13 | 13F | EverSource Wealth Advisors, LLC | 71 | -72.48 | 2 | -75.00 | ||||
| 2025-07-23 | 13F | Sax Wealth Advisors, Llc | 65,932 | 23.80 | 2,274 | 36.85 | ||||
| 2025-07-31 | 13F | Glass Jacobson Investment Advisors llc | 3,219 | 0.56 | 111 | 5.71 | ||||
| 2025-08-12 | 13F | LPL Financial LLC | 2,141,139 | 75.69 | 73,848 | 94.28 |