Mga Batayang Estadistika
| Pemilik Institusional | 210 total, 210 long only, 0 short only, 0 long/short - change of 5.47% MRQ |
| Alokasi Portofolio Rata-rata | 0.2464 % - change of 4.70% MRQ |
| Saham Institusional (Jangka Panjang) | 17,227,369 (ex 13D/G) - change of 0.53MM shares 3.17% MRQ |
| Nilai Institusional (Jangka Panjang) | $ 442,326 USD ($1000) |
Kepemilikan Institusional dan Pemegang Saham
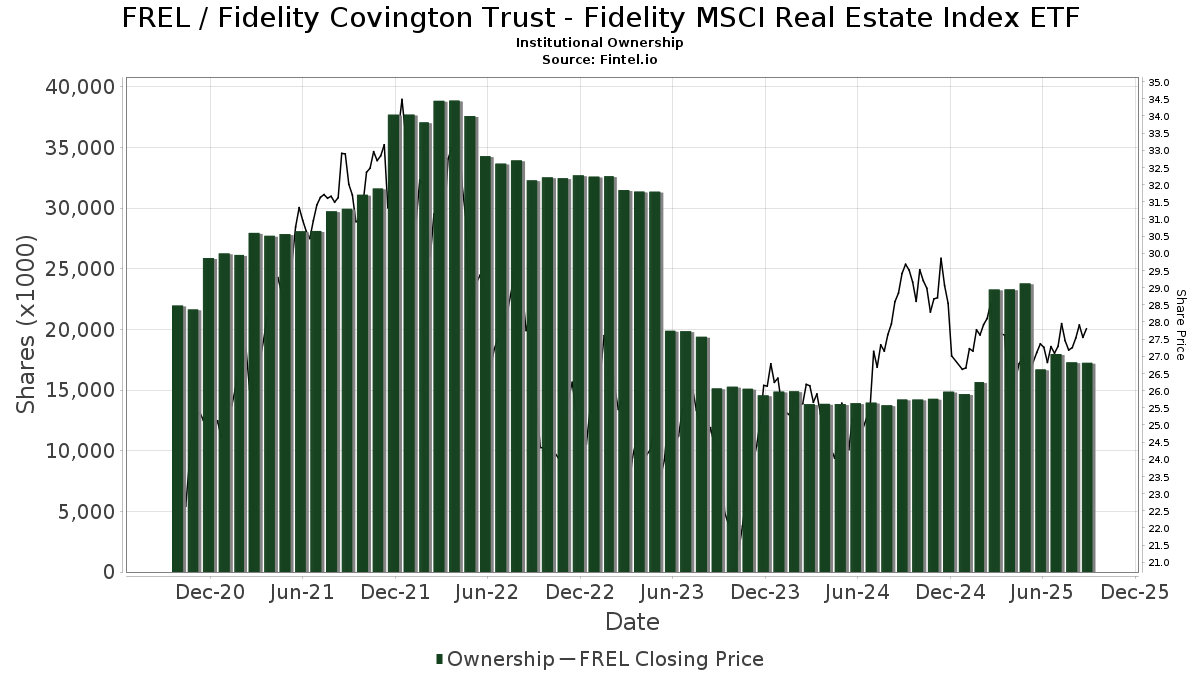
Fidelity Covington Trust - Fidelity MSCI Real Estate Index ETF (US:FREL) memiliki 210 pemilik institusional dan pemegang saham yang telah mengajukan formulir 13D/G atau 13F kepada Komisi Bursa Efek (Securities Exchange Commission/SEC). Lembaga-lembaga ini memegang total 17,227,369 saham. Pemegang saham terbesar meliputi Northern Lights Fund Trust - PFG Fidelity Institutional AM® Equity Sector Strategy Fund Class R Shares, Lido Advisors, LLC, Pnc Financial Services Group, Inc., AE Wealth Management LLC, Citizens & Northern Corp, Truefg, Llc, Black Diamond Financial, LLC, Envestnet Asset Management Inc, Commonwealth Equity Services, Llc, and Riverpoint Wealth Management Holdings, LLC .
Struktur kepemilikan institusional Fidelity Covington Trust - Fidelity MSCI Real Estate Index ETF (ARCA:FREL) menunjukkan posisi terkini di perusahaan oleh institusi dan dana, serta perubahan terbaru dalam ukuran posisi. Pemegang saham utama dapat mencakup investor individu, reksa dana, dana lindung nilai, atau institusi. Jadwal 13D menunjukkan bahwa investor memegang (atau pernah memegang) lebih dari 5% saham perusahaan dan bermaksud (atau pernah bermaksud) untuk secara aktif mengejar perubahan strategi bisnis. Jadwal 13G menunjukkan investasi pasif lebih dari 5%.
The share price as of September 3, 2025 is 27.55 / share. Previously, on September 4, 2024, the share price was 28.84 / share. This represents a decline of 4.47% over that period.
Skor Sentimen Dana
Skor Sentimen Dana (sebelumnya dikenal sebagai Skor Akumulasi Kepemilikan) menemukan saham-saham yang paling banyak dibeli oleh dana. Ini adalah hasil dari model kuantitatif multi-faktor yang canggih yang mengidentifikasi perusahaan dengan tingkat akumulasi institusional tertinggi. Model penilaian menggunakan kombinasi dari total peningkatan pemilik yang diungkapkan, perubahan dalam alokasi portofolio pada pemilik tersebut, dan metrik lainnya. Angka berkisar dari 0 hingga 100, dengan angka yang lebih tinggi menunjukkan tingkat akumulasi yang lebih tinggi dibandingkan dengan perusahaan sejenisnya, dan 50 adalah rata-ratanya.
Frekuensi Pembaruan: Setiap Hari
Lihat Ownership Explorer, yang menyediakan daftar perusahaan dengan peringkat tertinggi.
Rasio Put/Call Institusional
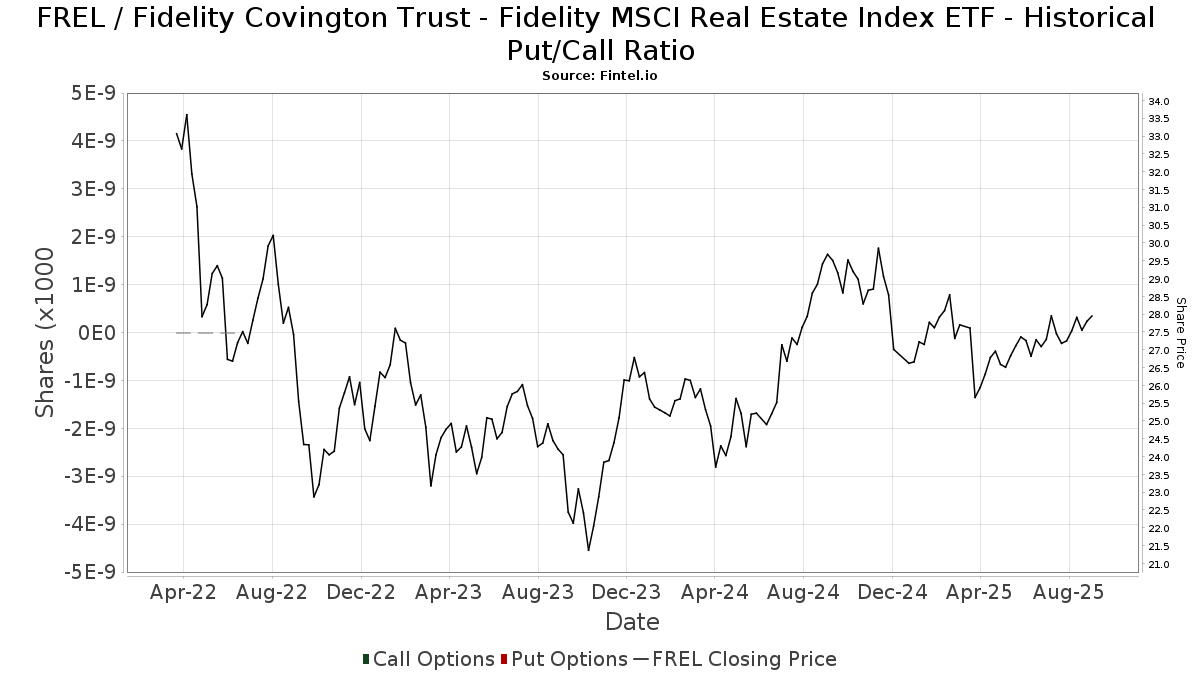
Selain melaporkan isu ekuitas dan utang standar, institusi dengan aset di bawah manajemen lebih dari 100 juta dolar AS juga harus mengungkapkan kepemilikan opsi put dan call mereka. Karena opsi put umumnya menunjukkan sentimen negatif, dan opsi call menunjukkan sentimen positif, kita dapat mengetahui sentimen institusional secara keseluruhan dengan memplot rasio put terhadap call. Grafik di sebelah kanan memplot rasio put/call historis untuk instrumen ini.
Menggunakan Rasio Put/Call sebagai indikator sentimen investor mengatasi salah satu kekurangan utama dari penggunaan total kepemilikan institusional, yaitu sejumlah besar aset yang dikelola diinvestasikan secara pasif untuk melacak indeks. Dana yang dikelola secara pasif biasanya tidak membeli opsi, sehingga indikator rasio put/call lebih akurat dalam melacak sentimen dana yang dikelola secara aktif.
Pengajuan 13F dan NPORT
Detail pada pengajuan 13F tersedia gratis. Detail pada pengajuan NP memerlukan keanggotaan premium. Baris berwarna hijau menunjukkan posisi baru. Baris berwarna merah menunjukkan posisi yang sudah ditutup. Klik tautan ini ikon untuk melihat riwayat transaksi selengkapnya.
Tingkatkan
untuk membuka data premium dan mengekspor ke Excel ![]() .
.
| Tanggal File | Sumber | Investor | Ketik | Presyo ng Avg (Silangan) |
Saham | Δ Saham (%) |
Dilaporkan Nilai ($1000) |
Nilai Δ (%) |
Alokasi Port (%) |
|
|---|---|---|---|---|---|---|---|---|---|---|
| 2025-07-30 | 13F | Caliber Wealth Management, LLC / KS | 48,066 | -4.80 | 1,300 | -6.28 | ||||
| 2025-04-29 | 13F | Resources Investment Advisors, LLC. | 0 | -100.00 | 0 | |||||
| 2025-07-21 | 13F | Ameritas Advisory Services, LLC | 8,516 | -28.84 | 230 | -29.45 | ||||
| 2025-05-13 | 13F | Bokf, Na | 0 | -100.00 | 0 | -100.00 | ||||
| 2025-08-14 | 13F | GWM Advisors LLC | 6 | -14.29 | 0 | |||||
| 2025-08-14 | 13F | Full Sail Capital, LLC | 45,111 | -4.41 | 1,220 | -5.94 | ||||
| 2025-08-01 | 13F | Envestnet Asset Management Inc | 532,562 | -39.99 | 14,400 | -40.93 | ||||
| 2025-08-14 | 13F | Clarity Asset Management, Inc. | 15,695 | -1.70 | 424 | -3.20 | ||||
| 2025-07-30 | 13F | Citizens & Northern Corp | 820,011 | 3.75 | 22,173 | 2.13 | ||||
| 2025-04-21 | 13F | Kingswood Wealth Advisors, Llc | 0 | -100.00 | 0 | |||||
| 2025-08-15 | 13F | Kestra Advisory Services, LLC | 53,047 | 15.79 | 1,434 | 13.99 | ||||
| 2025-08-07 | 13F | Nwam Llc | 64,360 | -4.82 | 1,767 | -4.90 | ||||
| 2025-08-08 | 13F | Capital Investment Advisory Services, LLC | 6,610 | -5.83 | 179 | -7.29 | ||||
| 2025-08-12 | 13F | Global Retirement Partners, LLC | 15,464 | -18.37 | 418 | -18.20 | ||||
| 2025-08-14 | 13F | Essential Planning, LLC. | 131,503 | 1.69 | 3,556 | 0.08 | ||||
| 2025-08-14 | 13F | Bnp Paribas Arbitrage, Sa | 4 | 0 | ||||||
| 2025-08-05 | 13F | Tufton Capital Management | 8,838 | 0.00 | 0 | -100.00 | ||||
| 2025-08-14 | 13F | Fmr Llc | 5,886 | 6.23 | 159 | 4.61 | ||||
| 2025-08-15 | 13F | Provenance Wealth Advisors, LLC | 15 | 0.00 | 0 | |||||
| 2025-07-14 | 13F | Ridgewood Investments LLC | 250 | -6.37 | 7 | -14.29 | ||||
| 2025-07-08 | 13F | 21 West Wealth Management LLC | 39,972 | 1,081 | ||||||
| 2025-07-07 | 13F | Investors Research Corp | 176 | 0.00 | 5 | 0.00 | ||||
| 2025-08-12 | 13F | Atlas Capital Advisors Llc | 8,039 | -53.69 | 217 | -54.41 | ||||
| 2025-08-14 | 13F | Stifel Financial Corp | 64,875 | -1.37 | 1,754 | -2.88 | ||||
| 2025-08-12 | 13F | Kohmann Bosshard Financial Services, LLC | 11,131 | 0.00 | 301 | -1.64 | ||||
| 2025-05-02 | 13F | DecisionPoint Financial, LLC | 0 | -100.00 | 0 | -100.00 | ||||
| 2025-07-15 | 13F | Fifth Third Bancorp | 597 | 0.00 | 16 | 0.00 | ||||
| 2025-07-24 | 13F | Galvin, Gaustad & Stein, LLC | 7,744 | 209 | ||||||
| 2025-08-13 | 13F | Quadrature Capital Ltd | 0 | -100.00 | 0 | |||||
| 2025-08-12 | 13F | Rather & Kittrell, Inc. | 32,300 | -0.78 | 873 | -2.35 | ||||
| 2025-07-31 | 13F | Sage Mountain Advisors LLC | 0 | -100.00 | 0 | |||||
| 2025-08-15 | 13F | Truefg, Llc | 603,416 | 2.78 | 16,316 | 1.17 | ||||
| 2025-08-06 | 13F | Soltis Investment Advisors LLC | 57,609 | 0.02 | 1,558 | -1.58 | ||||
| 2025-08-14 | 13F | Staley Capital Advisers Inc | 9,389 | 254 | ||||||
| 2025-07-24 | 13F | Robertson Stephens Wealth Management, LLC | 9,440 | 0.00 | 255 | -1.54 | ||||
| 2025-08-08 | 13F | Pnc Financial Services Group, Inc. | 1,122,803 | -7.61 | 30,361 | -9.06 | ||||
| 2025-08-12 | 13F | Jpmorgan Chase & Co | 56,975 | 33.62 | 1,541 | 31.51 | ||||
| 2025-05-05 | 13F | PCA Investment Advisory Services Inc. | 0 | -100.00 | 0 | |||||
| 2025-07-25 | 13F | Lodestar Private Asset Management Llc | 71,751 | 3.54 | 1,940 | 1.94 | ||||
| 2025-08-12 | 13F | Steward Partners Investment Advisory, Llc | 105,892 | 13,304.05 | 2,863 | 13,533.33 | ||||
| 2025-04-24 | 13F | HighMark Wealth Management LLC | 0 | -100.00 | 0 | |||||
| 2025-08-04 | 13F | Atria Investments Llc | 39,891 | -6.37 | 1,079 | -7.86 | ||||
| 2025-07-30 | 13F | Financial Perspectives, Inc | 3,073 | 0.99 | 83 | 0.00 | ||||
| 2025-07-30 | 13F | Brookstone Capital Management | 13,660 | -5.08 | 369 | -6.58 | ||||
| 2025-08-06 | 13F | Modera Wealth Management, LLC | 11,267 | 0.00 | 305 | -1.62 | ||||
| 2025-08-14 | 13F | Transamerica Financial Advisors, Inc. | 4 | 0.00 | 0 | |||||
| 2025-07-31 | 13F | Cambridge Investment Research Advisors, Inc. | 74,608 | 1.02 | 2 | 0.00 | ||||
| 2025-08-14 | 13F | Jane Street Group, Llc | 15,874 | 429 | ||||||
| 2025-08-14 | 13F | EP Wealth Advisors, Inc. | 15,066 | -3.13 | 407 | -4.68 | ||||
| 2025-08-13 | 13F | KDK Private Wealth Management, LLC | 9,343 | -4.18 | 253 | -5.62 | ||||
| 2025-08-01 | 13F | Penobscot Wealth Management | 13,146 | 2.18 | 355 | 0.57 | ||||
| 2025-08-14 | 13F | Raymond James Financial Inc | 112,015 | -2.43 | 3,029 | -3.96 | ||||
| 2025-07-08 | 13F | Rise Advisors, LLC | 198 | 1.02 | 5 | 0.00 | ||||
| 2025-08-12 | 13F | Palisades Hudson Asset Management, L.P. | 61,141 | 1.29 | 2 | 0.00 | ||||
| 2025-08-08 | 13F | Cetera Investment Advisers | 42,412 | -77.93 | 1,147 | -78.29 | ||||
| 2025-07-11 | 13F | Eagle Bay Advisors LLC | 54,633 | -3.67 | 1,477 | -5.14 | ||||
| 2025-04-21 | 13F | Nelson, Van Denburg & Campbell Wealth Management Group, LLC | 0 | -100.00 | 0 | |||||
| 2025-08-08 | 13F | Larson Financial Group LLC | 14,439 | 41.05 | 390 | 38.79 | ||||
| 2025-04-29 | 13F | Lee Danner & Bass Inc | 0 | -100.00 | 0 | |||||
| 2025-08-06 | 13F | Agf Management Ltd | 303,151 | 1.50 | 8,197 | -0.09 | ||||
| 2025-08-13 | 13F | GeoWealth Management, LLC | 294 | 8 | ||||||
| 2025-08-13 | 13F | Smith, Moore & Co. | 36,797 | 0.00 | 995 | -1.58 | ||||
| 2025-07-22 | 13F | Apexium Financial, Lp | 9,757 | -1.38 | 264 | -2.95 | ||||
| 2025-08-21 | 13F | Pathway Financial Advisers, LLC | 8,924 | -2.51 | 241 | -3.98 | ||||
| 2025-08-12 | 13F | Armor Investment Advisors, LLC | 3 | -84.21 | 0 | |||||
| 2025-08-12 | 13F | O'shaughnessy Asset Management, Llc | 981 | -28.34 | 27 | -29.73 | ||||
| 2025-08-05 | 13F | Beckerman Institutional, LLC | 49,792 | 42.78 | 1 | |||||
| 2025-03-21 | 13F | Prostatis Group LLC | 0 | -100.00 | 0 | |||||
| 2025-08-14 | 13F | Glenmede Investment Management, LP | 2,460 | 67 | ||||||
| 2025-05-02 | 13F | Capital A Wealth Management, LLC | 103 | 415.00 | 3 | |||||
| 2025-08-14 | 13F | Harwood Advisory Group, LLC | 0 | -100.00 | 0 | -100.00 | ||||
| 2025-07-17 | 13F | Raleigh Capital Management Inc. | 4 | 100.00 | 0 | |||||
| 2025-08-08 | 13F | Tortoise Investment Management, LLC | 51,254 | -1.35 | 1,386 | -2.94 | ||||
| 2025-08-13 | 13F | Jones Financial Companies Lllp | 2,776 | 116.54 | 75 | 117.65 | ||||
| 2025-08-15 | 13F | Tower Research Capital LLC (TRC) | 29,797 | 806 | ||||||
| 2025-04-09 | 13F | Roxbury Financial LLC | 0 | -100.00 | 0 | |||||
| 2025-08-07 | 13F | Allworth Financial LP | 1,086 | 0.00 | 29 | 3.57 | ||||
| 2025-08-13 | 13F | Balanced Wealth Group Llc | 26,533 | 0.65 | 718 | -0.97 | ||||
| 2025-08-12 | 13F | Proequities, Inc. | 0 | 0 | ||||||
| 2025-07-29 | 13F | Foster & Motley Inc | 9,893 | 11.55 | 0 | |||||
| 2025-08-05 | 13F | Sigma Planning Corp | 10,337 | -5.59 | 280 | -7.00 | ||||
| 2025-08-14 | 13F | NorthLanding Financial Partners, LLC | 9,726 | -0.39 | 263 | -1.87 | ||||
| 2025-08-01 | 13F | Brookwood Investment Group LLC | 0 | -100.00 | 0 | |||||
| 2025-08-13 | 13F | Summit Wealth Group Llc / Co | 45,363 | 1,227 | ||||||
| 2025-08-14 | 13F | Susquehanna International Group, Llp | 50,346 | 1,361 | ||||||
| 2025-08-14 | 13F | UBS Group AG | 98,292 | -23.38 | 2,658 | -24.60 | ||||
| 2025-08-05 | 13F | Blue Barn Wealth, LLC | 120,775 | 3.16 | 3,266 | 1.56 | ||||
| 2025-08-12 | 13F | AlphaCore Capital LLC | 30 | 1 | ||||||
| 2025-08-15 | 13F | Koesten, Hirschmann & Crabtree, INC. | 468 | 60.82 | 13 | 71.43 | ||||
| 2025-07-18 | 13F | Pure Financial Advisors, Inc. | 410,078 | -1.52 | 11,088 | -3.06 | ||||
| 2025-07-21 | 13F | Quent Capital, LLC | 0 | -100.00 | 0 | |||||
| 2025-08-13 | 13F | Colonial Trust Co / SC | 7,694 | -24.89 | 208 | -25.98 | ||||
| 2025-07-30 | 13F | Black Diamond Financial, LLC | 566,976 | 0.14 | 15,331 | -1.43 | ||||
| 2025-08-14 | 13F | Wells Fargo & Company/mn | 25,818 | 53.44 | 698 | 51.08 | ||||
| 2025-05-15 | 13F | Qube Research & Technologies Ltd | 0 | -100.00 | 0 | |||||
| 2025-08-05 | 13F | Key FInancial Inc | 54 | 0.00 | 1 | 0.00 | ||||
| 2025-07-24 | 13F | IFP Advisors, Inc | 25,665 | 0.51 | 694 | -1.14 | ||||
| 2025-07-25 | 13F | Concord Wealth Partners | 854 | 0.95 | 23 | 0.00 | ||||
| 2025-08-05 | 13F | Snider Financial Group | 16,519 | 2.69 | 447 | 1.13 | ||||
| 2025-08-19 | 13F | Advisory Services Network, LLC | 21,253 | -86.27 | 575 | -86.48 | ||||
| 2025-05-16 | 13F/A | Kestra Investment Management, LLC | 0 | -100.00 | 0 | |||||
| 2025-08-14 | 13F | Diversify Wealth Management, Llc | 150,809 | 2.25 | 4,073 | 3.59 | ||||
| 2025-08-14 | 13F | Kovitz Investment Group Partners, LLC | 102,291 | 2,766 | ||||||
| 2025-08-14 | 13F | Talon Private Wealth, LLC | 8,208 | -4.54 | 222 | -6.36 | ||||
| 2025-08-13 | 13F | Capital Analysts, Inc. | 0 | -100.00 | 0 | |||||
| 2025-08-14 | 13F | Citadel Advisors Llc | 33,087 | 166.74 | 895 | 162.94 | ||||
| 2025-07-21 | 13F | Life Planning Partners, Inc | 42,277 | -1.39 | 1,143 | -2.89 | ||||
| 2025-07-24 | 13F | Thompson Investment Management, Inc. | 8,846 | 0.43 | 239 | -0.83 | ||||
| 2025-07-30 | 13F | Demars Financial Group, LLC | 9,942 | -96.98 | 269 | 2,336.36 | ||||
| 2025-07-23 | 13F | Independent Solutions Wealth Management, LLC | 115,511 | 0.74 | 3,123 | -0.83 | ||||
| 2025-08-13 | 13F | Advisor Group Holdings, Inc. | 192,059 | -10.95 | 5,192 | -12.39 | ||||
| 2025-08-14 | 13F | Sunbelt Securities, Inc. | 13,194 | -28.83 | 357 | -30.06 | ||||
| 2025-07-28 | 13F | BRYN MAWR TRUST Co | 8,016 | 0.00 | 217 | -1.82 | ||||
| 2025-08-07 | 13F | Prospect Financial Group LLC | 102,140 | -0.38 | 2,762 | -1.95 | ||||
| 2025-07-09 | 13F | Tounjian Advisory Partners, Llc | 11,986 | -2.96 | 329 | -2.95 | ||||
| 2025-07-25 | 13F | Atria Wealth Solutions, Inc. | 55,917 | 13.24 | 1,518 | 11.87 | ||||
| 2025-06-30 | NP | Northern Lights Fund Trust - PFG Fidelity Institutional AM® Equity Sector Strategy Fund Class R Shares | 1,272,267 | 304.89 | 34,071 | 351.63 | ||||
| 2025-07-31 | 13F | Opes Wealth Management LLC | 120,698 | 2.41 | 3,264 | 0.80 | ||||
| 2025-08-07 | 13F | PFG Advisors | 0 | -100.00 | 0 | |||||
| 2025-08-11 | 13F | Aptus Capital Advisors, LLC | 1 | 0.00 | 0 | |||||
| 2025-08-14 | 13F | Mml Investors Services, Llc | 184,060 | 11.21 | 5 | 0.00 | ||||
| 2025-07-24 | 13F | Blair William & Co/il | 3,256 | -2.95 | 88 | -4.35 | ||||
| 2025-08-05 | 13F | Mission Wealth Management, Lp | 14,664 | -3.19 | 397 | -4.81 | ||||
| 2025-07-28 | 13F | Harbour Investments, Inc. | 93 | 1.09 | 3 | 0.00 | ||||
| 2025-08-08 | 13F | Avantax Advisory Services, Inc. | 404,892 | -2.17 | 10,948 | -3.70 | ||||
| 2025-08-12 | 13F | Soundwatch Capital LLC | 4,850 | 2,236 | ||||||
| 2025-07-18 | 13F | PBMares Wealth Management LLC | 8,713 | 236 | ||||||
| 2025-08-14 | 13F | SWAN Capital LLC | 0 | -100.00 | 0 | |||||
| 2025-08-14 | 13F | Fort Point Capital Partners LLC | 31,505 | -63.42 | 852 | -64.02 | ||||
| 2025-07-22 | 13F | Merit Financial Group, LLC | 7,562 | -1.20 | 204 | -2.86 | ||||
| 2025-08-08 | 13F | Hartland & Co., LLC | 302 | 0.00 | 8 | 0.00 | ||||
| 2025-08-04 | 13F | Spire Wealth Management | 0 | -100.00 | 0 | |||||
| 2025-08-05 | 13F | Bank of New York Mellon Corp | 10,508 | -79.66 | 284 | -79.99 | ||||
| 2025-08-13 | 13F | Colonial Trust Advisors | 6,016 | 3.33 | 163 | 1.89 | ||||
| 2025-07-15 | 13F | Lynch & Associates/in | 11,972 | -1.44 | 324 | -3.00 | ||||
| 2025-07-11 | 13F | Farther Finance Advisors, LLC | 41,427 | 2.92 | 1,120 | 1.27 | ||||
| 2025-08-12 | 13F | SRS Capital Advisors, Inc. | 72 | 2 | ||||||
| 2025-08-01 | 13F | Vision Financial Markets Llc | 212 | 0.95 | 6 | 0.00 | ||||
| 2025-07-23 | 13F | Heck Capital Advisors, LLC | 233,877 | 11.87 | 6,324 | 10.12 | ||||
| 2025-05-05 | 13F | Kestra Private Wealth Services, Llc | 0 | -100.00 | 0 | |||||
| 2025-04-23 | 13F | PMV Capital Advisers, LLC | 0 | -100.00 | 0 | |||||
| 2025-08-14 | 13F | Smartleaf Asset Management LLC | 4,202 | -13.36 | 113 | -14.50 | ||||
| 2025-08-18 | 13F/A | National Bank Of Canada /fi/ | 1,795 | 0.00 | 49 | -2.04 | ||||
| 2025-08-12 | 13F | Asset Management Group, Inc. | 64,620 | -0.88 | 1,747 | -2.40 | ||||
| 2025-08-14 | 13F | Bank Of America Corp /de/ | 41,932 | 48.34 | 1,134 | 46.01 | ||||
| 2025-08-11 | 13F | HighTower Advisors, LLC | 145,296 | 0.59 | 3,929 | -0.98 | ||||
| 2025-08-12 | 13F | MAI Capital Management | 380,222 | 12.69 | 10,281 | 10.93 | ||||
| 2025-08-15 | 13F | Morgan Stanley | 153,683 | -2.74 | 4,156 | -4.26 | ||||
| 2025-07-24 | 13F | Us Bancorp \de\ | 4,200 | 0.00 | 114 | -1.74 | ||||
| 2025-08-14 | 13F | Financial Engines Advisors L.L.C. | 122,161 | -5.89 | 3,303 | -7.38 | ||||
| 2025-08-12 | 13F | J.w. Cole Advisors, Inc. | 38,682 | 21.46 | 1,046 | 19.57 | ||||
| 2025-08-12 | 13F | Franklin Resources Inc | 0 | -100.00 | 0 | |||||
| 2025-08-25 | 13F/A | Promus Capital, LLC | 150 | 0.00 | 4 | 0.00 | ||||
| 2025-05-02 | 13F | MB Generational Wealth, LLC | 7,396 | 203 | ||||||
| 2025-08-07 | 13F | BOK Financial Private Wealth, Inc. | 1,664 | 0.00 | 45 | -2.22 | ||||
| 2025-07-10 | 13F | HF Advisory Group, LLC | 43,202 | -3.64 | 1,168 | -5.12 | ||||
| 2025-08-14 | 13F | Modern Wealth Management, LLC | 23,578 | 9.13 | 638 | 7.42 | ||||
| 2025-08-08 | 13F | Independence Financial Advisors, LLC | 11,336 | 0.04 | 307 | -1.61 | ||||
| 2025-08-15 | 13F | Keel Point, LLC | 14,431 | -15.62 | 390 | -16.84 | ||||
| 2025-08-14 | 13F | Glen Eagle Advisors, LLC | 347 | 0.00 | 9 | 0.00 | ||||
| 2025-08-04 | 13F | Assetmark, Inc | 146 | 4 | ||||||
| 2025-08-06 | 13F | Decker Retirement Planning Inc. | 638 | 0.00 | 17 | 0.00 | ||||
| 2025-08-06 | 13F | Aspect Partners, LLC | 4,201 | 0.00 | 114 | -1.74 | ||||
| 2025-07-08 | 13F | First National Corp /ma/ /adv | 61,836 | -0.73 | 1,672 | -2.28 | ||||
| 2025-07-23 | 13F | Sachetta, LLC | 68,662 | 0.05 | 1,857 | -1.54 | ||||
| 2025-07-30 | 13F | Rehmann Capital Advisory Group | 198,454 | 1.56 | 5,366 | -0.02 | ||||
| 2025-08-04 | 13F | Roble, Belko & Company, Inc | 26 | 0.00 | 0 | |||||
| 2025-07-24 | 13F | Ronald Blue Trust, Inc. | 8,666 | -33.43 | 234 | -34.45 | ||||
| 2025-08-12 | 13F | PKS Advisory Services, LLC | 34,687 | -0.34 | 938 | -1.99 | ||||
| 2025-07-31 | 13F | Forte Asset Management Llc | 0 | -100.00 | 0 | |||||
| 2025-08-14 | 13F | Integrated Investment Consultants, LLC | 31,000 | 0.00 | 838 | -1.53 | ||||
| 2025-08-15 | 13F | CI Private Wealth, LLC | 9,551 | 258 | ||||||
| 2025-08-14 | 13F | Ancora Advisors, LLC | 5,597 | 0.00 | 151 | -1.31 | ||||
| 2025-07-15 | 13F | BCS Wealth Management | 7,578 | -39.83 | 0 | |||||
| 2025-08-07 | 13F | Addison Advisors LLC | 281 | 0.00 | 8 | 0.00 | ||||
| 2025-07-31 | 13F | Briaud Financial Planning, Inc | 439 | 0 | ||||||
| 2025-08-14 | 13F | Ausdal Financial Partners, Inc. | 14,385 | -11.61 | 389 | -13.20 | ||||
| 2025-08-13 | 13F | Johnson Financial Group, Inc. | 600 | 0.00 | 16 | 0.00 | ||||
| 2025-08-14 | 13F | Investmark Advisory Group LLC | 19,127 | -0.86 | 517 | -2.27 | ||||
| 2025-08-13 | 13F | Northwestern Mutual Wealth Management Co | 416,893 | 1.42 | 11,273 | -0.18 | ||||
| 2025-08-01 | 13F | Brinker Capital Investments, LLC | 0 | -100.00 | 0 | |||||
| 2025-08-01 | 13F | American Financial & Tax Strategies Inc | 189,228 | 1.53 | 5,117 | -0.06 | ||||
| 2025-08-06 | 13F | Atlantic Union Bankshares Corp | 1,000 | 27 | ||||||
| 2025-05-14 | 13F | CIBC Private Wealth Group, LLC | 0 | -100.00 | 0 | |||||
| 2025-07-07 | 13F | Versant Capital Management, Inc | 500 | 0.00 | 14 | 0.00 | ||||
| 2025-07-18 | 13F | SOA Wealth Advisors, LLC. | 50 | 19.05 | 1 | 0.00 | ||||
| 2025-07-30 | 13F | Crewe Advisors LLC | 550 | -4.51 | 15 | -6.67 | ||||
| 2025-05-12 | 13F | Sandy Spring Bank | 1,000 | 0.00 | 27 | 0.00 | ||||
| 2025-08-05 | 13F | Huntington National Bank | 9 | 0.00 | ||||||
| 2025-08-14 | 13F | Comerica Bank | 1,139 | 0.00 | 31 | -3.23 | ||||
| 2025-07-25 | 13F | Cwm, Llc | 9,844 | 21.07 | 0 | |||||
| 2025-08-13 | 13F | Lido Advisors, LLC | 1,221,408 | 5.90 | 33,027 | 4.25 | ||||
| 2025-07-14 | 13F | Park Avenue Securities Llc | 8,129 | -78.43 | 0 | -100.00 | ||||
| 2025-08-07 | 13F | Birchcreek Wealth Management, LLC | 44,311 | 7.56 | 1,198 | 5.92 | ||||
| 2025-08-14 | 13F | Royal Bank Of Canada | 95,170 | 14.80 | 2,573 | 13.00 | ||||
| 2025-07-22 | 13F | Marks Group Wealth Management, Inc | 61,478 | 0.00 | 1,662 | -1.54 | ||||
| 2025-08-14 | 13F | Mariner, LLC | 43,183 | -2.12 | 1,168 | -3.63 | ||||
| 2025-07-30 | 13F | Princeton Global Asset Management LLC | 70 | -52.05 | 2 | -75.00 | ||||
| 2025-08-04 | 13F | Creative Financial Designs Inc /adv | 994 | 0.00 | 27 | -3.70 | ||||
| 2025-08-08 | 13F | Creative Planning | 229,082 | -8.03 | 6,194 | -9.46 | ||||
| 2025-08-06 | 13F | Stone House Investment Management, LLC | 1,680 | -72.76 | 45 | -73.37 | ||||
| 2025-07-28 | 13F | Rik Saylor Financial, Inc. | 15,389 | -3.15 | 416 | -4.59 | ||||
| 2025-08-11 | 13F | Brown Brothers Harriman & Co | 2,384 | 0.00 | 64 | -1.54 | ||||
| 2025-07-23 | 13F | Venturi Wealth Management, LLC | 13,066 | -4.18 | 353 | -5.61 | ||||
| 2025-08-08 | 13F | Glassman Wealth Services | 114 | 0.88 | 3 | 0.00 | ||||
| 2025-07-17 | 13F | Sound Income Strategies, LLC | 53 | 0.00 | 1 | 0.00 | ||||
| 2025-07-14 | 13F | AdvisorNet Financial, Inc | 1,264 | -11.98 | 34 | -12.82 | ||||
| 2025-07-31 | 13F | CNB Bank | 330 | 0.00 | 9 | -11.11 | ||||
| 2025-08-13 | 13F | Congress Wealth Management LLC / DE / | 72,388 | 19.94 | 1,957 | 18.11 | ||||
| 2025-07-15 | 13F | Fortitude Family Office, LLC | 0 | -100.00 | 0 | |||||
| 2025-07-02 | 13F | Marotta Asset Management | 167,493 | 18.38 | 4,529 | 8.61 | ||||
| 2025-08-14 | 13F | Aqr Capital Management Llc | 7,684 | 0.00 | 208 | -1.90 | ||||
| 2025-07-18 | 13F | SigFig Wealth Management, LLC | 105,737 | -2.87 | 2,842 | -4.02 | ||||
| 2025-07-15 | 13F | Elevated Capital Advisors, LLC | 23,249 | 0.00 | 639 | 0.00 | ||||
| 2025-07-28 | 13F | RFG Advisory, LLC | 137,030 | 0.96 | 3,705 | -0.62 | ||||
| 2025-08-13 | 13F | Summit Financial, LLC | 8,044 | 218 | ||||||
| 2025-07-17 | 13F | Smith, Salley & Associates | 16,633 | 0.39 | 450 | -1.32 | ||||
| 2025-05-13 | 13F | Prime Capital Investment Advisors, LLC | 0 | -100.00 | 0 | |||||
| 2025-08-14 | 13F | Diversify Advisory Services, LLC | 50,011 | 26.81 | 1,351 | 28.45 | ||||
| 2025-07-09 | 13F | Dynamic Advisor Solutions LLC | 240,990 | 2.73 | 6,516 | 1.12 | ||||
| 2025-07-31 | 13F | Schoolcraft Capital LLC | 91,428 | -20.15 | 2,472 | -21.40 | ||||
| 2025-07-30 | 13F | Fingerlakes Wealth Management, Inc. | 16,972 | 11.65 | 459 | 9.83 | ||||
| 2025-08-13 | 13F | Russell Investments Group, Ltd. | 17 | 0 | ||||||
| 2025-08-12 | 13F | Coston, McIsaac & Partners | 413 | 0.98 | 0 | |||||
| 2025-07-16 | 13F/A | CX Institutional | 406 | -7.73 | 0 | |||||
| 2025-07-30 | 13F | Cullen/frost Bankers, Inc. | 593 | -74.27 | 16 | -74.60 | ||||
| 2025-07-24 | 13F | Grand Wealth Management, Llc | 7,731 | 209 | ||||||
| 2025-07-16 | 13F | Beaumont Financial Advisors, LLC | 63,141 | 2.79 | 1,707 | 1.19 | ||||
| 2025-08-12 | 13F | Marshall & Sterling Wealth Advisors Inc. | 100 | 1.01 | 3 | 0.00 | ||||
| 2025-08-12 | 13F | LPL Financial LLC | 387,771 | 8.48 | 10,485 | 6.78 | ||||
| 2025-07-25 | 13F | Riverpoint Wealth Management Holdings, LLC | 467,376 | 3.85 | 12,638 | 2.22 | ||||
| 2025-08-14 | 13F | Snowden Capital Advisors LLC | 0 | -100.00 | 0 | -100.00 | ||||
| 2025-08-11 | 13F | Principal Securities, Inc. | 6,791 | 9.41 | 184 | 9.58 | ||||
| 2025-08-06 | 13F | AE Wealth Management LLC | 1,037,875 | 1.15 | 28,064 | -0.43 | ||||
| 2025-07-14 | 13F | UMA Financial Services, Inc. | 175,488 | -4.69 | 4,745 | -6.19 | ||||
| 2025-07-29 | 13F | Disciplined Investments, LLC | 10,399 | 0.00 | 281 | -1.40 | ||||
| 2025-07-31 | 13F | Glass Jacobson Investment Advisors llc | 38,756 | 2.38 | 1,048 | 2.45 | ||||
| 2025-08-11 | 13F | Citigroup Inc | 16,969 | -3.26 | 459 | -4.78 | ||||
| 2025-08-06 | 13F | Commonwealth Equity Services, Llc | 515,523 | -11.07 | 14 | -13.33 | ||||
| 2025-08-13 | 13F | Northern Trust Corp | 15,703 | -30.23 | 425 | -31.39 | ||||
| 2025-08-14 | 13F | Ameriprise Financial Inc | 59,639 | 15.05 | 1,550 | 8.85 | ||||
| 2025-08-14 | 13F | Colony Group, LLC | 8,033 | -27.08 | 217 | -28.15 |