Mga Batayang Estadistika
| Saham Institusional (Jangka Panjang) | 29,921,997 - 88.26% (ex 13D/G) - change of 2.95MM shares 10.92% MRQ |
| Nilai Institusional (Jangka Panjang) | $ 1,391,857 USD ($1000) |
Kepemilikan Institusional dan Pemegang Saham
Global Partners LP - Limited Partnership (US:GLP) memiliki 132 pemilik institusional dan pemegang saham yang telah mengajukan formulir 13D/G atau 13F kepada Komisi Bursa Efek (Securities Exchange Commission/SEC). Lembaga-lembaga ini memegang total 29,921,997 saham. Pemegang saham terbesar meliputi AMLP - ALERIAN MLP ETF, Alps Advisors Inc, Kingstone Capital Partners Texas, LLC, Invesco Ltd., MIRAE ASSET GLOBAL ETFS HOLDINGS Ltd., Pallas Capital Advisors LLC, MLPA - Global X MLP ETF, MLPRX - Invesco Oppenheimer SteelPath MLP Income Fund Class C, MLPEX - Invesco Oppenheimer SteelPath MLP Select 40 Fund Class C, and Goldman Sachs Group Inc .
Struktur kepemilikan institusional Global Partners LP - Limited Partnership (NYSE:GLP) menunjukkan posisi terkini di perusahaan oleh institusi dan dana, serta perubahan terbaru dalam ukuran posisi. Pemegang saham utama dapat mencakup investor individu, reksa dana, dana lindung nilai, atau institusi. Jadwal 13D menunjukkan bahwa investor memegang (atau pernah memegang) lebih dari 5% saham perusahaan dan bermaksud (atau pernah bermaksud) untuk secara aktif mengejar perubahan strategi bisnis. Jadwal 13G menunjukkan investasi pasif lebih dari 5%.
The share price as of September 5, 2025 is 51.47 / share. Previously, on September 6, 2024, the share price was 42.26 / share. This represents an increase of 21.79% over that period.

Skor Sentimen Dana
Skor Sentimen Dana (sebelumnya dikenal sebagai Skor Akumulasi Kepemilikan) menemukan saham-saham yang paling banyak dibeli oleh dana. Ini adalah hasil dari model kuantitatif multi-faktor yang canggih yang mengidentifikasi perusahaan dengan tingkat akumulasi institusional tertinggi. Model penilaian menggunakan kombinasi dari total peningkatan pemilik yang diungkapkan, perubahan dalam alokasi portofolio pada pemilik tersebut, dan metrik lainnya. Angka berkisar dari 0 hingga 100, dengan angka yang lebih tinggi menunjukkan tingkat akumulasi yang lebih tinggi dibandingkan dengan perusahaan sejenisnya, dan 50 adalah rata-ratanya.
Frekuensi Pembaruan: Setiap Hari
Lihat Ownership Explorer, yang menyediakan daftar perusahaan dengan peringkat tertinggi.
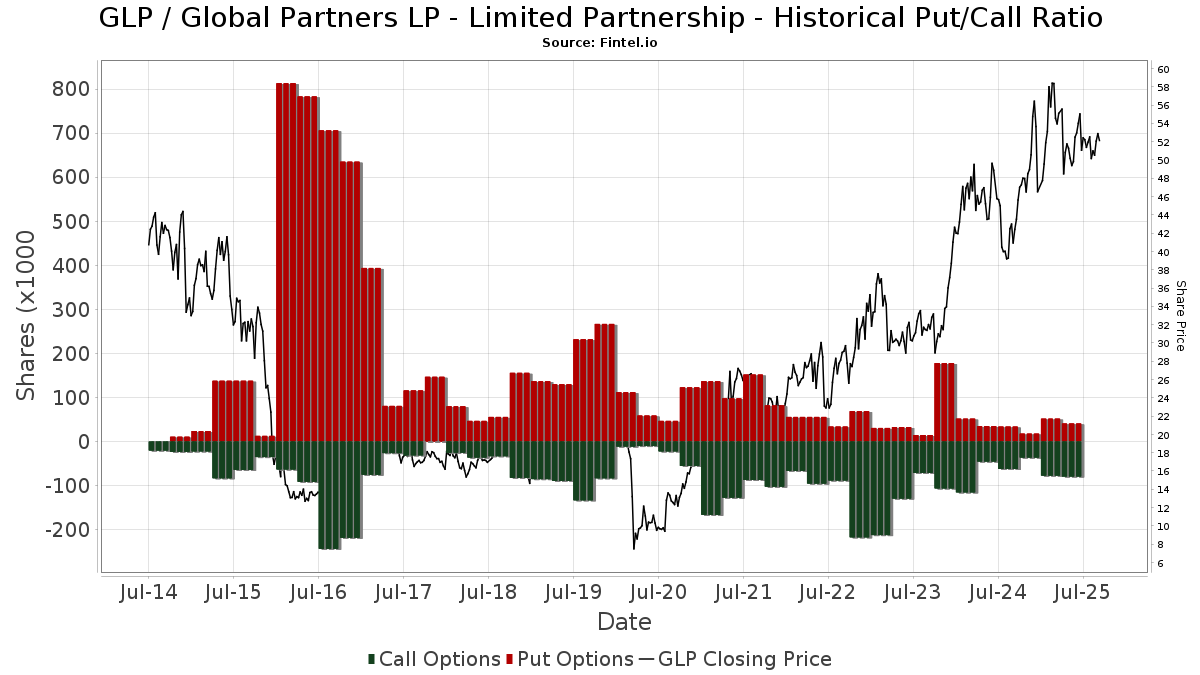
Rasio Put/Call Institusional
Selain melaporkan isu ekuitas dan utang standar, institusi dengan aset di bawah manajemen lebih dari 100 juta dolar AS juga harus mengungkapkan kepemilikan opsi put dan call mereka. Karena opsi put umumnya menunjukkan sentimen negatif, dan opsi call menunjukkan sentimen positif, kita dapat mengetahui sentimen institusional secara keseluruhan dengan memplot rasio put terhadap call. Grafik di sebelah kanan memplot rasio put/call historis untuk instrumen ini.
Menggunakan Rasio Put/Call sebagai indikator sentimen investor mengatasi salah satu kekurangan utama dari penggunaan total kepemilikan institusional, yaitu sejumlah besar aset yang dikelola diinvestasikan secara pasif untuk melacak indeks. Dana yang dikelola secara pasif biasanya tidak membeli opsi, sehingga indikator rasio put/call lebih akurat dalam melacak sentimen dana yang dikelola secara aktif.
Pengajuan 13D/G
Kami menyajikan pengajuan 13D/G secara terpisah dari pengajuan 13F karena perlakuan yang berbeda oleh SEC. Pengajuan 13D/G dapat diajukan oleh kelompok investor (dengan satu pemimpin), sedangkan pengajuan 13F tidak bisa. Hal ini mengakibatkan situasi di mana seorang investor dapat mengajukan 13D/G yang melaporkan satu nilai untuk total saham (mewakili semua saham yang dimiliki oleh kelompok investor), tetapi kemudian mengajukan 13F yang melaporkan nilai yang berbeda untuk total saham (mewakili kepemilikan mereka sendiri). Ini berarti bahwa kepemilikan saham dari pengajuan 13D/G dan pengajuan 13F seringkali tidak dapat dibandingkan secara langsung, sehingga kami menyajikannya secara terpisah.
Catatan: Mulai 16 Mei 2021, kami tidak lagi menampilkan pemilik yang belum mengajukan 13D/G dalam setahun terakhir. Sebelumnya, kami menampilkan riwayat lengkap pengajuan 13D/G. Secara umum, entitas yang diwajibkan untuk mengajukan pengajuan 13D/G harus mengajukan setidaknya setiap tahun sebelum mengirimkan pengajuan penutupan. Namun, terkadang dana keluar dari posisi tanpa mengirimkan pengajuan penutupan (misalnya, mereka menghentikan operasi), sehingga menampilkan riwayat lengkap terkadang menyebabkan kebingungan tentang kepemilikan saat ini. Untuk mencegah kebingungan, kami sekarang hanya menampilkan pemilik 'saat ini' - yaitu - pemilik yang telah mengajukan dalam setahun terakhir.
Upgrade to unlock premium data.
| Tanggal File | Formulir | Investor | Sebelumnya Saham |
Terbaru Saham |
Δ Saham (Persen) |
Kepemilikan (Persen) |
Δ Pagmamay-ari (Persen) |
|
|---|---|---|---|---|---|---|---|---|
| 2025-08-07 | Eric Slifka | 3,720,872 | 10.90 | |||||
| 2025-07-09 | ALPS ADVISORS INC | 5,584,745 | 5,446,063 | -2.48 | 16.02 | -2.50 | ||
| 2025-05-15 | Global X Management CO LLC | 1,849,454 | 5.45 | |||||
| 2024-11-06 | Invesco Ltd. | 3,164,640 | 2,567,443 | -18.87 | 7.60 | -18.28 |
Pengajuan 13F dan NPORT
Detail pada pengajuan 13F tersedia gratis. Detail pada pengajuan NP memerlukan keanggotaan premium. Baris berwarna hijau menunjukkan posisi baru. Baris berwarna merah menunjukkan posisi yang sudah ditutup. Klik tautan ini ikon untuk melihat riwayat transaksi selengkapnya.
Tingkatkan
untuk membuka data premium dan mengekspor ke Excel ![]() .
.
| Tanggal File | Sumber | Investor | Ketik | Presyo ng Avg (Silangan) |
Saham | Δ Saham (%) |
Dilaporkan Nilai ($1000) |
Nilai Δ (%) |
Alokasi Port (%) |
|
|---|---|---|---|---|---|---|---|---|---|---|
| 2025-05-08 | 13F | XTX Topco Ltd | 0 | -100.00 | 0 | |||||
| 2025-08-12 | 13F | DiMeo Schneider & Associates, L.L.C. | 8,177 | 0.00 | 431 | -1.15 | ||||
| 2025-08-13 | 13F | Natixis | 116,800 | -16.15 | 6,159 | -19.07 | ||||
| 2025-08-14 | 13F | Fiduciary Trust Co | 3,920 | 0.00 | 207 | -1.44 | ||||
| 2025-08-13 | 13F | Invesco Ltd. | 2,560,457 | 0.08 | 135,013 | -1.14 | ||||
| 2025-08-12 | 13F | Virtu Financial LLC | 6,533 | 0 | ||||||
| 2025-08-14 | 13F | Goldman Sachs Group Inc | 522,495 | 18.64 | 27,551 | 17.20 | ||||
| 2025-08-04 | 13F | Spire Wealth Management | 500 | 0.00 | 26 | 0.00 | ||||
| 2025-04-02 | 13F | Marcum Wealth, LLC | 6,664 | 356 | ||||||
| 2025-08-11 | 13F | Alps Advisors Inc | 5,446,063 | -2.48 | 287,171 | -3.67 | ||||
| 2025-08-11 | 13F | TD Waterhouse Canada Inc. | 64 | 3 | ||||||
| 2025-08-13 | 13F | First Trust Advisors Lp | 53,450 | -23.87 | 2,818 | -24.79 | ||||
| 2025-08-08 | 13F | Creative Planning | 15,013 | 0.17 | 792 | -1.12 | ||||
| 2025-08-12 | 13F | Twin Focus Capital Partners, Llc | 22,000 | 0.00 | 1,160 | -1.19 | ||||
| 2025-07-24 | 13F | Baldwin Brothers Inc/ma | 17,000 | 0.00 | 896 | -1.21 | ||||
| 2025-07-09 | 13F | Pallas Capital Advisors LLC | 1,627,973 | 1.63 | 85,843 | 0.39 | ||||
| 2025-08-13 | 13F | Transce3nd, LLC | 0 | -100.00 | 0 | |||||
| 2025-07-07 | 13F | Fractal Investments LLC | 195,234 | 0.00 | 10,295 | -1.22 | ||||
| 2025-08-12 | 13F | Jpmorgan Chase & Co | 333,973 | 36.98 | 17,610 | 35.32 | ||||
| 2025-07-14 | 13F | Armstrong Advisory Group, Inc | 537 | 0.00 | 28 | 16.67 | ||||
| 2025-06-25 | NP | AMZA - InfraCap MLP ETF | 144,539 | 1.32 | 7,412 | -4.10 | ||||
| 2025-08-15 | 13F | Morgan Stanley | 408,174 | 0.01 | 21,523 | -1.20 | ||||
| 2025-08-06 | 13F | Atlantic Union Bankshares Corp | 81 | 4 | ||||||
| 2025-07-31 | 13F | Cambridge Investment Research Advisors, Inc. | 31,470 | 0.77 | 2 | 0.00 | ||||
| 2025-08-14 | 13F | Royal Bank Of Canada | 218,393 | -11.01 | 11,516 | -12.09 | ||||
| 2025-07-28 | 13F | Private Wealth Asset Management, LLC | 0 | -100.00 | 0 | |||||
| 2025-04-21 | 13F | Ronald Blue Trust, Inc. | 0 | -100.00 | 0 | -100.00 | ||||
| 2025-08-14 | 13F | Bramshill Investments, LLC | 22,150 | 62.78 | 1,168 | 60.74 | ||||
| 2025-08-11 | 13F | Traub Capital Management LLC | 3,645 | 192 | ||||||
| 2025-07-09 | 13F | Silverberg Bernstein Capital Management LLC | 4,150 | 0.00 | 219 | -1.36 | ||||
| 2025-08-15 | 13F | Tower Research Capital LLC (TRC) | 0 | -100.00 | 0 | |||||
| 2025-05-13 | 13F | Lee Financial Co | 0 | -100.00 | 0 | |||||
| 2025-07-24 | 13F | Stonebridge Financial Group, LLC | 0 | -100.00 | 0 | |||||
| 2025-08-05 | 13F | Simplex Trading, Llc | 0 | -100.00 | 0 | |||||
| 2025-05-12 | 13F | Operose Advisors LLC | 0 | -100.00 | 0 | |||||
| 2025-05-16 | 13F | Resources Management Corp /ct/ /adv | 0 | -100.00 | 0 | |||||
| 2025-07-24 | 13F | Leo Wealth, LLC | 14,500 | 45.00 | 765 | 43.34 | ||||
| 2025-08-14 | 13F | Fmr Llc | 0 | -100.00 | 0 | |||||
| 2025-08-13 | 13F | Brown Advisory Inc | 6,000 | 0.00 | 316 | -1.25 | ||||
| 2025-07-21 | 13F | Ameritas Advisory Services, LLC | 122 | 6 | ||||||
| 2025-08-04 | 13F | Spinnaker Trust | 4,550 | 2.25 | 240 | 0.84 | ||||
| 2025-07-10 | 13F | Wealth Enhancement Advisory Services, Llc | 7,748 | 408 | ||||||
| 2025-08-13 | 13F | Hartree Partners, LP | 508,080 | 0.00 | 26,791 | -1.22 | ||||
| 2025-08-19 | 13F | National Asset Management, Inc. | 0 | -100.00 | 0 | |||||
| 2025-08-11 | 13F | Pin Oak Investment Advisors Inc | 420 | 0.00 | 0 | |||||
| 2025-06-27 | NP | DIV - Global X SuperDividend U.S. ETF This fund is a listed as child fund of Mirae Asset Global Investments Co., Ltd. and if that institution has disclosed ownership in this security, then these positions will not be double counted when calculating total shares and total value | 226,234 | -14.21 | 11,601 | -18.80 | ||||
| 2025-08-12 | 13F | MAI Capital Management | 507 | 0.00 | 27 | -3.70 | ||||
| 2025-08-11 | 13F | HighTower Advisors, LLC | 15,632 | 3.22 | 824 | 1.98 | ||||
| 2025-08-12 | 13F | Park Square Financial Group, LLC | 76 | 0.00 | 4 | 0.00 | ||||
| 2025-08-14 | 13F | Blackstone Group Inc | 162,104 | 6.57 | 8,548 | 5.27 | ||||
| 2025-08-06 | 13F | Mark Sheptoff Financial Planning, Llc | 200 | 0.00 | 11 | 0.00 | ||||
| 2025-08-06 | 13F | Commonwealth Equity Services, Llc | 22,258 | -3.84 | 1 | 0.00 | ||||
| 2025-08-06 | 13F | First Horizon Advisors, Inc. | 2,500 | -44.44 | 132 | -45.42 | ||||
| 2025-08-28 | NP | Amplify ETF Trust - Amplify Natural Resources Dividend Income ETF | 1,966 | -59.11 | 104 | -59.77 | ||||
| 2025-07-17 | 13F | G&S Capital LLC | 5,982 | 0.00 | 315 | -1.25 | ||||
| 2025-07-29 | 13F | Albert D Mason Inc | 3,968 | -2.39 | 209 | -3.24 | ||||
| 2025-08-11 | 13F | Inspire Advisors, LLC | 4,088 | 0.91 | 216 | -0.46 | ||||
| 2025-08-12 | 13F | BlackRock, Inc. | 100 | 0.00 | 5 | 0.00 | ||||
| 2025-08-14 | 13F | Stifel Financial Corp | 34,757 | 81.21 | 1,833 | 79.08 | ||||
| 2025-08-14 | 13F | Hrt Financial Lp | 22,620 | 1 | ||||||
| 2025-05-14 | 13F | Northwestern Mutual Wealth Management Co | 0 | -100.00 | 0 | |||||
| 2025-08-14 | 13F | Warren Averett Asset Management, LLC | 79,794 | 1.50 | 4,208 | 0.26 | ||||
| 2025-08-14 | 13F | Bank Of America Corp /de/ | 137,822 | 0.90 | 7,267 | -0.33 | ||||
| 2025-07-30 | NP | MLPA - Global X MLP ETF This fund is a listed as child fund of Mirae Asset Global Investments Co., Ltd. and if that institution has disclosed ownership in this security, then these positions will not be double counted when calculating total shares and total value | 1,611,179 | -0.26 | 84,619 | -8.78 | ||||
| 2025-08-14 | 13F | UBS Group AG | 185,705 | -23.03 | 9,792 | -23.96 | ||||
| 2025-08-08 | 13F | Kingsview Wealth Management, LLC | 18,000 | 0.00 | 949 | -1.15 | ||||
| 2025-08-11 | 13F | United Capital Financial Advisers, Llc | 15,896 | 1.49 | 838 | 0.24 | ||||
| 2025-05-09 | 13F | Pnc Financial Services Group, Inc. | 0 | -100.00 | 0 | |||||
| 2025-06-17 | NP | GSRAX - Goldman Sachs Rising Dividend Growth Fund Class A | 14,762 | -11.58 | 757 | -16.37 | ||||
| 2025-08-18 | 13F | Geneos Wealth Management Inc. | 4,245 | 89.09 | 224 | 87.39 | ||||
| 2025-08-14 | 13F | Tortoise Capital Advisors, L.l.c. | 24,362 | 0.00 | 1,285 | -1.23 | ||||
| 2025-07-30 | 13F | Sanders Morris Harris Llc | 16,500 | 0.00 | 870 | -1.14 | ||||
| 2025-08-12 | 13F | Proequities, Inc. | Put | 0 | 0 | |||||
| 2025-08-12 | 13F | Proequities, Inc. | Call | 0 | 0 | |||||
| 2025-07-09 | 13F | Gilman Hill Asset Management, LLC | 36,307 | 15.40 | 1,914 | 14.00 | ||||
| 2025-08-12 | 13F | Proequities, Inc. | 0 | 0 | ||||||
| 2025-07-31 | 13F/A | Avion Wealth | 500 | 0.00 | 0 | |||||
| 2025-08-13 | 13F | Cerity Partners LLC | 11,134 | 0.28 | 587 | -0.84 | ||||
| 2025-08-14 | 13F | Susquehanna Fundamental Investments, Llc | 4,014 | -24.62 | 212 | -25.70 | ||||
| 2025-08-05 | 13F | Mission Wealth Management, Lp | 13,402 | 0.00 | 707 | -1.26 | ||||
| 2025-07-18 | 13F | Founders Capital Management | 8 | 0.00 | 0 | |||||
| 2025-08-08 | 13F | Compass Wealth Management LLC | 0 | -100.00 | 0 | |||||
| 2025-07-24 | NP | FSDIX - Fidelity Strategic Dividend & Income Fund This fund is a listed as child fund of Fmr Llc and if that institution has disclosed ownership in this security, then these positions will not be double counted when calculating total shares and total value | 11,410 | 3.45 | 599 | -5.37 | ||||
| 2025-07-24 | 13F | Us Bancorp \de\ | 2,146 | 5.35 | 113 | 4.63 | ||||
| 2025-08-08 | 13F | Cetera Investment Advisers | 24,815 | 40.26 | 1,308 | 38.56 | ||||
| 2025-05-14 | 13F | Van Hulzen Asset Management, LLC | 0 | -100.00 | 0 | -100.00 | ||||
| 2025-07-29 | 13F | Stratos Wealth Advisors, LLC | 4,960 | 0.98 | 262 | -0.38 | ||||
| 2025-08-14 | 13F | Raymond James Financial Inc | 137,023 | -1.31 | 7,225 | -2.51 | ||||
| 2025-08-06 | 13F | Moors & Cabot, Inc. | 23,075 | 0.58 | 1,217 | -0.65 | ||||
| 2025-08-07 | 13F | American Financial Group Inc | 17,500 | 0.00 | 923 | -1.28 | ||||
| 2025-08-05 | 13F | Welch & Forbes Llc | 37,420 | 0.00 | 1,973 | -1.20 | ||||
| 2025-07-25 | 13F | Apollon Wealth Management, LLC | 10,829 | 0.00 | 571 | -1.21 | ||||
| 2025-07-11 | 13F | Farther Finance Advisors, LLC | 17,319 | 28,291.80 | 913 | 30,333.33 | ||||
| 2025-08-11 | 13F | HHM Wealth Advisors, LLC | 200 | 0.00 | 11 | 0.00 | ||||
| 2025-08-14 | 13F | Infrastructure Capital Advisors, Llc | 144,539 | -79.82 | 7,622 | -74.84 | ||||
| 2025-08-14 | 13F | Citadel Advisors Llc | Put | 14,100 | -11.32 | 743 | -12.38 | |||
| 2025-07-11 | 13F | Kingstone Capital Partners Texas, LLC | 3,389,395 | 108 | ||||||
| 2025-08-14 | 13F | Citadel Advisors Llc | Call | 34,200 | -16.59 | 1,803 | -17.60 | |||
| 2025-07-24 | 13F | Cascade Investment Group, Inc. | 47,365 | -1.35 | 2,498 | -2.58 | ||||
| 2025-07-25 | 13F | We Are One Seven, LLC | 4,303 | 227 | ||||||
| 2025-05-27 | NP | GAFCX - Virtus AlphaSimplex Global Alternatives Fund Class C | 0 | -100.00 | 0 | -100.00 | ||||
| 2025-08-12 | 13F | LPL Financial LLC | 7,641 | 10.63 | 403 | 9.24 | ||||
| 2025-07-17 | 13F | Vermillion Wealth Management, Inc. | 328 | 0.00 | 17 | 0.00 | ||||
| 2025-09-04 | 13F/A | Advisor Group Holdings, Inc. | 7,076 | -1.71 | 373 | -2.86 | ||||
| 2025-08-06 | 13F | Stone House Investment Management, LLC | 0 | -100.00 | 0 | |||||
| 2025-08-14 | 13F | Susquehanna International Group, Llp | Call | 0 | -100.00 | 0 | ||||
| 2025-08-14 | 13F | Group One Trading, L.p. | 0 | -100.00 | 0 | -100.00 | ||||
| 2025-08-29 | 13F | Evolution Wealth Management Inc. | 340 | 18 | ||||||
| 2025-08-14 | 13F | Jane Street Group, Llc | Call | 16,400 | 865 | |||||
| 2025-08-14 | 13F | MIRAE ASSET GLOBAL ETFS HOLDINGS Ltd. | 1,852,548 | 0.17 | 97,685 | -1.05 | ||||
| 2025-08-14 | 13F | Toroso Investments, LLC | 0 | -100.00 | 0 | |||||
| 2025-08-14 | 13F | Jane Street Group, Llc | 33,785 | 109.13 | 1,781 | 106.61 | ||||
| 2025-08-14 | 13F | Bbr Partners, Llc | 7,250 | 0.00 | 382 | -1.29 | ||||
| 2025-08-14 | 13F | Jane Street Group, Llc | Put | 3,900 | 206 | |||||
| 2025-08-14 | 13F | Connecticut Wealth Management, LLC | 4,325 | 0.00 | 228 | -0.87 | ||||
| 2025-08-12 | 13F | CIBC Private Wealth Group, LLC | 100 | 0.00 | 5 | 25.00 | ||||
| 2025-08-05 | 13F | Simplex Trading, Llc | Call | 10,300 | 63.49 | 1 | ||||
| 2025-08-05 | 13F | Huntington National Bank | 1 | 0.00 | 0 | |||||
| 2025-08-12 | 13F | Tradition Wealth Management, LLC | 5,500 | -21.43 | 290 | -22.25 | ||||
| 2025-07-08 | 13F/A | Adams Asset Advisors, LLC | 9,860 | 0.00 | 520 | -1.33 | ||||
| 2025-08-11 | 13F | NewEdge Wealth, LLC | 4,307 | -80.02 | 216 | -81.22 | ||||
| 2025-08-12 | 13F | Steward Partners Investment Advisory, Llc | 1,800 | 0.00 | 95 | -2.08 | ||||
| 2025-08-14 | 13F | Aster Capital Management (DIFC) Ltd | 0 | -100.00 | 0 | |||||
| 2025-08-13 | 13F | Nbw Capital Llc | 79,794 | 1.50 | 4,208 | 0.26 | ||||
| 2025-07-10 | 13F | Exchange Traded Concepts, Llc | 29,719 | -3.12 | 1,567 | -4.28 | ||||
| 2025-08-19 | 13F | State of Wyoming | 1,096 | -10.02 | 58 | -12.31 | ||||
| 2025-07-08 | 13F | Granite Bay Wealth Management, LLC | 5,000 | 0.00 | 0 | |||||
| 2025-07-29 | NP | Tortoise Capital Series Trust - TORTOISE NORTH AMERICAN PIPELINE FUND | 29,788 | 1,564 | ||||||
| 2025-08-11 | 13F/A | Kayne Anderson Capital Advisors Lp | 31,925 | -8.82 | 1,683 | -9.95 | ||||
| 2025-08-13 | 13F | Barclays Plc | 0 | -100.00 | 0 | |||||
| 2025-08-14 | 13F | GWM Advisors LLC | 200 | 0.00 | 11 | 0.00 | ||||
| 2025-08-14 | 13F | Colony Group, LLC | 22,047 | 0.28 | 1,163 | -0.94 | ||||
| 2025-08-18 | 13F | Wolverine Trading, Llc | Call | 9,000 | 473 | |||||
| 2025-08-14 | 13F | Susquehanna International Group, Llp | 13,351 | -69.05 | 704 | -69.46 | ||||
| 2025-08-14 | 13F | Bnp Paribas Arbitrage, Sa | 18,196 | -0.02 | 959 | -1.24 | ||||
| 2025-05-15 | 13F | Citadel Advisors Llc | 0 | -100.00 | 0 | -100.00 | ||||
| 2025-08-14 | 13F | Susquehanna International Group, Llp | Put | 23,100 | -24.51 | 1,218 | -25.41 | |||
| 2025-06-26 | NP | GYLD - Arrow Dow Jones Global Yield ETF | 2,507 | -15.96 | 129 | -20.50 | ||||
| 2025-07-21 | NP | GLPAX - Goldman Sachs MLP Energy Infrastructure Fund Class A Shares | 405,400 | -6.15 | 21,292 | -14.18 | ||||
| 2025-08-20 | NP | LSPAX - LoCorr Spectrum Income Fund Class A | 20,304 | 64.78 | 1,071 | 62.86 | ||||
| 2025-08-07 | 13F | Proficio Capital Partners LLC | 102,553 | -1.04 | 5,408 | -2.24 | ||||
| 2025-07-30 | NP | AMLP - ALERIAN MLP ETF | 5,686,006 | 4.38 | 298,629 | -4.55 | ||||
| 2025-08-11 | 13F | Citigroup Inc | 783 | -56.88 | 41 | -57.29 | ||||
| 2025-07-25 | 13F | Cwm, Llc | 200 | 0.00 | 0 | |||||
| 2025-06-30 | NP | CVY - Invesco Zacks Multi-Asset Income ETF This fund is a listed as child fund of Invesco Ltd. and if that institution has disclosed ownership in this security, then these positions will not be double counted when calculating total shares and total value | 11,085 | -18.38 | 568 | -22.72 | ||||
| 2025-08-14 | 13F | Group One Trading, L.p. | Put | 100 | 0.00 | 5 | 0.00 | |||
| 2025-08-14 | 13F | Group One Trading, L.p. | Call | 9,900 | -1.98 | 522 | -3.15 | |||
| 2025-07-29 | NP | MLPRX - Invesco Oppenheimer SteelPath MLP Income Fund Class C | 1,337,981 | 0.00 | 70,271 | -8.55 | ||||
| 2025-08-06 | 13F | Ing Groep Nv | 0 | -100.00 | 0 | |||||
| 2025-08-12 | 13F | Manchester Capital Management LLC | 1,063 | 1.53 | 56 | 1.82 | ||||
| 2025-08-15 | 13F | Kestra Advisory Services, LLC | 3,938 | -63.05 | 208 | -63.56 | ||||
| 2025-05-12 | 13F | Sandy Spring Bank | 155 | 1.31 | 8 | 14.29 | ||||
| 2025-08-14 | 13F | Boston Private Wealth Llc | 0 | -100.00 | 0 | |||||
| 2025-08-27 | NP | Mason Capital Fund Trust - Fundamentals First ETF | 1,200 | 0.00 | 63 | -1.56 | ||||
| 2025-08-08 | 13F | Avantax Advisory Services, Inc. | 27,831 | 2.68 | 1,468 | 1.45 | ||||
| 2025-08-14 | 13F | Wells Fargo & Company/mn | 52,486 | -17.42 | 2,768 | -18.43 | ||||
| 2025-08-13 | 13F | Jones Financial Companies Lllp | 582 | 140.50 | 31 | 130.77 | ||||
| 2025-08-14 | 13F | Federation des caisses Desjardins du Quebec | 10 | 0.00 | 1 | |||||
| 2025-08-05 | 13F | Simplex Trading, Llc | Put | 0 | -100.00 | 0 | ||||
| 2025-08-07 | 13F | Runnymede Capital Advisors, Inc. | 0 | -100.00 | 0 | |||||
| 2025-04-14 | NP | TPYP - Tortoise North American Pipeline Fund | 33,269 | 2.69 | 1,911 | 4.49 | ||||
| 2025-08-14 | 13F/A | Rockefeller Capital Management L.P. | 10,647 | -13.97 | 561 | -15.00 | ||||
| 2025-07-29 | NP | MLPEX - Invesco Oppenheimer SteelPath MLP Select 40 Fund Class C | 1,209,219 | 0.00 | 63,508 | -8.55 | ||||
| 2025-08-25 | NP | TMVAX - RBC Microcap Value Fund A Shares | 2,500 | -50.00 | 132 | -50.75 | ||||
| 2025-08-26 | NP | MDIV - Multi-Asset Diversified Income Index Fund This fund is a listed as child fund of First Trust Advisors Lp and if that institution has disclosed ownership in this security, then these positions will not be double counted when calculating total shares and total value | 53,450 | -23.87 | 2,818 | -24.79 | ||||
| 2025-07-15 | 13F | Wealth Effects Llc | 9,000 | 0.00 | 475 | -1.25 |