Mga Batayang Estadistika
| Pemilik Institusional | 290 total, 290 long only, 0 short only, 0 long/short - change of 8.58% MRQ |
| Alokasi Portofolio Rata-rata | 0.3097 % - change of 3.42% MRQ |
| Saham Institusional (Jangka Panjang) | 60,741,541 (ex 13D/G) - change of 2.59MM shares 4.45% MRQ |
| Nilai Institusional (Jangka Panjang) | $ 1,968,395 USD ($1000) |
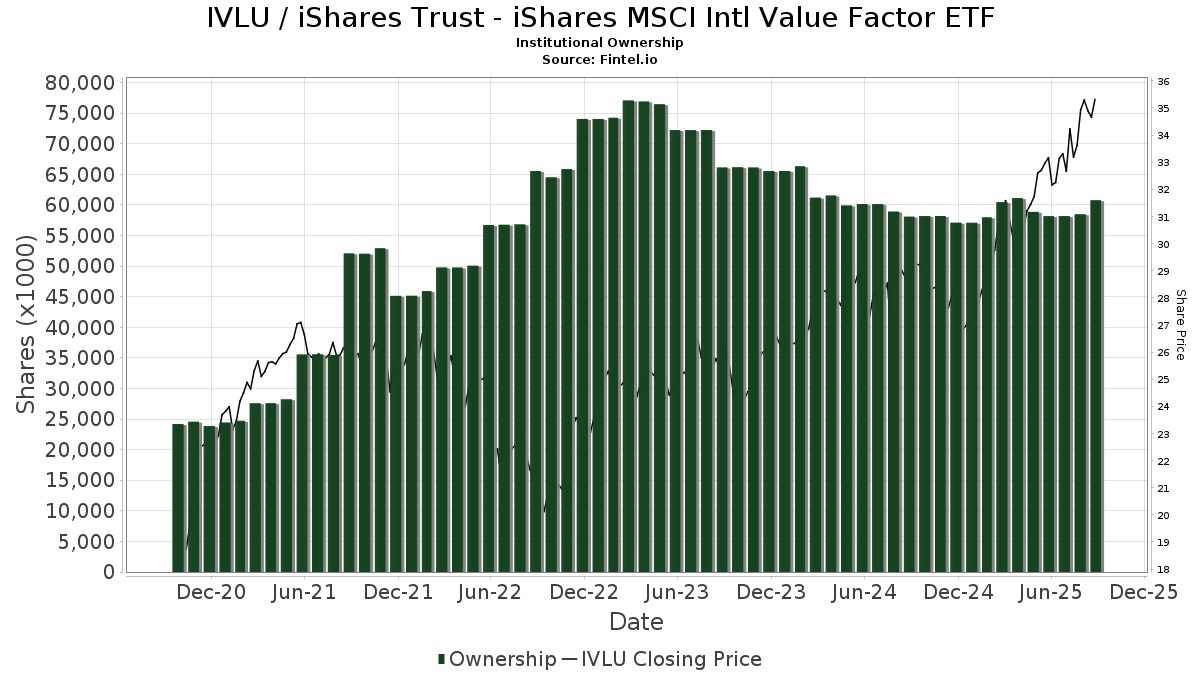
Kepemilikan Institusional dan Pemegang Saham
iShares Trust - iShares MSCI Intl Value Factor ETF (US:IVLU) memiliki 290 pemilik institusional dan pemegang saham yang telah mengajukan formulir 13D/G atau 13F kepada Komisi Bursa Efek (Securities Exchange Commission/SEC). Lembaga-lembaga ini memegang total 60,741,541 saham. Pemegang saham terbesar meliputi Northwestern Mutual Wealth Management Co, Fmr Llc, Jpmorgan Chase & Co, Envestnet Asset Management Inc, Mercer Global Advisors Inc /adv, Colony Group, LLC, Bank Of America Corp /de/, Kathmere Capital Management, LLC, Morgan Stanley, and Armbruster Capital Management, Inc. .
Struktur kepemilikan institusional iShares Trust - iShares MSCI Intl Value Factor ETF (ARCA:IVLU) menunjukkan posisi terkini di perusahaan oleh institusi dan dana, serta perubahan terbaru dalam ukuran posisi. Pemegang saham utama dapat mencakup investor individu, reksa dana, dana lindung nilai, atau institusi. Jadwal 13D menunjukkan bahwa investor memegang (atau pernah memegang) lebih dari 5% saham perusahaan dan bermaksud (atau pernah bermaksud) untuk secara aktif mengejar perubahan strategi bisnis. Jadwal 13G menunjukkan investasi pasif lebih dari 5%.
The share price as of September 5, 2025 is 35.06 / share. Previously, on September 9, 2024, the share price was 28.61 / share. This represents an increase of 22.54% over that period.
Skor Sentimen Dana
Skor Sentimen Dana (sebelumnya dikenal sebagai Skor Akumulasi Kepemilikan) menemukan saham-saham yang paling banyak dibeli oleh dana. Ini adalah hasil dari model kuantitatif multi-faktor yang canggih yang mengidentifikasi perusahaan dengan tingkat akumulasi institusional tertinggi. Model penilaian menggunakan kombinasi dari total peningkatan pemilik yang diungkapkan, perubahan dalam alokasi portofolio pada pemilik tersebut, dan metrik lainnya. Angka berkisar dari 0 hingga 100, dengan angka yang lebih tinggi menunjukkan tingkat akumulasi yang lebih tinggi dibandingkan dengan perusahaan sejenisnya, dan 50 adalah rata-ratanya.
Frekuensi Pembaruan: Setiap Hari
Lihat Ownership Explorer, yang menyediakan daftar perusahaan dengan peringkat tertinggi.
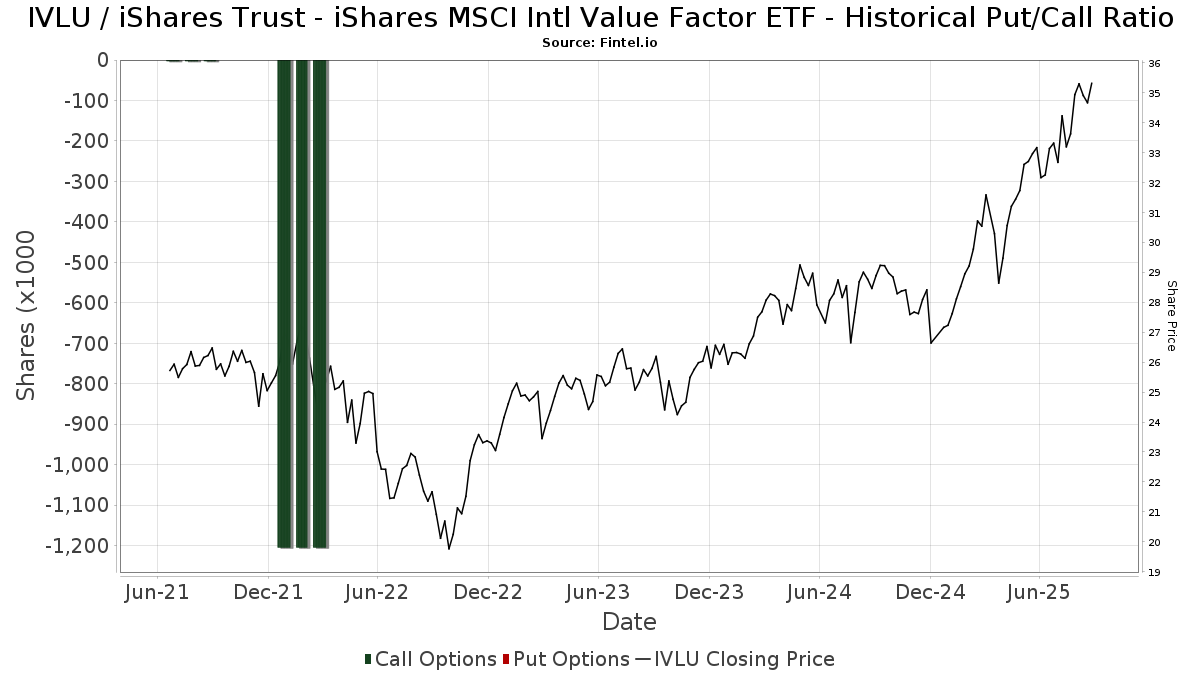
Rasio Put/Call Institusional
Selain melaporkan isu ekuitas dan utang standar, institusi dengan aset di bawah manajemen lebih dari 100 juta dolar AS juga harus mengungkapkan kepemilikan opsi put dan call mereka. Karena opsi put umumnya menunjukkan sentimen negatif, dan opsi call menunjukkan sentimen positif, kita dapat mengetahui sentimen institusional secara keseluruhan dengan memplot rasio put terhadap call. Grafik di sebelah kanan memplot rasio put/call historis untuk instrumen ini.
Menggunakan Rasio Put/Call sebagai indikator sentimen investor mengatasi salah satu kekurangan utama dari penggunaan total kepemilikan institusional, yaitu sejumlah besar aset yang dikelola diinvestasikan secara pasif untuk melacak indeks. Dana yang dikelola secara pasif biasanya tidak membeli opsi, sehingga indikator rasio put/call lebih akurat dalam melacak sentimen dana yang dikelola secara aktif.
Pengajuan 13D/G
Kami menyajikan pengajuan 13D/G secara terpisah dari pengajuan 13F karena perlakuan yang berbeda oleh SEC. Pengajuan 13D/G dapat diajukan oleh kelompok investor (dengan satu pemimpin), sedangkan pengajuan 13F tidak bisa. Hal ini mengakibatkan situasi di mana seorang investor dapat mengajukan 13D/G yang melaporkan satu nilai untuk total saham (mewakili semua saham yang dimiliki oleh kelompok investor), tetapi kemudian mengajukan 13F yang melaporkan nilai yang berbeda untuk total saham (mewakili kepemilikan mereka sendiri). Ini berarti bahwa kepemilikan saham dari pengajuan 13D/G dan pengajuan 13F seringkali tidak dapat dibandingkan secara langsung, sehingga kami menyajikannya secara terpisah.
Catatan: Mulai 16 Mei 2021, kami tidak lagi menampilkan pemilik yang belum mengajukan 13D/G dalam setahun terakhir. Sebelumnya, kami menampilkan riwayat lengkap pengajuan 13D/G. Secara umum, entitas yang diwajibkan untuk mengajukan pengajuan 13D/G harus mengajukan setidaknya setiap tahun sebelum mengirimkan pengajuan penutupan. Namun, terkadang dana keluar dari posisi tanpa mengirimkan pengajuan penutupan (misalnya, mereka menghentikan operasi), sehingga menampilkan riwayat lengkap terkadang menyebabkan kebingungan tentang kepemilikan saat ini. Untuk mencegah kebingungan, kami sekarang hanya menampilkan pemilik 'saat ini' - yaitu - pemilik yang telah mengajukan dalam setahun terakhir.
Upgrade to unlock premium data.
Pengajuan 13F dan NPORT
Detail pada pengajuan 13F tersedia gratis. Detail pada pengajuan NP memerlukan keanggotaan premium. Baris berwarna hijau menunjukkan posisi baru. Baris berwarna merah menunjukkan posisi yang sudah ditutup. Klik tautan ini ikon untuk melihat riwayat transaksi selengkapnya.
Tingkatkan
untuk membuka data premium dan mengekspor ke Excel ![]() .
.
| Tanggal File | Sumber | Investor | Ketik | Presyo ng Avg (Silangan) |
Saham | Δ Saham (%) |
Dilaporkan Nilai ($1000) |
Nilai Δ (%) |
Alokasi Port (%) |
|
|---|---|---|---|---|---|---|---|---|---|---|
| 2025-08-13 | 13F | Custom Index Systems, Llc | 49,452 | 63.65 | 1,626 | 77.70 | ||||
| 2025-08-14 | 13F | Beaird Harris Wealth Management, LLC | 0 | -100.00 | 0 | |||||
| 2025-08-15 | 13F | High Falls Advisors, Inc | 29,045 | 4.78 | 955 | 13.69 | ||||
| 2025-07-09 | 13F | Breakwater Capital Group | 35,877 | 15.39 | 1,180 | 25.16 | ||||
| 2025-07-17 | 13F | PMG Wealth Management, Inc. | 85,601 | 2,815 | ||||||
| 2025-07-25 | 13F | Envestnet Portfolio Solutions, Inc. | 10,253 | 13.34 | 337 | 22.99 | ||||
| 2025-07-16 | 13F | Plancorp, LLC | 324,507 | -4.36 | 10,673 | 3.78 | ||||
| 2025-08-13 | 13F | Transce3nd, LLC | 62 | 0.00 | 2 | 100.00 | ||||
| 2025-07-14 | 13F | U.S. Capital Wealth Advisors, LLC | 95,225 | 11.31 | 3,132 | 20.75 | ||||
| 2025-08-14 | 13F | Mml Investors Services, Llc | 205,122 | 974.95 | 7 | |||||
| 2025-08-14 | 13F | Goldman Sachs Group Inc | 142,439 | -41.22 | 4,685 | -36.22 | ||||
| 2025-07-14 | 13F | Painted Porch Advisors LLC | 264 | 0.00 | 9 | 0.00 | ||||
| 2025-08-14 | 13F | GWM Advisors LLC | 153,148 | 43.68 | 5,037 | 55.94 | ||||
| 2025-08-12 | 13F | BlackRock, Inc. | 167,887 | -35.47 | 5,522 | -29.98 | ||||
| 2025-07-30 | 13F | Eqis Capital Management, Inc. | 364,176 | -55.90 | 11,978 | -52.14 | ||||
| 2025-08-14 | 13F | Ancora Advisors, LLC | 556 | 0.00 | 18 | 12.50 | ||||
| 2025-07-08 | 13F | Parallel Advisors, LLC | 160,957 | 12.35 | 5,294 | 21.90 | ||||
| 2025-08-13 | 13F | Per Stirling Capital Management, LLC. | 302,477 | 1.45 | 9,948 | 10.09 | ||||
| 2025-08-14 | 13F | Fmr Llc | 7,528,185 | -7.81 | 247,602 | 0.04 | ||||
| 2025-07-18 | 13F | Magnolia Private Wealth, LLC | 7,827 | 0.00 | 257 | 8.44 | ||||
| 2025-08-14 | 13F | Css Llc/il | 70,300 | 0.00 | 2,312 | 8.54 | ||||
| 2025-07-25 | 13F | Ackerman Capital Advisors, LLC | 413,433 | 0.60 | 13,598 | 9.16 | ||||
| 2025-08-14 | 13F | UBS Group AG | 117,546 | 8.02 | 3,866 | 17.22 | ||||
| 2025-07-16 | 13F | Ironwood Wealth Management, Inc. | 277,158 | -0.67 | 9,141 | 17.16 | ||||
| 2025-07-21 | 13F | Ascent Group, LLC | 30,424 | 50.94 | 1,001 | 63.93 | ||||
| 2025-08-14 | 13F | Mariner, LLC | 52,099 | 57.88 | 1,714 | 71.30 | ||||
| 2025-06-17 | 13F | Howe & Rusling Inc | 0 | -100.00 | 0 | |||||
| 2025-08-01 | 13F | Ashton Thomas Private Wealth, LLC | 289,990 | -1.12 | 9,538 | 7.30 | ||||
| 2025-07-17 | 13F | Halbert Hargrove Global Advisors, Llc | 0 | -100.00 | 0 | |||||
| 2025-08-13 | 13F | Cerity Partners LLC | 76,309 | -0.87 | 2,510 | 7.54 | ||||
| 2025-08-14 | 13F/A | Bank Julius Baer & Co. Ltd, Zurich | 49,428 | 13.02 | 1,626 | 8.48 | ||||
| 2025-07-23 | 13F | Elevate Wealth Advisory, Inc | 4,151 | 2.29 | 137 | 11.48 | ||||
| 2025-08-13 | 13F | SCS Capital Management LLC | 116,839 | 0.70 | 3,843 | 9.27 | ||||
| 2025-08-26 | NP | EVTTX - The E-Valuator Conservative/Moderate (30%-50%) RMS Fund Service Class Shares | 5,478 | 180 | ||||||
| 2025-08-07 | 13F | Addison Advisors LLC | 925 | 0.00 | 30 | 7.14 | ||||
| 2025-07-25 | 13F | Sequoia Financial Advisors, LLC | 51,975 | 0.38 | 1,709 | 8.92 | ||||
| 2025-04-14 | 13F | Pallas Capital Advisors LLC | 0 | -100.00 | 0 | |||||
| 2025-08-06 | 13F | Commonwealth Equity Services, Llc | 50,534 | 52.01 | 2 | 0.00 | ||||
| 2025-08-13 | 13F | Russell Investments Group, Ltd. | 599 | 31.36 | 20 | 46.15 | ||||
| 2025-08-15 | 13F | Kestra Advisory Services, LLC | 142,308 | -29.37 | 4,681 | -23.37 | ||||
| 2025-08-12 | 13F | Atlas Capital Advisors Llc | 290,051 | -2.54 | 9,540 | 5.75 | ||||
| 2025-07-31 | 13F | Glass Jacobson Investment Advisors llc | 5,152 | 2.20 | 169 | 24.26 | ||||
| 2025-08-07 | 13F | Allworth Financial LP | 52,064 | 0.28 | 1,712 | 6.93 | ||||
| 2025-08-26 | NP | EVMLX - The E-Valuator Moderate (50%-70%) RMS Fund Service Class Shares | 28,955 | 952 | ||||||
| 2025-08-15 | 13F | Semmax Financial Advisors Inc. | 78 | 0.00 | 3 | 0.00 | ||||
| 2025-08-07 | 13F | Vise Technologies, Inc. | 54,008 | 1,776 | ||||||
| 2025-08-07 | 13F | Shared Vision Wealth Group LLC | 26,536 | -0.81 | 874 | 7.90 | ||||
| 2025-08-14 | 13F | Two Sigma Securities, Llc | 0 | -100.00 | 0 | |||||
| 2025-04-30 | 13F | Stratos Wealth Advisors, LLC | 0 | -100.00 | 0 | -100.00 | ||||
| 2025-05-13 | 13F | Thrivent Financial For Lutherans | 0 | -100.00 | 0 | |||||
| 2025-08-01 | 13F | Envestnet Asset Management Inc | 4,292,836 | -0.49 | 141,191 | 7.98 | ||||
| 2025-08-14 | 13F | Aqr Capital Management Llc | 17,355 | 11.25 | 571 | 20.76 | ||||
| 2025-08-11 | 13F | Morling Financial Advisors, LLC | 397 | 0.00 | 13 | 8.33 | ||||
| 2025-08-13 | 13F | Elgethun Capital Management | 6,129 | -2.34 | 202 | 5.79 | ||||
| 2025-07-09 | 13F | Fiduciary Alliance LLC | 7,128 | 0.35 | 234 | 8.84 | ||||
| 2025-05-13 | 13F | United Capital Financial Advisers, Llc | 0 | -100.00 | 0 | |||||
| 2025-08-14 | 13F | Wells Fargo & Company/mn | 1,419 | -62.37 | 47 | -59.65 | ||||
| 2025-07-28 | 13F | RCS Financial Planning, LLC | 9,708 | 19.45 | 319 | 29.67 | ||||
| 2025-07-24 | 13F | MA Private Wealth | 30,890 | 0.00 | 1,016 | 8.44 | ||||
| 2025-08-12 | 13F | Steward Partners Investment Advisory, Llc | 894 | 0.00 | 29 | 7.41 | ||||
| 2025-08-14 | 13F | Jane Street Group, Llc | 73,317 | 20.97 | 2,411 | 31.32 | ||||
| 2025-08-06 | 13F | Valued Wealth Advisors LLC | 69,182 | 17.14 | 2,275 | 27.09 | ||||
| 2025-08-26 | NP | EVAGX - The E-Valuator Aggressive Growth (85%-99%) RMS Fund Service Class Shares | 86,872 | 2,857 | ||||||
| 2025-08-13 | 13F | EverSource Wealth Advisors, LLC | 10,321 | 7.02 | 339 | 16.10 | ||||
| 2025-07-17 | 13F | One Wealth Advisors, LLC | 310,429 | 3.26 | 10,210 | 12.05 | ||||
| 2025-07-31 | 13F | CNB Bank | 590 | 0.00 | 19 | 11.76 | ||||
| 2025-07-22 | 13F | Merit Financial Group, LLC | 8,936 | -18.82 | 294 | -12.01 | ||||
| 2025-07-31 | 13F | Buckingham Strategic Partners | 284,373 | -6.13 | 9,353 | 1.86 | ||||
| 2025-07-15 | 13F | Mather Group, Llc. | 0 | -100.00 | 0 | |||||
| 2025-07-16 | 13F | West Branch Capital LLC | 350 | 0.00 | 12 | 10.00 | ||||
| 2025-07-07 | 13F | Versant Capital Management, Inc | 1,946 | -10.53 | 64 | -1.54 | ||||
| 2025-07-23 | 13F | Valmark Advisers, Inc. | 7,118 | -19.36 | 234 | -12.36 | ||||
| 2025-07-09 | 13F | Affinity Capital Advisors, LLC | 30,906 | -1.07 | 1,016 | 13.01 | ||||
| 2025-04-30 | 13F | Pineridge Advisors LLC | 0 | -100.00 | 0 | |||||
| 2025-07-02 | 13F | Dentgroup LLC | 14,065 | 7.43 | 463 | 16.67 | ||||
| 2025-08-08 | 13F | Compass Wealth Management LLC | 0 | -100.00 | 0 | |||||
| 2025-08-06 | 13F | Hoxton Planning & Management, LLC | 24,201 | 46.39 | 796 | 58.68 | ||||
| 2025-07-22 | 13F | Firethorn Wealth Partners, Llc | 27,291 | 4.76 | 898 | 13.69 | ||||
| 2025-08-11 | 13F | Wealthgarden F.s. Llc | 21,830 | -0.35 | 719 | 8.45 | ||||
| 2025-07-30 | 13F | Cullen/frost Bankers, Inc. | 237 | 2.16 | 8 | 0.00 | ||||
| 2025-08-04 | 13F | Mayflower Financial Advisors, LLC | 62,342 | 33.37 | 2,050 | 44.77 | ||||
| 2025-08-06 | 13F | Prospera Financial Services Inc | 7,679 | 253 | ||||||
| 2025-04-29 | 13F | Lee Danner & Bass Inc | 0 | -100.00 | 0 | |||||
| 2025-07-31 | 13F | Red Wave Investments LLC | 60,155 | -0.38 | 1,978 | 8.09 | ||||
| 2025-08-13 | 13F | Flow Traders U.s. Llc | 82,883 | 3 | ||||||
| 2025-07-17 | 13F | KWB Wealth | 462,200 | -22.02 | 14,009 | -12.81 | ||||
| 2025-08-07 | 13F | Nwam Llc | 17,050 | 14.54 | 566 | 25.28 | ||||
| 2025-08-08 | 13F | Cornerstone Advisors Asset Management, Inc | 35,433 | 0.00 | 1,165 | 8.57 | ||||
| 2025-08-14 | 13F | Royal Bank Of Canada | 49,252 | -67.26 | 1,620 | -64.47 | ||||
| 2025-07-14 | 13F | Capstone Wealth Management, LLC | 12,811 | 1.53 | 421 | 10.21 | ||||
| 2025-07-31 | 13F | Cambridge Investment Research Advisors, Inc. | 28,323 | 105.11 | 1 | |||||
| 2025-07-21 | 13F | Empirical Financial Services, LLC d.b.a. Empirical Wealth Management | 24,425 | -1.60 | 803 | 6.78 | ||||
| 2025-07-22 | 13F | Kickstand Ventures, Llc. | 96,305 | 5.66 | 3,167 | 14.66 | ||||
| 2025-08-14 | 13F | Becker Capital Management Inc | 8,255 | 272 | ||||||
| 2025-07-22 | 13F | Duncan Williams Asset Management, LLC | 96,305 | 3,167 | ||||||
| 2025-08-07 | 13F | Weil Company, Inc. | 0 | -100.00 | 0 | |||||
| 2025-07-25 | 13F | Cwm, Llc | 14,649 | 4.98 | 0 | |||||
| 2025-07-30 | 13F | Cookson Peirce & Co Inc | 7,793 | 256 | ||||||
| 2025-08-11 | 13F | Theory Financial Llc | 8,377 | 2.48 | 276 | 11.34 | ||||
| 2025-08-13 | 13F | Vance Wealth, Inc. | 88,682 | 9.14 | 2,917 | 18.44 | ||||
| 2025-07-14 | 13F | Abound Wealth Management | 35 | 0.00 | 1 | 0.00 | ||||
| 2025-07-15 | 13F | Well Done, LLC | 10,341 | 0.00 | 340 | 21.43 | ||||
| 2025-07-07 | 13F | Accelerate Investment Advisors LLC | 8,567 | 282 | ||||||
| 2025-07-09 | 13F | Baron Wealth Management LLC | 8,052 | 265 | ||||||
| 2025-07-15 | 13F | Financial Management Professionals, Inc. | 262 | 0.00 | 9 | 14.29 | ||||
| 2025-08-14 | 13F | Gerber Kawasaki Wealth & Investment Management | 0 | -100.00 | 0 | |||||
| 2025-07-31 | 13F | Wealthfront Advisers Llc | 15,545 | 110.04 | 511 | 128.13 | ||||
| 2025-08-01 | 13F | First Command Advisory Services, Inc. | 259 | 0.00 | 9 | 14.29 | ||||
| 2025-08-05 | 13F | Bank Of Montreal /can/ | 549 | 0.00 | 18 | 12.50 | ||||
| 2025-08-05 | 13F | Simplex Trading, Llc | 99 | 0 | ||||||
| 2025-08-12 | 13F | Choate Investment Advisors | 8,552 | 281 | ||||||
| 2025-07-28 | 13F | Cypress Wealth Services, LLC | 103,317 | 5.34 | 3,398 | 14.33 | ||||
| 2025-08-04 | 13F | Spire Wealth Management | 7,060 | 0.73 | 232 | 9.43 | ||||
| 2025-08-14 | 13F | Keebeck Wealth Management, LLC | 162,903 | 0.17 | 5,358 | 8.68 | ||||
| 2025-07-22 | 13F | Valeo Financial Advisors, LLC | 10,322 | -10.41 | 339 | -2.87 | ||||
| 2025-08-14 | 13F | Clayton Partners LLC | 81,474 | -9.70 | 2,680 | -2.01 | ||||
| 2025-07-21 | 13F | Ameritas Advisory Services, LLC | 1,788 | 59 | ||||||
| 2025-08-11 | 13F | Bell Investment Advisors, Inc | 63,634 | 25.07 | 2,093 | 35.67 | ||||
| 2025-08-14 | 13F/A | Rockefeller Capital Management L.P. | 165,699 | 31.16 | 5,450 | 42.31 | ||||
| 2025-05-02 | 13F | MB Generational Wealth, LLC | 14,338 | 71.18 | 435 | 91.19 | ||||
| 2025-08-08 | 13F | Smithfield Trust Co | 3,546 | 0.00 | 0 | |||||
| 2025-08-05 | 13F | Fullcircle Wealth Llc | 12,050 | 401 | ||||||
| 2025-08-13 | 13F | Kilter Group LLC | 1 | 0 | ||||||
| 2025-04-22 | 13F | Duncker Streett & Co Inc | 0 | -100.00 | 0 | |||||
| 2025-07-03 | 13F | Collective Family Office Llc | 12,078 | 0.00 | 397 | 8.47 | ||||
| 2025-08-11 | 13F | Angeles Investment Advisors, LLC | 77,680 | 0.00 | 2,555 | 8.50 | ||||
| 2025-08-14 | 13F | Ameriprise Financial Inc | 245,405 | 33.08 | 8,068 | 44.34 | ||||
| 2025-07-25 | 13F | Stonehage Fleming Financial Services Holdings Ltd | 86,144 | 0.00 | 2,833 | 8.50 | ||||
| 2025-08-12 | 13F | Change Path, LLC | 13,619 | 4.75 | 448 | 13.45 | ||||
| 2025-07-07 | 13F | Kings Path Partners LLC | 23 | 1 | ||||||
| 2025-08-11 | 13F | TRUE Private Wealth Advisors | 0 | -100.00 | 0 | |||||
| 2025-05-09 | 13F | Emerald Investment Partners, Llc | 0 | -100.00 | 0 | |||||
| 2025-07-17 | 13F | Beacon Capital Management, LLC | 239 | 0.00 | 8 | 0.00 | ||||
| 2025-08-14 | 13F | Bnp Paribas Arbitrage, Sa | 0 | -100.00 | 0 | |||||
| 2025-07-18 | 13F | SOA Wealth Advisors, LLC. | 4,883 | 161 | ||||||
| 2025-08-14 | 13F | McIlrath & Eck, LLC | 637 | 2.25 | 21 | 11.11 | ||||
| 2025-07-08 | 13F | Braun-Bostich & Associates Inc. | 23,852 | 0.56 | 784 | 9.19 | ||||
| 2025-08-06 | 13F | Nicholas Hoffman & Company, LLC. | 20,913 | 0.00 | 688 | 8.53 | ||||
| 2025-08-14 | 13F | Wiley Bros.-aintree Capital, Llc | 98,503 | 22.30 | 3,240 | 31.61 | ||||
| 2025-08-26 | NP | EVGLX - The E-Valuator Growth (70%-85%) RMS Fund Service Class Shares | 79,741 | 2,623 | ||||||
| 2025-07-21 | 13F | Ameriflex Group, Inc. | 26,385 | -7.14 | 860 | -0.23 | ||||
| 2025-05-15 | 13F | Lgl Partners, Llc | 0 | -100.00 | 0 | |||||
| 2025-07-25 | 13F | Hemington Wealth Management | 46,045 | 0.12 | 2 | 0.00 | ||||
| 2025-08-05 | 13F | Dunhill Financial, LLC | 25 | 0.00 | 1 | |||||
| 2025-07-31 | 13F | TSA Wealth Managment LLC | 84,464 | 23.00 | 2,778 | 33.49 | ||||
| 2025-08-05 | 13F | 5T Wealth, LLC | 8,948 | 6.28 | 294 | 15.29 | ||||
| 2025-08-12 | 13F | Pathstone Holdings, LLC | 33,565 | 63.18 | 1,104 | 73.16 | ||||
| 2025-08-19 | 13F | Advisory Services Network, LLC | 30,143 | -0.23 | 993 | 8.42 | ||||
| 2025-09-04 | 13F/A | Advisor Group Holdings, Inc. | 349,012 | 191.62 | 11,476 | 216.40 | ||||
| 2025-07-24 | 13F | Trust Co Of Toledo Na /oh/ | 223 | 7 | ||||||
| 2025-07-24 | 13F | Us Bancorp \de\ | 18,744 | 27.29 | 616 | 38.12 | ||||
| 2025-05-08 | 13F | Glassman Wealth Services | 0 | -100.00 | 0 | |||||
| 2025-07-28 | 13F | Rosenberg Matthew Hamilton | 9,160 | -0.69 | 301 | 7.89 | ||||
| 2025-05-12 | 13F | Kohmann Bosshard Financial Services, LLC | 0 | -100.00 | 0 | |||||
| 2025-08-13 | 13F | GeoWealth Management, LLC | 0 | -100.00 | 0 | |||||
| 2025-08-15 | 13F | Captrust Financial Advisors | 36,850 | -0.56 | 1,212 | 7.84 | ||||
| 2025-07-08 | 13F | Peirce Capital Management, LLC | 18,124 | 16.21 | 596 | 26.27 | ||||
| 2025-07-29 | 13F | ShoreHaven Wealth Partners, LLC | 134,637 | 0.30 | 4,428 | 8.85 | ||||
| 2025-08-06 | 13F | Stokes Family Office, LLC | 40,628 | -3.68 | 1,336 | 4.54 | ||||
| 2025-08-14 | 13F | Sunbelt Securities, Inc. | 1,315 | 36 | ||||||
| 2025-07-17 | 13F | Lauterbach Financial Advisors, LLC | 15,823 | 2.24 | 520 | 10.87 | ||||
| 2025-08-12 | 13F | J.w. Cole Advisors, Inc. | 18,751 | 617 | ||||||
| 2025-08-13 | 13F | VestGen Advisors, LLC | 20,441 | 2.16 | 672 | 10.89 | ||||
| 2025-07-11 | 13F | My Legacy Advisors, LLC | 24,065 | -1.86 | 801 | 7.67 | ||||
| 2025-07-22 | 13F | Unique Wealth, Llc | 21,638 | 73.63 | 712 | 88.59 | ||||
| 2025-05-05 | 13F | Hazlett, Burt & Watson, Inc. | 0 | -100.00 | 0 | |||||
| 2025-08-12 | 13F | O'shaughnessy Asset Management, Llc | 14,746 | -1.03 | 485 | 7.32 | ||||
| 2025-06-27 | NP | SUNAMERICA SERIES TRUST - SA BlackRock Multi-Factor 70/30 Portfolio Class 1 | 47,067 | 2.00 | 1,468 | 13.01 | ||||
| 2025-07-29 | 13F | Systelligence, LLC | 207,542 | 6,826 | ||||||
| 2025-05-15 | 13F | Chilton Investment Co Llc | 0 | -100.00 | 0 | -100.00 | ||||
| 2025-08-13 | 13F | Northern Trust Corp | 19,687 | 1.00 | 648 | 9.66 | ||||
| 2025-07-28 | 13F | WealthPlan Investment Management, LLC | 64,335 | 2,116 | ||||||
| 2025-07-14 | 13F | Foster Group, Inc. | 402,642 | -0.50 | 13,243 | 7.97 | ||||
| 2025-07-16 | 13F | Squire Investment Management Company, LLC | 36,526 | -32.50 | 1,201 | -26.77 | ||||
| 2025-08-14 | 13F | CoreFirst Bank & Trust | 184,435 | 1.23 | 6,066 | 9.85 | ||||
| 2025-04-10 | 13F | Watershed Private Wealth Llc | 0 | -100.00 | 0 | |||||
| 2025-08-13 | 13F | Balance Wealth, LLC | 72,393 | 1.09 | 2,381 | 9.72 | ||||
| 2025-08-11 | 13F | Invenio Wealth Partners Llc | 16,801 | 553 | ||||||
| 2025-08-14 | 13F | Stifel Financial Corp | 263,649 | 148.23 | 8,671 | 169.37 | ||||
| 2025-05-14 | 13F | Huntington National Bank | 6 | -68.75 | ||||||
| 2025-07-29 | 13F | Horst & Graben Wealth Management LLC | 42,557 | -13.39 | 1,400 | -6.04 | ||||
| 2025-08-06 | 13F | SOUTH STATE Corp | 924 | 0.00 | 30 | 7.14 | ||||
| 2025-07-11 | 13F | Prosperity Planning, Inc. | 146,455 | -3.36 | 4,817 | 4.86 | ||||
| 2025-07-14 | 13F | Park Avenue Securities Llc | 304,441 | 10 | ||||||
| 2025-08-06 | 13F | AE Wealth Management LLC | 1,728 | -21.35 | 57 | -15.15 | ||||
| 2025-08-07 | 13F | Tacita Capital Inc | 84,810 | 1.22 | 2,789 | 9.85 | ||||
| 2025-08-12 | 13F | MAI Capital Management | 109 | 34.57 | 4 | 50.00 | ||||
| 2025-08-14 | 13F | Comerica Bank | 15,498 | 0.00 | 510 | 8.53 | ||||
| 2025-07-25 | 13F | ONE Advisory Partners, LLC | 72,192 | 0.00 | 2,470 | 12.89 | ||||
| 2025-07-10 | 13F | Trust Point Inc. | 338,038 | 26.99 | 11,118 | 37.80 | ||||
| 2025-07-24 | 13F | Cyndeo Wealth Partners, LLC | 7,999 | 3.28 | 263 | 12.39 | ||||
| 2025-07-28 | 13F | Sagespring Wealth Partners, Llc | 125,195 | 23.98 | 4,118 | 34.54 | ||||
| 2025-08-06 | 13F | Quadrant Private Wealth Management, LLC | 7,174 | 236 | ||||||
| 2025-07-16 | 13F | Kathmere Capital Management, LLC | 808,775 | 0.34 | 26,601 | 8.88 | ||||
| 2025-07-22 | 13F | Sutton Place Investors Llc | 7,423 | 5.02 | 244 | 14.02 | ||||
| 2025-08-12 | 13F | Proequities, Inc. | 0 | 0 | ||||||
| 2025-08-14 | 13F | TCG Advisory Services, LLC | 692,273 | 64.53 | 22,769 | 78.54 | ||||
| 2025-07-17 | 13F | City Holding Co | 179 | 0.00 | 6 | 0.00 | ||||
| 2025-07-25 | 13F | Concurrent Investment Advisors, LLC | 283,153 | -7.08 | 9,313 | 0.82 | ||||
| 2025-08-11 | 13F | Stonebrook Private Inc. | 24,966 | 0.40 | 821 | 9.03 | ||||
| 2025-08-07 | 13F | Kestra Private Wealth Services, Llc | 18,538 | 141.32 | 610 | 162.50 | ||||
| 2025-08-14 | 13F | Smartleaf Asset Management LLC | 23,269 | 55.89 | 766 | 67.76 | ||||
| 2025-08-11 | 13F | HighTower Advisors, LLC | 113,674 | 31.19 | 3,739 | 42.35 | ||||
| 2025-08-13 | 13F | Townsquare Capital Llc | 0 | -100.00 | 0 | |||||
| 2025-07-24 | 13F | Robertson Stephens Wealth Management, LLC | 54,100 | 9.52 | 1,779 | 18.84 | ||||
| 2025-07-09 | 13F | High Probability Advisors, LLC | 364,723 | -10.20 | 11,996 | -2.57 | ||||
| 2025-08-12 | 13F | New Republic Capital, LLC | 3,667 | 0.00 | 121 | 8.11 | ||||
| 2025-05-12 | 13F | National Bank Of Canada /fi/ | 0 | -100.00 | 0 | -100.00 | ||||
| 2025-07-14 | 13F | Kfg Wealth Management, Llc | 0 | -100.00 | 0 | |||||
| 2025-07-18 | 13F | Warren Street Wealth Advisors, LLC | 21,174 | -0.34 | 696 | 8.24 | ||||
| 2025-08-12 | 13F | Lionshead Wealth Management, LLC | 0 | -100.00 | 0 | |||||
| 2025-07-24 | 13F | JNBA Financial Advisors | 244,293 | -10.18 | 8,035 | -2.54 | ||||
| 2025-07-30 | 13F | Drive Wealth Management, Llc | 17,350 | -3.02 | 571 | 5.17 | ||||
| 2025-08-06 | 13F | Csenge Advisory Group | 25,763 | -0.15 | 848 | 10.43 | ||||
| 2025-07-24 | 13F | Ronald Blue Trust, Inc. | 0 | -100.00 | 0 | |||||
| 2025-07-31 | 13F | Brighton Jones Llc | 24,322 | 19.71 | 800 | 29.92 | ||||
| 2025-05-06 | 13F | Venturi Wealth Management, LLC | 0 | -100.00 | 0 | |||||
| 2025-07-25 | 13F | PrairieView Partners, LLC | 2,471 | 0.00 | 0 | |||||
| 2025-08-15 | 13F | Morgan Stanley | 778,423 | 37.22 | 25,602 | 48.91 | ||||
| 2025-07-11 | 13F | Ridgeline Wealth, LLC | 10,160 | -43.56 | 334 | -38.72 | ||||
| 2025-07-17 | 13F | Saxon Interests, Inc. | 93,246 | 0.00 | 2,826 | 0.00 | ||||
| 2025-03-12 | 13F/A | Private Capital Management Llc | 924 | 0.00 | 25 | -3.85 | ||||
| 2025-07-28 | 13F | Harbour Investments, Inc. | 103 | 3 | ||||||
| 2025-08-07 | 13F | Meridian Financial Partners LLC | 61,207 | 2 | ||||||
| 2025-08-01 | 13F | Transcend Wealth Collective, Llc | 24,656 | 10.54 | 811 | 19.82 | ||||
| 2025-05-02 | 13F | Leo Wealth, LLC | 0 | -100.00 | 0 | |||||
| 2025-08-11 | 13F | Aptus Capital Advisors, LLC | 193,994 | 1.44 | 6,380 | 10.08 | ||||
| 2025-08-14 | 13F | Qube Research & Technologies Ltd | 0 | -100.00 | 0 | |||||
| 2025-08-26 | NP | EVVLX - The E-Valuator Very Conservative (0%-15%) RMS Fund Service Class Shares | 1,131 | 37 | ||||||
| 2025-04-28 | 13F | First Horizon Advisors, Inc. | 0 | -100.00 | 0 | -100.00 | ||||
| 2025-08-14 | 13F | Citadel Advisors Llc | 185,789 | 2,452.05 | 6,111 | 2,677.27 | ||||
| 2025-08-13 | 13F | Northwestern Mutual Wealth Management Co | 15,319,386 | -0.72 | 503,855 | 7.73 | ||||
| 2025-08-08 | 13F | Wealth Alliance | 98,409 | 59.69 | 3,237 | 73.33 | ||||
| 2025-08-11 | 13F | Farrow Financial Inc. | 282,640 | -0.18 | 9,296 | 8.33 | ||||
| 2025-07-30 | 13F | Jackson Thornton Asset Management, Llc | 20,632 | 0.00 | 680 | 10.75 | ||||
| 2025-08-12 | 13F | CIBC Private Wealth Group, LLC | 2,092 | 209,100.00 | 69 | |||||
| 2025-08-13 | 13F | Jackson Creek Investment Advisors LLC | 38,130 | -6.89 | 1 | 0.00 | ||||
| 2025-07-17 | 13F | Kelly Financial Services LLC | 23,825 | 7.11 | 784 | 16.17 | ||||
| 2025-07-25 | 13F | Keener Financial Planning LLC | 491 | 0 | ||||||
| 2025-08-04 | 13F | Pensionmark Financial Group, Llc | 67,459 | 106.90 | 2,219 | 124.49 | ||||
| 2025-08-01 | 13F | JDH Wealth Management, LLC | 48,834 | 3.14 | 1,606 | 11.92 | ||||
| 2025-07-21 | 13F | Patriot Financial Group Insurance Agency, LLC | 13,868 | 19.25 | 456 | 29.55 | ||||
| 2025-08-14 | 13F | Raymond James Financial Inc | 229,515 | 6.15 | 7,549 | 15.18 | ||||
| 2025-08-11 | 13F | Rothschild Investment Llc | 780 | 0.00 | 26 | 8.70 | ||||
| 2025-08-14 | 13F | Colony Group, LLC | 1,016,508 | -6.88 | 33,433 | 1.05 | ||||
| 2025-07-11 | 13F | Farther Finance Advisors, LLC | 23,376 | -25.96 | 769 | -19.67 | ||||
| 2025-07-23 | 13F | Lansing Street Advisors | 7,247 | -0.89 | 238 | 7.69 | ||||
| 2025-04-21 | 13F | Compass Capital Corp /ma/ /adv | 0 | -100.00 | 0 | |||||
| 2025-08-08 | 13F | JBF Capital, Inc. | 60,000 | 1,973 | ||||||
| 2025-07-30 | 13F | Strategic Blueprint, LLC | 63,565 | 2.15 | 2,091 | 10.82 | ||||
| 2025-08-06 | 13F | Savant Capital, LLC | 14,536 | 2.50 | 478 | 11.42 | ||||
| 2025-07-10 | 13F | Ryan Investment Management, Inc. | 128 | 4 | ||||||
| 2025-07-29 | 13F | Commons Capital, Llc | 74,786 | 2,460 | ||||||
| 2025-08-04 | 13F | Savvy Advisors, Inc. | 672,133 | 29.15 | 22,106 | 40.14 | ||||
| 2025-08-14 | 13F | IHT Wealth Management, LLC | 154,961 | 5,097 | ||||||
| 2025-07-10 | 13F | Kozak & Associates, Inc. | 45 | 2.27 | 1 | 0.00 | ||||
| 2025-07-25 | 13F | Index Fund Advisors, Inc. | 23,653 | 2.17 | 778 | 10.84 | ||||
| 2025-08-15 | 13F | CI Private Wealth, LLC | 23,497 | 1.08 | 773 | 9.66 | ||||
| 2025-08-14 | 13F | Integrated Wealth Concepts LLC | 414,010 | -2.88 | 13,617 | 5.39 | ||||
| 2025-07-24 | 13F | Financial Connections Group, Inc. | 84 | 0 | ||||||
| 2025-08-08 | 13F | Cetera Investment Advisers | 138,344 | 0.84 | 4,550 | 9.43 | ||||
| 2025-08-12 | 13F | LPL Financial LLC | 591,834 | 9.61 | 19,465 | 18.94 | ||||
| 2025-08-14 | 13F | Warren Averett Asset Management, LLC | 21,467 | -12.04 | 706 | -4.47 | ||||
| 2025-05-02 | 13F | Concord Wealth Partners | 0 | -100.00 | 0 | |||||
| 2025-07-24 | 13F | IFP Advisors, Inc | 171,388 | -10.03 | 5,637 | -2.37 | ||||
| 2025-08-14 | 13F | Quantinno Capital Management LP | 21,245 | 699 | ||||||
| 2025-08-04 | 13F | Capital Performance Advisors Llp | 14,228 | -0.41 | 468 | 7.85 | ||||
| 2025-07-21 | 13F | Crews Bank & Trust | 750 | 0.00 | 25 | 9.09 | ||||
| 2025-08-11 | 13F | Principal Securities, Inc. | 3,140 | 57.00 | 103 | 90.74 | ||||
| 2025-07-23 | 13F | Wise Wealth Partners | 21,233 | 0.04 | 698 | 8.55 | ||||
| 2025-08-07 | 13F | BOK Financial Private Wealth, Inc. | 26 | 1 | ||||||
| 2025-08-14 | 13F | EP Wealth Advisors, Inc. | 606,588 | 9,998.02 | 19,951 | 10,861.54 | ||||
| 2025-07-10 | 13F | Wealth Enhancement Advisory Services, Llc | 663,855 | -3.43 | 22,027 | 5.71 | ||||
| 2025-07-25 | 13F | We Are One Seven, LLC | 10,061 | 44.24 | 331 | 56.40 | ||||
| 2025-07-30 | 13F | LGT Financial Advisors LLC | 798 | 5.70 | 26 | 18.18 | ||||
| 2025-08-15 | 13F | TLT Family Holdco ULC | 408,500 | 13,436 | ||||||
| 2025-08-15 | 13F | Fft Wealth Management Llc | 0 | -100.00 | 0 | |||||
| 2025-04-15 | 13F | Noble Wealth Management PBC | 832 | -5.78 | 25 | 8.70 | ||||
| 2025-07-23 | 13F | Heck Capital Advisors, LLC | 352,895 | 2,961.73 | 11,607 | 3,225.50 | ||||
| 2025-07-22 | 13F | Simplicity Wealth,LLC | 19,498 | 1.68 | 641 | 10.33 | ||||
| 2025-08-13 | 13F | Cresset Asset Management, LLC | 23,017 | 0.00 | 757 | 8.61 | ||||
| 2025-07-17 | 13F | Johnson Bixby & Associates, LLC | 26,940 | 0.17 | 886 | 8.71 | ||||
| 2025-04-17 | 13F | Janney Montgomery Scott LLC | 0 | -100.00 | 0 | |||||
| 2025-05-15 | 13F | Hrt Financial Lp | 0 | -100.00 | 0 | |||||
| 2025-08-08 | 13F | Gts Securities Llc | 6,513 | 214 | ||||||
| 2025-04-14 | 13F | Bruce G. Allen Investments, LLC | 0 | -100.00 | 0 | |||||
| 2025-08-11 | 13F | Citigroup Inc | 3,978 | 0.00 | 131 | 8.33 | ||||
| 2025-07-25 | 13F | RHS Financial, LLC | 177,249 | 1.90 | 5,830 | 10.57 | ||||
| 2025-08-08 | 13F | Pnc Financial Services Group, Inc. | 1,453 | -10.36 | 48 | -4.08 | ||||
| 2025-08-19 | 13F | National Asset Management, Inc. | 0 | -100.00 | 0 | |||||
| 2025-08-08 | 13F | TD Capital Management LLC | 1,057 | 35 | ||||||
| 2025-05-16 | 13F | Coppell Advisory Solutions LLC | 0 | -100.00 | 0 | |||||
| 2025-07-25 | 13F | Ruedi Wealth Management, Inc. | 0 | -100.00 | 0 | |||||
| 2025-08-11 | 13F | Greykasell Wealth Strategies, Inc. | 70 | -57.58 | 2 | -60.00 | ||||
| 2025-08-08 | 13F | Avantax Advisory Services, Inc. | 27,669 | -0.28 | 910 | 8.20 | ||||
| 2025-08-11 | 13F | CFS Investment Advisory Services, LLC | 15,151 | 8.01 | 0 | |||||
| 2025-08-18 | 13F | Hollencrest Capital Management | 1,391 | 46 | ||||||
| 2025-07-25 | 13F | Commonwealth Financial Services, LLC | 0 | -100.00 | 0 | |||||
| 2025-07-16 | 13F | Vision Capital Management, Inc. | 24,364 | 5.14 | 801 | 14.10 | ||||
| 2025-08-07 | 13F | Resources Investment Advisors, LLC. | 357,544 | -20.37 | 11,760 | -13.59 | ||||
| 2025-08-14 | 13F | Aprio Wealth Management, LLC | 17,046 | -1.04 | 561 | 7.28 | ||||
| 2025-08-26 | NP | EVCLX - The E-Valuator Conservative (15%-30%) RMS Fund Service Class Shares | 5,365 | 176 | ||||||
| 2025-07-11 | 13F | Kaufman Rossin Wealth, LLC | 12,813 | 0.00 | 421 | 8.51 | ||||
| 2025-08-07 | 13F | 1620 Investment Advisors, Inc. | 649 | 0.00 | 21 | 10.53 | ||||
| 2025-07-16 | 13F | Signaturefd, Llc | 734 | -10.92 | 24 | 0.00 | ||||
| 2025-08-12 | 13F | AlphaCore Capital LLC | 5,115 | 0.00 | 168 | 8.39 | ||||
| 2025-04-29 | 13F | Chilton Capital Management Llc | 0 | -100.00 | 0 | |||||
| 2025-08-06 | 13F | Stone House Investment Management, LLC | 550 | 18 | ||||||
| 2025-08-14 | 13F | Moneta Group Investment Advisors Llc | 15,346 | 0.00 | 505 | 8.39 | ||||
| 2025-07-24 | 13F | Stonebridge Financial Group, LLC | 0 | -100.00 | 0 | |||||
| 2025-08-05 | 13F | Claro Advisors LLC | 8,206 | 270 | ||||||
| 2025-08-04 | 13F | Assetmark, Inc | 1,601 | 11.49 | 53 | 20.93 | ||||
| 2025-08-12 | 13F | Global Retirement Partners, LLC | 35,617 | 112.50 | 1,171 | 157.93 | ||||
| 2025-07-23 | 13F | Armbruster Capital Management, Inc. | 700,825 | 1.83 | 23,050 | 10.50 | ||||
| 2025-08-11 | 13F | Dorsey & Whitney Trust CO LLC | 8,500 | 0.00 | 280 | 8.56 | ||||
| 2025-07-22 | 13F | Capital Advisors Inc/ok | 23,975 | 0.00 | 789 | 8.54 | ||||
| 2025-08-07 | 13F | W Advisors, Llc | 39,480 | -0.45 | 1,298 | 7.99 | ||||
| 2025-08-12 | 13F | Wood Tarver Financial Group, LLC | 125 | 0.00 | 0 | -100.00 | ||||
| 2025-08-11 | 13F | Private Advisor Group, LLC | 98,410 | 416.45 | 3,237 | 460.83 | ||||
| 2025-07-18 | 13F | Clarity Financial LLC | 0 | -100.00 | 0 | |||||
| 2025-07-23 | 13F | Foresight Capital Management Advisors, Inc. | 0 | -100.00 | 0 | |||||
| 2025-08-05 | 13F | Verity Asset Management, Inc. | 19,388 | 638 | ||||||
| 2025-04-17 | 13F | Qrg Capital Management, Inc. | 0 | -100.00 | 0 | |||||
| 2025-07-15 | 13F | Garrett Investment Advisors LLC | 9,805 | -4.87 | 322 | 3.21 | ||||
| 2025-08-13 | 13F | Twin Peaks Wealth Advisors, LLC | 2,461 | 85 | ||||||
| 2025-05-02 | 13F | Transcendent Capital Group LLC | 0 | -100.00 | 0 | |||||
| 2025-08-08 | 13F | Creative Planning | 33,470 | -0.07 | 1,101 | 8.37 | ||||
| 2025-08-14 | 13F | Ariadne Wealth Management, LP | 10,910 | -0.91 | 381 | 9.48 | ||||
| 2025-08-14 | 13F | Mercer Global Advisors Inc /adv | 4,136,681 | -5.44 | 136,055 | 2.61 | ||||
| 2025-08-15 | 13F | Equitable Holdings, Inc. | 62,086 | 151.31 | 2,042 | 172.99 | ||||
| 2025-08-13 | 13F | Millstone Evans Group, LLC | 287 | 0.00 | 9 | 12.50 | ||||
| 2025-07-14 | 13F | AdvisorNet Financial, Inc | 2,571 | 1.78 | 85 | 10.53 | ||||
| 2025-07-30 | 13F | Avidian Wealth Solutions, LLC | 19,348 | 0.00 | 636 | 8.53 | ||||
| 2025-08-12 | 13F | Jpmorgan Chase & Co | 4,678,576 | 18.67 | 153,878 | 28.77 | ||||
| 2025-07-31 | 13F | LJI Wealth Management, LLC | 13,014 | 0.00 | 428 | 8.63 | ||||
| 2025-08-13 | 13F | Jones Financial Companies Lllp | 59 | 2 | ||||||
| 2025-07-18 | 13F | Truist Financial Corp | 100,112 | -1.09 | 3,293 | 7.34 | ||||
| 2025-08-08 | 13F | Capital Investment Advisory Services, LLC | 254 | -80.40 | 8 | -79.49 | ||||
| 2025-08-14 | 13F | Bank Of America Corp /de/ | 915,728 | 12.46 | 30,118 | 22.03 | ||||
| 2025-08-15 | 13F | Keel Point, LLC | 101,900 | 0.00 | 3,351 | 8.52 | ||||
| 2025-07-09 | 13F | Beacon Financial Group | 42,197 | 2.76 | 1,388 | 11.50 | ||||
| 2025-08-11 | 13F | Strategic Wealth Partners, Ltd. | 1,845 | 61 |