Mga Batayang Estadistika
| Saham Institusional (Jangka Panjang) | 41,620,468 - 95.74% (ex 13D/G) - change of -0.93MM shares -2.18% MRQ |
| Nilai Institusional (Jangka Panjang) | $ 1,097,023 USD ($1000) |
Kepemilikan Institusional dan Pemegang Saham
Kiniksa Pharmaceuticals, Ltd. (US:KNSA) memiliki 268 pemilik institusional dan pemegang saham yang telah mengajukan formulir 13D/G atau 13F kepada Komisi Bursa Efek (Securities Exchange Commission/SEC). Lembaga-lembaga ini memegang total 41,620,468 saham. Pemegang saham terbesar meliputi Rubric Capital Management LP, Vanguard Group Inc, Baker Bros. Advisors Lp, Tang Capital Management Llc, Fairmount Funds Management LLC, Acadian Asset Management Llc, VTSMX - Vanguard Total Stock Market Index Fund Investor Shares, Caption Management, LLC, Braidwell Lp, and Morgan Stanley .
Struktur kepemilikan institusional Kiniksa Pharmaceuticals, Ltd. (NasdaqGS:KNSA) menunjukkan posisi terkini di perusahaan oleh institusi dan dana, serta perubahan terbaru dalam ukuran posisi. Pemegang saham utama dapat mencakup investor individu, reksa dana, dana lindung nilai, atau institusi. Jadwal 13D menunjukkan bahwa investor memegang (atau pernah memegang) lebih dari 5% saham perusahaan dan bermaksud (atau pernah bermaksud) untuk secara aktif mengejar perubahan strategi bisnis. Jadwal 13G menunjukkan investasi pasif lebih dari 5%.
The share price as of September 5, 2025 is 35.71 / share. Previously, on September 9, 2024, the share price was 24.04 / share. This represents an increase of 48.54% over that period.

Skor Sentimen Dana
Skor Sentimen Dana (sebelumnya dikenal sebagai Skor Akumulasi Kepemilikan) menemukan saham-saham yang paling banyak dibeli oleh dana. Ini adalah hasil dari model kuantitatif multi-faktor yang canggih yang mengidentifikasi perusahaan dengan tingkat akumulasi institusional tertinggi. Model penilaian menggunakan kombinasi dari total peningkatan pemilik yang diungkapkan, perubahan dalam alokasi portofolio pada pemilik tersebut, dan metrik lainnya. Angka berkisar dari 0 hingga 100, dengan angka yang lebih tinggi menunjukkan tingkat akumulasi yang lebih tinggi dibandingkan dengan perusahaan sejenisnya, dan 50 adalah rata-ratanya.
Frekuensi Pembaruan: Setiap Hari
Lihat Ownership Explorer, yang menyediakan daftar perusahaan dengan peringkat tertinggi.
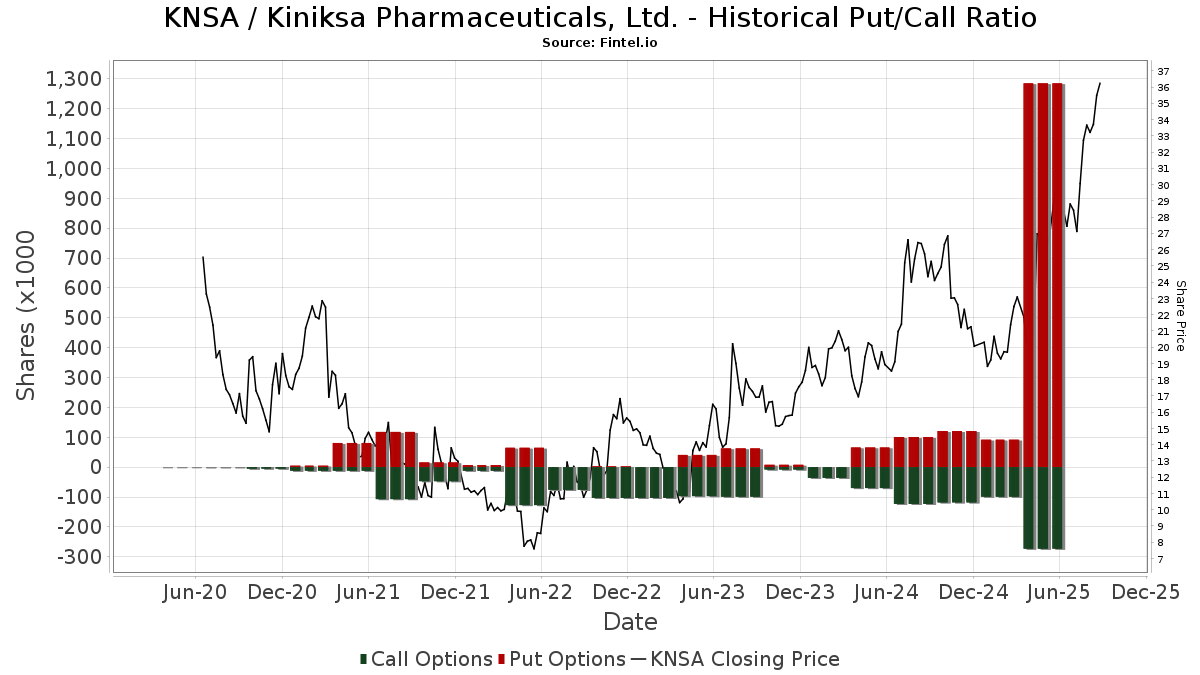
Rasio Put/Call Institusional
Selain melaporkan isu ekuitas dan utang standar, institusi dengan aset di bawah manajemen lebih dari 100 juta dolar AS juga harus mengungkapkan kepemilikan opsi put dan call mereka. Karena opsi put umumnya menunjukkan sentimen negatif, dan opsi call menunjukkan sentimen positif, kita dapat mengetahui sentimen institusional secara keseluruhan dengan memplot rasio put terhadap call. Grafik di sebelah kanan memplot rasio put/call historis untuk instrumen ini.
Menggunakan Rasio Put/Call sebagai indikator sentimen investor mengatasi salah satu kekurangan utama dari penggunaan total kepemilikan institusional, yaitu sejumlah besar aset yang dikelola diinvestasikan secara pasif untuk melacak indeks. Dana yang dikelola secara pasif biasanya tidak membeli opsi, sehingga indikator rasio put/call lebih akurat dalam melacak sentimen dana yang dikelola secara aktif.
Pengajuan 13D/G
Kami menyajikan pengajuan 13D/G secara terpisah dari pengajuan 13F karena perlakuan yang berbeda oleh SEC. Pengajuan 13D/G dapat diajukan oleh kelompok investor (dengan satu pemimpin), sedangkan pengajuan 13F tidak bisa. Hal ini mengakibatkan situasi di mana seorang investor dapat mengajukan 13D/G yang melaporkan satu nilai untuk total saham (mewakili semua saham yang dimiliki oleh kelompok investor), tetapi kemudian mengajukan 13F yang melaporkan nilai yang berbeda untuk total saham (mewakili kepemilikan mereka sendiri). Ini berarti bahwa kepemilikan saham dari pengajuan 13D/G dan pengajuan 13F seringkali tidak dapat dibandingkan secara langsung, sehingga kami menyajikannya secara terpisah.
Catatan: Mulai 16 Mei 2021, kami tidak lagi menampilkan pemilik yang belum mengajukan 13D/G dalam setahun terakhir. Sebelumnya, kami menampilkan riwayat lengkap pengajuan 13D/G. Secara umum, entitas yang diwajibkan untuk mengajukan pengajuan 13D/G harus mengajukan setidaknya setiap tahun sebelum mengirimkan pengajuan penutupan. Namun, terkadang dana keluar dari posisi tanpa mengirimkan pengajuan penutupan (misalnya, mereka menghentikan operasi), sehingga menampilkan riwayat lengkap terkadang menyebabkan kebingungan tentang kepemilikan saat ini. Untuk mencegah kebingungan, kami sekarang hanya menampilkan pemilik 'saat ini' - yaitu - pemilik yang telah mengajukan dalam setahun terakhir.
Upgrade to unlock premium data.
| Tanggal File | Formulir | Investor | Sebelumnya Saham |
Terbaru Saham |
Δ Saham (Persen) |
Kepemilikan (Persen) |
Δ Pagmamay-ari (Persen) |
|
|---|---|---|---|---|---|---|---|---|
| 2025-07-17 | BlackRock, Inc. | 2,262,066 | 418,151 | -81.51 | 1.00 | -81.48 | ||
| 2025-07-09 | Rubric Capital Management LP | 3,383,239 | 3,909,806 | 15.56 | 9.24 | 14.78 | ||
| 2025-04-04 | TANG CAPITAL MANAGEMENT LLC | 2,178,609 | 5.20 | |||||
| 2025-02-14 | Fairmount Funds Management LLC | 3,204,841 | 0 | -100.00 | 0.00 | -100.00 | ||
| 2024-11-14 | HILLHOUSE CAPITAL ADVISORS, LTD. | 3,879,426 | 1,582,635 | -59.20 | 3.90 | -60.61 | ||
| 2024-10-08 | BAKER BROS. ADVISORS LP | 2,903,030 | 3,151,029 | 8.54 | 7.70 | -16.30 |
Pengajuan 13F dan NPORT
Detail pada pengajuan 13F tersedia gratis. Detail pada pengajuan NP memerlukan keanggotaan premium. Baris berwarna hijau menunjukkan posisi baru. Baris berwarna merah menunjukkan posisi yang sudah ditutup. Klik tautan ini ikon untuk melihat riwayat transaksi selengkapnya.
Tingkatkan
untuk membuka data premium dan mengekspor ke Excel ![]() .
.
| Tanggal File | Sumber | Investor | Ketik | Presyo ng Avg (Silangan) |
Saham | Δ Saham (%) |
Dilaporkan Nilai ($1000) |
Nilai Δ (%) |
Alokasi Port (%) |
|
|---|---|---|---|---|---|---|---|---|---|---|
| 2025-05-15 | 13F | Kodai Capital Management LP | 185,364 | 4,117 | ||||||
| 2025-08-14 | 13F | Two Sigma Investments, Lp | 163,740 | 4,531 | ||||||
| 2025-07-29 | NP | VRTIX - Vanguard Russell 2000 Index Fund Institutional Shares | 192,763 | 8.78 | 5,274 | 46.76 | ||||
| 2025-08-11 | 13F | Vanguard Group Inc | 3,131,602 | -6.77 | 86,651 | 16.15 | ||||
| 2025-08-28 | NP | QCSTRX - Stock Account Class R1 | 1,029 | -99.70 | 28 | -99.63 | ||||
| 2025-05-28 | NP | QCEQRX - Equity Index Account Class R1 | 11,321 | 0.00 | 251 | 12.56 | ||||
| 2025-08-14 | 13F | Group One Trading, L.p. | 6,969 | 762.50 | 193 | 1,029.41 | ||||
| 2025-08-14 | 13F | Two Sigma Advisers, Lp | 85,400 | 2,363 | ||||||
| 2025-08-13 | 13F | Truvestments Capital Llc | 829 | 0.00 | 23 | 22.22 | ||||
| 2025-08-14 | 13F | Mercer Global Advisors Inc /adv | 7,271 | 201 | ||||||
| 2025-08-27 | NP | NAESX - Vanguard Small-Cap Index Fund Investor Shares | 931,201 | -1.19 | 25,766 | 23.11 | ||||
| 2025-08-26 | NP | DMCRX - Driehaus Micro Cap Growth Fund | 105,610 | 6.88 | 2,922 | 33.18 | ||||
| 2025-07-22 | 13F | Knights of Columbus Asset Advisors LLC | 32,622 | -47.91 | 903 | -35.11 | ||||
| 2025-08-06 | 13F | SOUTH STATE Corp | 179 | 0.00 | 5 | 33.33 | ||||
| 2025-04-25 | NP | VCSLX - Small Cap Index Fund | 2,870 | 0.00 | 58 | -7.94 | ||||
| 2025-08-13 | 13F | First Trust Advisors Lp | 28,438 | 787 | ||||||
| 2025-08-14 | 13F | Ameriprise Financial Inc | 32,257 | -13.45 | 893 | 7.86 | ||||
| 2025-08-14 | 13F | Sei Investments Co | 101,496 | 34.19 | 2,808 | 67.24 | ||||
| 2025-08-29 | NP | JAFEX - Total Stock Market Index Trust NAV | 714 | 7.05 | 20 | 35.71 | ||||
| 2025-08-29 | NP | JMCRX - James Micro Cap Fund | 6,909 | 0.00 | 191 | 24.84 | ||||
| 2025-08-18 | 13F/A | Hudson Bay Capital Management LP | 70,780 | -64.61 | 1,958 | -55.92 | ||||
| 2025-05-29 | NP | PACAX - Putnam Dynamic Asset Allocation Conservative Fund Class A shares | 1,063 | 0.00 | 24 | 9.52 | ||||
| 2025-05-14 | 13F | Susquehanna International Group, Llp | Call | 0 | -100.00 | 0 | -100.00 | |||
| 2025-08-14 | 13F | Ubs Oconnor Llc | 37,602 | -73.00 | 1,040 | -66.38 | ||||
| 2025-07-29 | NP | SECAX - SIIT Small Cap II Fund - Class A | 17,397 | 67.12 | 476 | 125.12 | ||||
| 2025-07-11 | 13F | Farther Finance Advisors, LLC | 199 | 0.00 | 6 | 25.00 | ||||
| 2025-08-08 | 13F | Geode Capital Management, Llc | 50,942 | -89.92 | 1,408 | -87.47 | ||||
| 2025-08-14 | 13F | ArrowMark Colorado Holdings LLC | 465,899 | -13.03 | 12,891 | 8.35 | ||||
| 2025-08-13 | 13F | Quadrature Capital Ltd | 10,440 | 289 | ||||||
| 2025-08-14 | 13F | SummitTX Capital, L.P. | 30,200 | 836 | ||||||
| 2025-05-15 | 13F | Hillhouse Capital Advisors, Ltd. | 0 | -100.00 | 0 | -100.00 | ||||
| 2025-06-26 | NP | TSMOX - TIAA-CREF Quant Small/Mid-Cap Equity Fund Retirement Class | 74,530 | 2,010 | ||||||
| 2025-08-12 | 13F | American Century Companies Inc | 20,333 | 0.00 | 563 | 24.61 | ||||
| 2025-08-19 | 13F | State of Wyoming | 0 | -100.00 | 0 | |||||
| 2025-08-14 | 13F | Hrt Financial Lp | 51,964 | 1 | ||||||
| 2025-07-29 | NP | SLPAX - Siit Small Cap Fund - Class A | 20,336 | 35.34 | 556 | 82.89 | ||||
| 2025-08-14 | 13F | Cubist Systematic Strategies, LLC | 657,475 | 213.17 | 18,192 | 290.22 | ||||
| 2025-08-14 | 13F | State Street Corp | 72,904 | -89.71 | 2,017 | -87.19 | ||||
| 2025-08-12 | 13F | Catalyst Funds Management Pty Ltd | 17,800 | 493 | ||||||
| 2025-08-14 | 13F | Royal Bank Of Canada | 223,208 | 8,966.13 | 6,175 | 11,127.27 | ||||
| 2025-08-14 | 13F | Qube Research & Technologies Ltd | 888,364 | 277.82 | 24,581 | 370.72 | ||||
| 2025-05-05 | 13F | Creekmur Asset Management LLC | 0 | -100.00 | 0 | |||||
| 2025-08-13 | 13F | Arrowstreet Capital, Limited Partnership | 735,417 | 20,349 | ||||||
| 2025-08-13 | 13F | New York State Common Retirement Fund | 514 | -96.63 | 0 | |||||
| 2025-08-14 | 13F | Dark Forest Capital Management Lp | 48,207 | 241.70 | 1,334 | 325.88 | ||||
| 2025-07-29 | NP | LONAX - Longboard Alternative Growth Fund Class A | 6,505 | 178 | ||||||
| 2025-06-30 | NP | VEXPX - VANGUARD EXPLORER FUND Investor Shares | 110,694 | 60.23 | 2,985 | 120.46 | ||||
| 2025-07-24 | 13F | IFP Advisors, Inc | 74 | 236.36 | 2 | |||||
| 2025-05-14 | 13F | Virtus ETF Advisers LLC | 0 | -100.00 | 0 | |||||
| 2025-07-31 | 13F | Caitong International Asset Management Co., Ltd | 45 | 1 | ||||||
| 2025-08-12 | 13F | EAM Investors, LLC | 105,747 | 2,926 | ||||||
| 2025-07-23 | 13F | Klp Kapitalforvaltning As | 6,600 | -17.50 | 183 | 2.82 | ||||
| 2025-08-06 | 13F | Fox Run Management, L.l.c. | 35,743 | 214.86 | 989 | 292.46 | ||||
| 2025-06-26 | NP | TIEIX - TIAA-CREF Equity Index Fund Institutional Class | 21,130 | 0.00 | 570 | 37.44 | ||||
| 2025-08-12 | 13F | Essex Investment Management Co Llc | 171,437 | -0.71 | 4,744 | 23.71 | ||||
| 2025-08-12 | 13F | Charles Schwab Investment Management Inc | 70,315 | -57.22 | 1,946 | -46.71 | ||||
| 2025-08-14 | 13F | Caption Management, LLC | Put | 1,142,500 | 3,708.33 | 31,613 | 4,646.55 | |||
| 2025-08-12 | 13F | Coldstream Capital Management Inc | 0 | -100.00 | 0 | |||||
| 2025-08-14 | 13F | Caption Management, LLC | Call | 230,000 | 666.67 | 6,364 | 855.56 | |||
| 2025-08-26 | NP | NORTHERN FUNDS - NORTHERN SMALL CAP CORE FUND Class K | 7,736 | 214 | ||||||
| 2025-05-28 | NP | TIAA SEPARATE ACCOUNT VA 1 - Stock Index Account Teachers Personal Annuity Individual Deferred Variable Annuity | 706 | 0.00 | 16 | 15.38 | ||||
| 2025-08-12 | 13F | Swiss National Bank | 64,600 | -10.15 | 1,787 | 11.97 | ||||
| 2025-08-11 | 13F | Universal- Beteiligungs- und Servicegesellschaft mbH | 9,140 | 253 | ||||||
| 2025-08-14 | 13F | Lion Point Capital, LP | 45,900 | 0.00 | 1,270 | 24.63 | ||||
| 2025-05-05 | 13F | Lindbrook Capital, Llc | 228 | 0.00 | 5 | 25.00 | ||||
| 2025-08-14 | 13F | HighVista Strategies LLC | 0 | -100.00 | 0 | |||||
| 2025-08-14 | 13F | Man Group plc | 0 | -100.00 | 0 | |||||
| 2025-08-14 | 13F | Verition Fund Management LLC | 21,368 | -23.67 | 591 | -4.83 | ||||
| 2025-08-11 | 13F | Citigroup Inc | 53,202 | 60.70 | 1,472 | 100.27 | ||||
| 2025-08-14 | 13F | Raymond James Financial Inc | 84,915 | -18.09 | 2,350 | 2.04 | ||||
| 2025-04-25 | NP | VFMFX - Vanguard U.S. Multifactor Fund Admiral Shares | 0 | -100.00 | 0 | -100.00 | ||||
| 2025-07-16 | 13F | Signaturefd, Llc | 947 | -4.05 | 26 | 23.81 | ||||
| 2025-08-27 | NP | VSTCX - Vanguard Strategic Small-Cap Equity Fund Investor Shares | 49,282 | -13.08 | 1,364 | 8.26 | ||||
| 2025-05-27 | NP | NOSGX - Northern Small Cap Value Fund | 10,696 | -5.14 | 238 | 6.28 | ||||
| 2025-05-28 | NP | Profunds - Profund Vp Ultrasmall-cap | 139 | -6.08 | 3 | 50.00 | ||||
| 2025-08-14 | 13F | Macquarie Group Ltd | 0 | -100.00 | 0 | -100.00 | ||||
| 2025-06-26 | NP | USCAX - Small Cap Stock Fund Shares | 69,127 | -19.47 | 1,864 | 10.82 | ||||
| 2025-08-14 | 13F | Federation des caisses Desjardins du Quebec | 0 | -100.00 | 0 | |||||
| 2025-08-12 | 13F | Proequities, Inc. | 0 | 0 | ||||||
| 2025-07-07 | 13F | Versant Capital Management, Inc | 166 | 5 | ||||||
| 2025-08-14 | 13F | Price T Rowe Associates Inc /md/ | 0 | -100.00 | 0 | |||||
| 2025-08-27 | NP | VQNPX - Vanguard Growth and Income Fund Investor Shares This fund is a listed as child fund of Vanguard Group Inc and if that institution has disclosed ownership in this security, then these positions will not be double counted when calculating total shares and total value | 15,800 | 652.38 | 437 | 850.00 | ||||
| 2025-08-14 | 13F | Oberweis Asset Management Inc/ | 305,200 | 28.67 | 8,445 | 60.29 | ||||
| 2025-06-23 | NP | PPNMX - SmallCap Growth Fund I R-3 | 3,857 | -5.09 | 104 | 31.65 | ||||
| 2025-07-09 | 13F | Pallas Capital Advisors LLC | 8,535 | 236 | ||||||
| 2025-09-04 | 13F/A | Advisor Group Holdings, Inc. | 1,127 | 31 | ||||||
| 2025-08-13 | 13F | Walleye Capital LLC | 119,885 | 39.07 | 3,317 | 73.30 | ||||
| 2025-05-27 | NP | NSIDX - Northern Small Cap Index Fund | 17,636 | 0.00 | 392 | 12.36 | ||||
| 2025-08-07 | 13F | Connor, Clark & Lunn Investment Management Ltd. | 623,689 | 56.02 | 17,257 | 94.38 | ||||
| 2025-07-29 | NP | ORSIX - NORTH SQUARE DYNAMIC SMALL CAP FUND CLASS I | 62,379 | 69.65 | 1,707 | 128.99 | ||||
| 2025-08-14 | 13F | Algert Global Llc | 232,187 | 0.75 | 6 | 20.00 | ||||
| 2025-08-27 | NP | VTSMX - Vanguard Total Stock Market Index Fund Investor Shares | 1,218,354 | 5.38 | 33,712 | 31.28 | ||||
| 2025-07-28 | 13F | Allianz Asset Management GmbH | 0 | -100.00 | 0 | |||||
| 2025-08-13 | 13F | Arizona State Retirement System | 9,857 | -8.02 | 273 | 14.29 | ||||
| 2025-08-14 | 13F | Point72 (DIFC) Ltd | 2,600 | 181.69 | 72 | 255.00 | ||||
| 2025-08-14 | 13F | Baker Bros. Advisors Lp | 2,824,669 | 0.23 | 78,159 | 24.87 | ||||
| 2025-05-30 | NP | NCGFX - New Covenant Growth Fund | 801 | 0.00 | 18 | 13.33 | ||||
| 2025-05-27 | NP | Columbia Funds Variable Series Trust II - Variable Portfolio - Partners Small Cap Growth Fund Class 1 | 5,014 | -0.65 | 111 | 12.12 | ||||
| 2025-08-14 | 13F | Millennium Management Llc | 1,019,968 | 20.40 | 28,223 | 50.01 | ||||
| 2025-08-14 | 13F | Bank Of America Corp /de/ | 272,629 | 13.76 | 7,544 | 41.73 | ||||
| 2025-08-07 | 13F | Acadian Asset Management Llc | 1,267,989 | 22.59 | 35 | 59.09 | ||||
| 2025-08-14 | 13F | D. E. Shaw & Co., Inc. | 791,305 | 98.95 | 21,895 | 147.88 | ||||
| 2025-08-14 | 13F | Point72 Asia (Singapore) Pte. Ltd. | 25,904 | 717 | ||||||
| 2025-08-01 | 13F | Teacher Retirement System Of Texas | 9,144 | -9.12 | 253 | 13.45 | ||||
| 2025-08-12 | 13F | Deutsche Bank Ag\ | 369,502 | -6.34 | 10,224 | 16.69 | ||||
| 2025-07-28 | NP | MSSM - Morgan Stanley Pathway Small-Mid Cap Equity ETF | 1,755 | 23.85 | 48 | 71.43 | ||||
| 2025-08-05 | 13F | Bank of New York Mellon Corp | 31,739 | -73.95 | 878 | -67.55 | ||||
| 2025-08-28 | NP | ASQIX - Small Company Fund Investor Class This fund is a listed as child fund of American Century Companies Inc and if that institution has disclosed ownership in this security, then these positions will not be double counted when calculating total shares and total value | 20,333 | 0.00 | 563 | 24.61 | ||||
| 2025-08-14 | 13F | Legato Capital Management LLC | 50,641 | -0.24 | 1,401 | 24.31 | ||||
| 2025-08-14 | 13F | PDT Partners, LLC | 102,886 | 121.70 | 2,847 | 176.31 | ||||
| 2025-08-13 | 13F | Amundi | 15,972 | 0.00 | 438 | 26.22 | ||||
| 2025-08-14 | 13F | Citadel Advisors Llc | 267,393 | 340.90 | 7,399 | 449.63 | ||||
| 2025-08-14 | 13F | Citadel Advisors Llc | Call | 32,200 | 166.12 | 891 | 232.09 | |||
| 2025-07-22 | NP | DSMFX - Destinations Small-Mid Cap Equity Fund Class I | 24,801 | 3.36 | 679 | 39.51 | ||||
| 2025-08-14 | 13F | Rubric Capital Management LP | 3,909,806 | 15.56 | 108,184 | 43.97 | ||||
| 2025-08-12 | 13F | Clear Street Markets Llc | 1,486 | 41 | ||||||
| 2025-08-14 | 13F | Opaleye Management Inc. | 0 | -100.00 | 0 | |||||
| 2025-07-29 | 13F | Nordea Investment Management Ab | 130,160 | 1.65 | 3,582 | 24.81 | ||||
| 2025-08-14 | 13F | Parkman Healthcare Partners LLC | 488,796 | -35.91 | 13,525 | -20.15 | ||||
| 2025-07-08 | 13F | Parallel Advisors, LLC | 527 | 26.68 | 15 | 55.56 | ||||
| 2025-08-12 | 13F | BlackRock, Inc. | 702,880 | -79.52 | 19,449 | -74.49 | ||||
| 2025-06-26 | NP | DFAS - Dimensional U.S. Small Cap ETF | 102,914 | 0.00 | 2,776 | 37.58 | ||||
| 2025-05-28 | NP | TLSTX - Stock Index Fund | 561 | 0.00 | 12 | 9.09 | ||||
| 2025-08-14 | 13F | Voya Investment Management Llc | 20,056 | -35.02 | 555 | -19.12 | ||||
| 2025-04-30 | 13F | M&t Bank Corp | 0 | -100.00 | 0 | -100.00 | ||||
| 2025-08-12 | 13F | Dimensional Fund Advisors Lp | 648,336 | -16.05 | 17,941 | 4.58 | ||||
| 2025-05-08 | 13F | Jefferies Financial Group Inc. | 0 | -100.00 | 0 | |||||
| 2025-07-22 | 13F | Gf Fund Management Co. Ltd. | 1,064 | 0.00 | 29 | 26.09 | ||||
| 2025-08-08 | 13F | Massachusetts Financial Services Co /ma/ | 64,232 | 1.25 | 1,777 | 26.21 | ||||
| 2025-07-14 | 13F | Toth Financial Advisory Corp | 10,700 | 296 | ||||||
| 2025-08-15 | 13F | Tower Research Capital LLC (TRC) | 25,275 | 1,539.11 | 699 | 1,955.88 | ||||
| 2025-08-08 | 13F | BIT Capital GmbH | 0 | -100.00 | 0 | -100.00 | ||||
| 2025-08-12 | 13F | Ameritas Investment Partners, Inc. | 0 | -100.00 | 0 | |||||
| 2025-07-30 | NP | IUSCX - Fisher Investments Institutional Group U.S. Small Cap Equity Fund | 50 | 0.00 | 1 | 0.00 | ||||
| 2025-05-29 | NP | PAEAX - Putnam Dynamic Asset Allocation Growth Fund Class A shares | 9,529 | -2.08 | 212 | 9.90 | ||||
| 2025-08-14 | 13F | Aster Capital Management (DIFC) Ltd | 21,398 | 1,369.64 | 592 | 1,941.38 | ||||
| 2025-08-08 | 13F | SG Americas Securities, LLC | 134,404 | 1,746.72 | 4 | |||||
| 2025-08-07 | 13F | Hughes Financial Services, LLC | 0 | -100.00 | 0 | |||||
| 2025-06-26 | NP | TISEX - TIAA-CREF Quant Small-Cap Equity Fund Institutional Class | 331,000 | -2.43 | 8,927 | 34.28 | ||||
| 2025-05-30 | NP | SLLAX - SIMT Small Cap Fund Class F | 10,247 | -23.11 | 228 | -13.69 | ||||
| 2025-08-06 | 13F | Sterling Capital Management LLC | 0 | -100.00 | 0 | |||||
| 2025-08-14 | 13F | California State Teachers Retirement System | 31,498 | -8.23 | 872 | 14.30 | ||||
| 2025-08-14 | 13F | State Of Wisconsin Investment Board | 84,067 | -16.80 | 2,326 | 3.65 | ||||
| 2025-08-14 | 13F | Aqr Capital Management Llc | 398,232 | -19.02 | 11,019 | 0.89 | ||||
| 2025-08-13 | 13F | Wealthquest Corp | 0 | -100.00 | 0 | -100.00 | ||||
| 2025-08-13 | 13F | Jump Financial, LLC | 226,038 | 6,254 | ||||||
| 2025-08-14 | 13F | Braidwell Lp | 1,102,580 | -43.83 | 30,508 | -30.02 | ||||
| 2025-06-26 | NP | TISBX - TIAA-CREF Small-Cap Blend Index Fund Institutional Class | 50,664 | 0.00 | 1,366 | 37.56 | ||||
| 2025-07-14 | 13F | UMA Financial Services, Inc. | 31 | 1 | ||||||
| 2025-08-13 | 13F | Virtus Investment Advisers, Inc. | 16,026 | -10.11 | 443 | 12.15 | ||||
| 2025-05-14 | 13F | Bellevue Group AG | 0 | -100.00 | 0 | |||||
| 2025-08-13 | 13F | Victory Capital Management Inc | 58,964 | 10.59 | 1,632 | 37.75 | ||||
| 2025-05-28 | NP | Profunds - Profund Vp Small-cap | 87 | -8.42 | 2 | 0.00 | ||||
| 2025-08-08 | 13F | Intech Investment Management Llc | 0 | -100.00 | 0 | |||||
| 2025-07-29 | NP | SMXAX - SIIT Extended Market Index Fund - Class A | 6,700 | 0.00 | 183 | 35.56 | ||||
| 2025-07-15 | 13F | SJS Investment Consulting Inc. | 37 | 1 | ||||||
| 2025-08-11 | 13F | Martingale Asset Management L P | 52,434 | 4.87 | 1,451 | 30.63 | ||||
| 2025-08-12 | 13F | Jpmorgan Chase & Co | 135,282 | 16.21 | 3,743 | 44.80 | ||||
| 2025-08-13 | 13F | Quantbot Technologies LP | 1,565 | 43 | ||||||
| 2025-08-13 | 13F | Russell Investments Group, Ltd. | 61,095 | -26.53 | 1,705 | -9.36 | ||||
| 2025-08-07 | 13F | Zurcher Kantonalbank (Zurich Cantonalbank) | 15,487 | 0.00 | 429 | 24.78 | ||||
| 2025-08-13 | 13F | MetLife Investment Management, LLC | 0 | -100.00 | 0 | |||||
| 2025-08-14 | 13F | Tang Capital Management Llc | 2,328,609 | 9.91 | 64,433 | 36.93 | ||||
| 2025-07-21 | 13F | Mirae Asset Global Investments Co., Ltd. | 1,635 | 12.76 | 46 | 36.36 | ||||
| 2025-08-13 | 13F | Hsbc Holdings Plc | 0 | -100.00 | 0 | |||||
| 2025-08-14 | 13F | Jain Global LLC | 55,554 | 1,537 | ||||||
| 2025-08-07 | 13F | Allworth Financial LP | 64 | 2 | ||||||
| 2025-08-27 | 13F/A | Squarepoint Ops LLC | 416,572 | 186.17 | 11,527 | 256.51 | ||||
| 2025-08-21 | NP | MXMTX - Great-West Small Cap Growth Fund Investor Class | 46,859 | 1.73 | 1,297 | 26.81 | ||||
| 2025-08-14 | 13F | Globeflex Capital L P | 88,596 | 0.00 | 2,451 | 24.61 | ||||
| 2025-08-12 | 13F | Rhumbline Advisers | 7,286 | -88.38 | 202 | -85.56 | ||||
| 2025-08-12 | 13F | Axq Capital, Lp | 10,455 | 289 | ||||||
| 2025-06-26 | NP | DFUS - Dimensional U.S. Equity ETF | 9,628 | 17.31 | 260 | 61.88 | ||||
| 2025-05-28 | NP | TLEQX - Small-Cap Equity Fund | 6,595 | -3.92 | 146 | 8.15 | ||||
| 2025-08-07 | 13F | Campbell & CO Investment Adviser LLC | 0 | -100.00 | 0 | |||||
| 2025-08-14 | 13F | Goldman Sachs Group Inc | 383,668 | 145.43 | 10,616 | 205.76 | ||||
| 2025-07-28 | NP | IBBQ - Invesco Nasdaq Biotechnology ETF This fund is a listed as child fund of Invesco Ltd. and if that institution has disclosed ownership in this security, then these positions will not be double counted when calculating total shares and total value | 1,658 | 4.67 | 45 | 40.63 | ||||
| 2025-05-29 | NP | JAFVX - Strategic Equity Allocation Trust Series NAV | 5,572 | 0.00 | 124 | 11.82 | ||||
| 2025-08-08 | 13F | Hartland & Co., LLC | 795 | 22 | ||||||
| 2025-08-13 | 13F | Baird Financial Group, Inc. | 55,312 | 1,530 | ||||||
| 2025-07-15 | 13F | Fortitude Family Office, LLC | 249 | 0.00 | 7 | 20.00 | ||||
| 2025-08-14 | 13F | Susquehanna Fundamental Investments, Llc | 60,125 | -38.64 | 1,664 | -23.58 | ||||
| 2025-08-08 | 13F | Larson Financial Group LLC | 0 | -100.00 | 0 | |||||
| 2025-08-15 | 13F | Soleus Capital Management, L.P. | 254,689 | -45.75 | 7,047 | -32.42 | ||||
| 2025-08-26 | NP | AFMCX - Acuitas US Microcap Fund Institutional Shares | 7,131 | -49.80 | 197 | -37.46 | ||||
| 2025-08-14 | 13F | Fred Alger Management, Llc | 0 | -100.00 | 0 | |||||
| 2025-08-13 | 13F | EverSource Wealth Advisors, LLC | 911 | 140.37 | 25 | 212.50 | ||||
| 2025-07-25 | 13F | Cwm, Llc | 20,715 | -6.33 | 1 | |||||
| 2025-05-14 | 13F | Smartleaf Asset Management LLC | 0 | -100.00 | 0 | |||||
| 2025-08-14 | 13F/A | Barclays Plc | 12,052 | -78.22 | 0 | -100.00 | ||||
| 2025-06-26 | NP | DCOR - Dimensional US Core Equity 1 ETF | 2,100 | 0.00 | 57 | 36.59 | ||||
| 2025-08-08 | 13F | Police & Firemen's Retirement System of New Jersey | 0 | -100.00 | 0 | |||||
| 2025-08-12 | 13F | Franklin Resources Inc | 108,574 | 62.19 | 3,004 | 102.15 | ||||
| 2025-08-01 | 13F | Y-Intercept (Hong Kong) Ltd | 59,564 | 1,648 | ||||||
| 2025-08-12 | 13F | Nuveen, LLC | 0 | -100.00 | 0 | |||||
| 2025-08-12 | 13F | Trexquant Investment LP | 456,987 | 93.24 | 12,645 | 140.75 | ||||
| 2025-08-14 | 13F | Nebula Research & Development LLC | 69,884 | 82.40 | 1,934 | 127.41 | ||||
| 2025-07-29 | 13F | Cannon Global Investment Management, LLC | 17,300 | 479 | ||||||
| 2025-08-08 | 13F | Principal Financial Group Inc | 0 | -100.00 | 0 | |||||
| 2025-08-27 | NP | OHIO NATIONAL FUND INC - ON BlackRock Advantage Small Cap Growth Portfolio | 1,408 | -89.38 | 39 | -87.07 | ||||
| 2025-08-14 | 13F | Gotham Asset Management, LLC | 14,676 | 406 | ||||||
| 2025-08-08 | 13F | Pnc Financial Services Group, Inc. | 3,488 | -23.22 | 97 | -4.00 | ||||
| 2025-08-04 | 13F | Strs Ohio | 0 | -100.00 | 0 | |||||
| 2025-08-11 | 13F | Nomura Asset Management Co Ltd | 0 | 0 | ||||||
| 2025-08-14 | 13F | MIRAE ASSET GLOBAL ETFS HOLDINGS Ltd. | 0 | -100.00 | 0 | |||||
| 2025-08-14 | 13F | Vestal Point Capital, LP | 0 | -100.00 | 0 | |||||
| 2025-04-25 | NP | VFMO - Vanguard U.S. Momentum Factor ETF ETF Shares | 0 | -100.00 | 0 | -100.00 | ||||
| 2025-08-13 | 13F | State Board Of Administration Of Florida Retirement System | 0 | -100.00 | 0 | |||||
| 2025-08-14 | 13F | Janus Henderson Group Plc | 12,179 | 0.00 | 337 | 20.00 | ||||
| 2025-06-26 | NP | DFAC - Dimensional U.S. Core Equity 2 ETF | 88,003 | 3.72 | 2,373 | 42.69 | ||||
| 2025-06-26 | NP | KCXIX - Knights of Columbus U.S. All Cap Index Fund I Shares | 150 | 4.17 | 4 | 100.00 | ||||
| 2025-08-14 | 13F | Ieq Capital, Llc | 46,916 | 7.54 | 1,298 | 34.09 | ||||
| 2025-08-14 | 13F | Granahan Investment Management Inc/ma | 310,992 | -14.07 | 8,605 | 7.07 | ||||
| 2025-08-14 | 13F | Schonfeld Strategic Advisors LLC | 68,751 | 37.92 | 1,902 | 71.82 | ||||
| 2025-08-28 | 13F | China Universal Asset Management Co., Ltd. | 8,503 | 0.91 | 235 | 25.67 | ||||
| 2025-08-14 | 13F | Wellington Management Group Llp | 113,990 | 25.22 | 3,154 | 56.06 | ||||
| 2025-08-11 | 13F | Great Lakes Advisors, Llc | 126,789 | 3,508 | ||||||
| 2025-08-12 | 13F | Prudential Financial Inc | 0 | -100.00 | 0 | |||||
| 2025-08-14 | 13F | Tudor Investment Corp Et Al | 21,103 | 2.34 | 584 | 27.57 | ||||
| 2025-07-29 | NP | VHCIX - Vanguard Health Care Index Fund Admiral Shares | 117,748 | 1.05 | 3,222 | 36.31 | ||||
| 2025-08-28 | NP | OBMCX - Oberweis Micro-Cap Fund Investor Class | 305,200 | 28.67 | 8,445 | 60.29 | ||||
| 2025-06-23 | NP | UAPIX - Ultrasmall-cap Profund Investor Class | 394 | -29.77 | 11 | 0.00 | ||||
| 2025-08-13 | 13F | Kilter Group LLC | 61 | 2 | ||||||
| 2025-07-18 | 13F | Robeco Institutional Asset Management B.V. | 8,436 | 233 | ||||||
| 2025-08-04 | 13F | Amalgamated Bank | 0 | -100.00 | 0 | |||||
| 2025-08-12 | 13F | Legal & General Group Plc | 30,858 | -22.72 | 854 | -3.72 | ||||
| 2025-08-14 | 13F | Mariner, LLC | 12,521 | 9.44 | 346 | 36.22 | ||||
| 2025-08-07 | 13F | ProShare Advisors LLC | 0 | -100.00 | 0 | |||||
| 2025-08-14 | 13F | Quantessence Capital LLC | 27,066 | 749 | ||||||
| 2025-08-14 | 13F | Fairmount Funds Management LLC | 1,772,839 | 60.84 | 49,054 | 100.38 | ||||
| 2025-08-13 | 13F | Healthcare Of Ontario Pension Plan Trust Fund | 67,500 | 1,868 | ||||||
| 2025-07-29 | NP | VRTTX - Vanguard Russell 3000 Index Fund Institutional Shares | 3,245 | 0.00 | 89 | 35.38 | ||||
| 2025-08-14 | 13F | Daiwa Securities Group Inc. | 139 | 0.00 | 0 | |||||
| 2025-08-07 | 13F | Hennion & Walsh Asset Management, Inc. | 133,014 | -27.76 | 3,680 | -10.00 | ||||
| 2025-08-28 | NP | SPWIX - Simt Small Cap Growth Fund Class I | 10,388 | -67.66 | 287 | -64.21 | ||||
| 2025-08-14 | 13F | Lazard Asset Management Llc | 15,181 | 428.77 | 0 | |||||
| 2025-04-29 | NP | SVYAX - SIIT U.S. Managed Volatility Fund - Class A | 7,666 | -21.66 | 155 | -28.24 | ||||
| 2025-07-14 | 13F | GAMMA Investing LLC | 976 | -21.16 | 27 | 0.00 | ||||
| 2025-06-30 | NP | PRFZ - Invesco FTSE RAFI US 1500 Small-Mid ETF This fund is a listed as child fund of Invesco Ltd. and if that institution has disclosed ownership in this security, then these positions will not be double counted when calculating total shares and total value | 10,549 | 285 | ||||||
| 2025-07-10 | 13F | Wealth Enhancement Advisory Services, Llc | 15,410 | 13.61 | 430 | 42.52 | ||||
| 2025-08-13 | 13F | Pictet Asset Management Holding SA | 984,597 | -13.17 | 27,244 | 8.18 | ||||
| 2025-06-26 | NP | USMIX - Extended Market Index Fund | 4,768 | -2.57 | 129 | 34.74 | ||||
| 2025-08-11 | 13F | Citigroup Inc | Call | 0 | -100.00 | 0 | -100.00 | |||
| 2025-08-13 | 13F | Cerity Partners LLC | 41,904 | 2.94 | 1,159 | 28.21 | ||||
| 2025-06-26 | NP | KCSIX - Knights of Columbus Small Cap Fund I Shares | 57,431 | 1.43 | 1,549 | 39.59 | ||||
| 2025-08-13 | 13F | Marshall Wace, Llp | 76,347 | 2,113 | ||||||
| 2025-08-14 | 13F | Polymer Capital Management (US) LLC | 10,486 | 14.70 | 290 | 42.86 | ||||
| 2025-08-14 | 13F | Artia Global Partners LP | 29,200 | 808 | ||||||
| 2025-07-18 | 13F | Ami Asset Management Corp | 43,141 | -44.47 | 1,194 | -30.84 | ||||
| 2025-08-12 | 13F | Hillsdale Investment Management Inc. | 200,574 | 5,550 | ||||||
| 2025-08-27 | NP | ALLIANZ VARIABLE INSURANCE PRODUCTS TRUST - AZL DFA U.S. Core Equity Fund | 2,011 | 56 | ||||||
| 2025-08-11 | 13F | Citigroup Inc | Put | 0 | -100.00 | 0 | -100.00 | |||
| 2025-08-14 | 13F | Laurion Capital Management LP | 13,170 | 364 | ||||||
| 2025-05-29 | NP | PABAX - Putnam Dynamic Asset Allocation Balanced Fund Class A shares | 6,940 | 0.17 | 154 | 12.41 | ||||
| 2025-08-14 | 13F | Fmr Llc | 806,898 | 0.34 | 22,327 | 25.01 | ||||
| 2025-08-14 | 13F | Jane Street Group, Llc | Put | 28,000 | 775 | |||||
| 2025-08-14 | 13F | UBS Group AG | 30,616 | -38.75 | 847 | -23.69 | ||||
| 2025-08-14 | 13F | Jane Street Group, Llc | Call | 11,300 | 313 | |||||
| 2025-08-14 | 13F | Jane Street Group, Llc | 558,392 | 331.89 | 15,451 | 438.14 | ||||
| 2025-08-14 | 13F | ADAR1 Capital Management, LLC | 56,540 | 36.53 | 1,564 | 70.18 | ||||
| 2025-05-14 | 13F | Van Hulzen Asset Management, LLC | 0 | -100.00 | 0 | |||||
| 2025-05-30 | NP | SVOAX - Simt Us Managed Volatility Fund Class F | 4,012 | -28.18 | 89 | -19.09 | ||||
| 2025-08-06 | 13F | Savant Capital, LLC | 14,385 | 398 | ||||||
| 2025-06-23 | NP | SLPIX - Small-cap Profund Investor Class | 37 | -11.90 | 1 | |||||
| 2025-08-07 | 13F | Sound View Wealth Advisors Group, LLC | 12,505 | -14.68 | 346 | 6.46 | ||||
| 2025-08-14 | 13F/A | Skopos Labs, Inc. | 1,163 | 724.82 | 32 | 966.67 | ||||
| 2025-08-27 | NP | BBGSX - Bridge Builder Small/Mid Cap Growth Fund | 1,357 | -81.76 | 38 | -77.58 | ||||
| 2025-08-12 | 13F | Steward Partners Investment Advisory, Llc | 2,266 | 0.71 | 63 | 26.53 | ||||
| 2025-04-17 | NP | FLSPX - SPECTRUM FUND Retail Class | 0 | -100.00 | 0 | -100.00 | ||||
| 2025-08-28 | NP | SFLO - VictoryShares Small Cap Free Cash Flow ETF | 54,137 | 11.69 | 1,498 | 39.13 | ||||
| 2025-08-14 | 13F | Ubs Asset Management Americas Inc | 104,705 | 87.05 | 2,897 | 133.07 | ||||
| 2025-07-31 | 13F/A | Avion Wealth | 43 | 0 | ||||||
| 2025-08-08 | 13F | Creative Planning | 12,942 | 358 | ||||||
| 2025-05-29 | NP | JAEWX - Small Cap Index Trust NAV | 7,644 | -0.97 | 170 | 11.18 | ||||
| 2025-08-13 | 13F | ExodusPoint Capital Management, LP | 133,276 | 311.57 | 4 | |||||
| 2025-08-14 | 13F | Bnp Paribas Arbitrage, Sa | 425,947 | 88.95 | 11,786 | 135.42 | ||||
| 2025-07-29 | NP | VRTGX - Vanguard Russell 2000 Growth Index Fund Institutional Shares | 33,651 | -4.60 | 921 | 28.67 | ||||
| 2025-06-27 | NP | RSSL - Global X Russell 2000 ETF | 23,385 | 6.95 | 631 | 47.20 | ||||
| 2025-04-29 | NP | PMIYX - Putnam Income Strategies Portfolio - | 365 | -1.08 | 7 | -12.50 | ||||
| 2025-08-01 | 13F | Peregrine Capital Management Llc | 288,636 | -6.65 | 7,987 | 16.30 | ||||
| 2025-08-27 | NP | VITNX - Vanguard Institutional Total Stock Market Index Fund Institutional Shares This fund is a listed as child fund of Vanguard Group Inc and if that institution has disclosed ownership in this security, then these positions will not be double counted when calculating total shares and total value | 19,703 | 12.30 | 545 | 40.10 | ||||
| 2025-08-11 | 13F | Rice Hall James & Associates, Llc | 638,233 | 2.19 | 17,660 | 27.31 | ||||
| 2025-08-14 | 13F | Weiss Asset Management LP | 111,710 | 3,091 | ||||||
| 2025-08-27 | NP | VBINX - Vanguard Balanced Index Fund Investor Shares | 21,265 | 0.00 | 588 | 24.58 | ||||
| 2025-03-27 | NP | SUNAMERICA SERIES TRUST - SA Small Cap Index Portfolio Class 1 | 829 | 0.00 | 16 | -11.11 | ||||
| 2025-05-14 | 13F | Brown Brothers Harriman & Co | 0 | -100.00 | 0 | |||||
| 2025-08-14 | 13F | Voloridge Investment Management, Llc | 333,923 | 412.86 | 9,240 | 538.93 | ||||
| 2025-08-12 | 13F | Corebridge Financial, Inc. | 0 | -100.00 | 0 | |||||
| 2025-07-24 | 13F | Us Bancorp \de\ | 1,380 | -6.31 | 38 | 18.75 | ||||
| 2025-07-22 | 13F | Gsa Capital Partners Llp | 20,418 | 1 | ||||||
| 2025-08-07 | 13F | Los Angeles Capital Management Llc | 8,037 | -81.98 | 222 | -77.58 | ||||
| 2025-08-12 | 13F | Aigen Investment Management, Lp | 9,410 | 260 | ||||||
| 2025-08-15 | 13F | Morgan Stanley | 1,066,279 | -0.94 | 29,504 | 23.41 | ||||
| 2025-07-31 | 13F | Asset Management One Co., Ltd. | 13,470 | 624.19 | 373 | 807.32 | ||||
| 2025-08-08 | 13F | SBI Securities Co., Ltd. | 110 | 0.00 | 3 | 50.00 | ||||
| 2025-08-14 | 13F | Engineers Gate Manager LP | 59,275 | 1,640 | ||||||
| 2025-06-26 | NP | DFAU - Dimensional US Core Equity Market ETF | 6,896 | 0.00 | 186 | 37.04 | ||||
| 2025-07-25 | 13F | Allspring Global Investments Holdings, LLC | 18,941 | -61.14 | 524 | -51.57 | ||||
| 2025-05-15 | 13F | Woodline Partners LP | 0 | -100.00 | 0 | |||||
| 2025-08-14 | 13F | Susquehanna International Group, Llp | 139,782 | 157.53 | 3,868 | 220.91 | ||||
| 2025-08-14 | 13F | Citadel Advisors Llc | Put | 0 | -100.00 | 0 | ||||
| 2025-08-14 | 13F | Susquehanna International Group, Llp | Put | 115,400 | 3,193 | |||||
| 2025-07-25 | NP | PMSAX - Global Multi-Strategy Fund Class A | 68 | 2 | ||||||
| 2025-08-11 | 13F | Covestor Ltd | 12 | -33.33 | 0 | |||||
| 2025-08-06 | 13F | True Wealth Design, LLC | 687 | 29.87 | 19 | 72.73 | ||||
| 2025-08-14 | 13F | Point72 Hong Kong Ltd | 11,839 | 328 | ||||||
| 2025-08-28 | NP | STMSX - Simt Tax-managed Small/mid Cap Fund Class F | 31,021 | 0.00 | 858 | 24.71 | ||||
| 2025-08-13 | 13F | Fisher Asset Management, LLC | 102,259 | -29.11 | 2,830 | -11.68 | ||||
| 2025-07-31 | 13F | Linden Thomas Advisory Services, LLC | 116,115 | -0.99 | 3,213 | 23.35 | ||||
| 2025-08-14 | 13F | Manufacturers Life Insurance Company, The | 0 | -100.00 | 0 | |||||
| 2025-08-27 | NP | VSEQX - Vanguard Strategic Equity Fund Investor Shares | 120,051 | 0.00 | 3,322 | 24.57 | ||||
| 2025-08-14 | 13F | Balyasny Asset Management Llc | 0 | -100.00 | 0 | |||||
| 2025-08-13 | 13F | Advantage Alpha Capital Partners LP | 11,020 | -18.95 | 305 | 1.00 | ||||
| 2025-08-14 | 13F | Silverarc Capital Management, Llc | 75,959 | -13.89 | 2,102 | 7.25 | ||||
| 2025-08-27 | NP | VISGX - Vanguard Small-Cap Growth Index Fund Investor Shares | 518,472 | -1.74 | 14,346 | 22.43 | ||||
| 2025-08-14 | 13F | Wells Fargo & Company/mn | 5,117 | -74.96 | 142 | -68.87 | ||||
| 2025-08-11 | 13F | TD Waterhouse Canada Inc. | 115 | 15.00 | 3 | 50.00 | ||||
| 2025-08-14 | 13F | Driehaus Capital Management Llc | 647,980 | 6.00 | 17,930 | 32.06 | ||||
| 2025-07-31 | 13F | Nisa Investment Advisors, Llc | 105 | -31.82 | 3 | -33.33 | ||||
| 2025-08-14 | 13F | Point72 Asset Management, L.P. | 848,549 | -26.18 | 23,479 | -8.03 | ||||
| 2025-08-14 | 13F | Alliancebernstein L.p. | 0 | -100.00 | 0 | |||||
| 2025-08-25 | NP | QWVOX - Clearwater Small Companies Fund | 34,222 | -49.89 | 947 | -49.92 | ||||
| 2025-05-15 | 13F | SRS Capital Advisors, Inc. | 0 | -100.00 | 0 | |||||
| 2025-05-30 | NP | SEIS - SEI Select Small Cap ETF | 0 | -100.00 | 0 | -100.00 | ||||
| 2025-08-13 | 13F | Twin Peaks Wealth Advisors, LLC | 1 | 0 | ||||||
| 2025-08-13 | 13F | Invesco Ltd. | 20,289 | -39.42 | 561 | -24.50 | ||||
| 2025-05-12 | 13F | National Bank Of Canada /fi/ | 0 | -100.00 | 0 | |||||
| 2025-08-13 | 13F | Northern Trust Corp | 54,587 | -81.25 | 1,510 | -76.65 |