Mga Batayang Estadistika
| Pemilik Institusional | 173 total, 173 long only, 0 short only, 0 long/short - change of 0.00% MRQ |
| Alokasi Portofolio Rata-rata | 0.2010 % - change of -12.27% MRQ |
| Saham Institusional (Jangka Panjang) | 10,050,819 (ex 13D/G) - change of -0.21MM shares -2.05% MRQ |
| Nilai Institusional (Jangka Panjang) | $ 506,248 USD ($1000) |
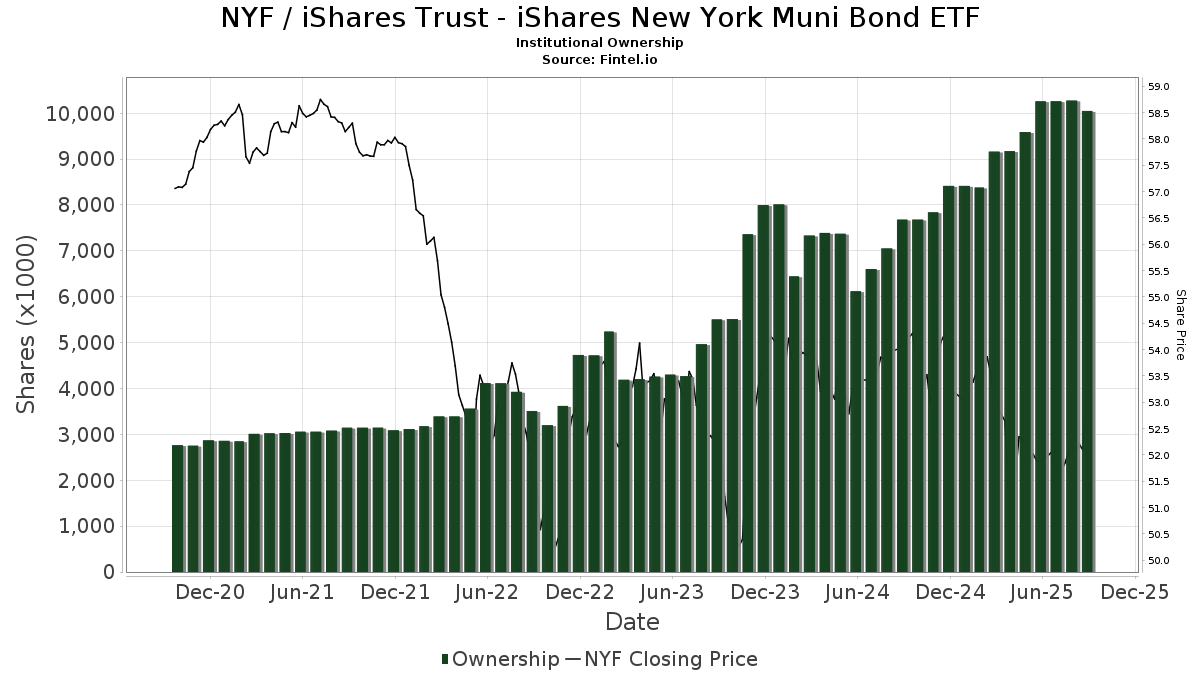
Kepemilikan Institusional dan Pemegang Saham
iShares Trust - iShares New York Muni Bond ETF (US:NYF) memiliki 173 pemilik institusional dan pemegang saham yang telah mengajukan formulir 13D/G atau 13F kepada Komisi Bursa Efek (Securities Exchange Commission/SEC). Lembaga-lembaga ini memegang total 10,050,819 saham. Pemegang saham terbesar meliputi Tiaa Trust, National Association, High Probability Advisors, LLC, Bank Of America Corp /de/, Morgan Stanley, Fmr Llc, Facet Wealth, Inc., HighTower Advisors, LLC, Adviser Investments LLC, Jane Street Group, Llc, and Satovsky Asset Management Llc .
Struktur kepemilikan institusional iShares Trust - iShares New York Muni Bond ETF (ARCA:NYF) menunjukkan posisi terkini di perusahaan oleh institusi dan dana, serta perubahan terbaru dalam ukuran posisi. Pemegang saham utama dapat mencakup investor individu, reksa dana, dana lindung nilai, atau institusi. Jadwal 13D menunjukkan bahwa investor memegang (atau pernah memegang) lebih dari 5% saham perusahaan dan bermaksud (atau pernah bermaksud) untuk secara aktif mengejar perubahan strategi bisnis. Jadwal 13G menunjukkan investasi pasif lebih dari 5%.
The share price as of September 5, 2025 is 52.53 / share. Previously, on September 6, 2024, the share price was 54.18 / share. This represents a decline of 3.05% over that period.
Skor Sentimen Dana
Skor Sentimen Dana (sebelumnya dikenal sebagai Skor Akumulasi Kepemilikan) menemukan saham-saham yang paling banyak dibeli oleh dana. Ini adalah hasil dari model kuantitatif multi-faktor yang canggih yang mengidentifikasi perusahaan dengan tingkat akumulasi institusional tertinggi. Model penilaian menggunakan kombinasi dari total peningkatan pemilik yang diungkapkan, perubahan dalam alokasi portofolio pada pemilik tersebut, dan metrik lainnya. Angka berkisar dari 0 hingga 100, dengan angka yang lebih tinggi menunjukkan tingkat akumulasi yang lebih tinggi dibandingkan dengan perusahaan sejenisnya, dan 50 adalah rata-ratanya.
Frekuensi Pembaruan: Setiap Hari
Lihat Ownership Explorer, yang menyediakan daftar perusahaan dengan peringkat tertinggi.
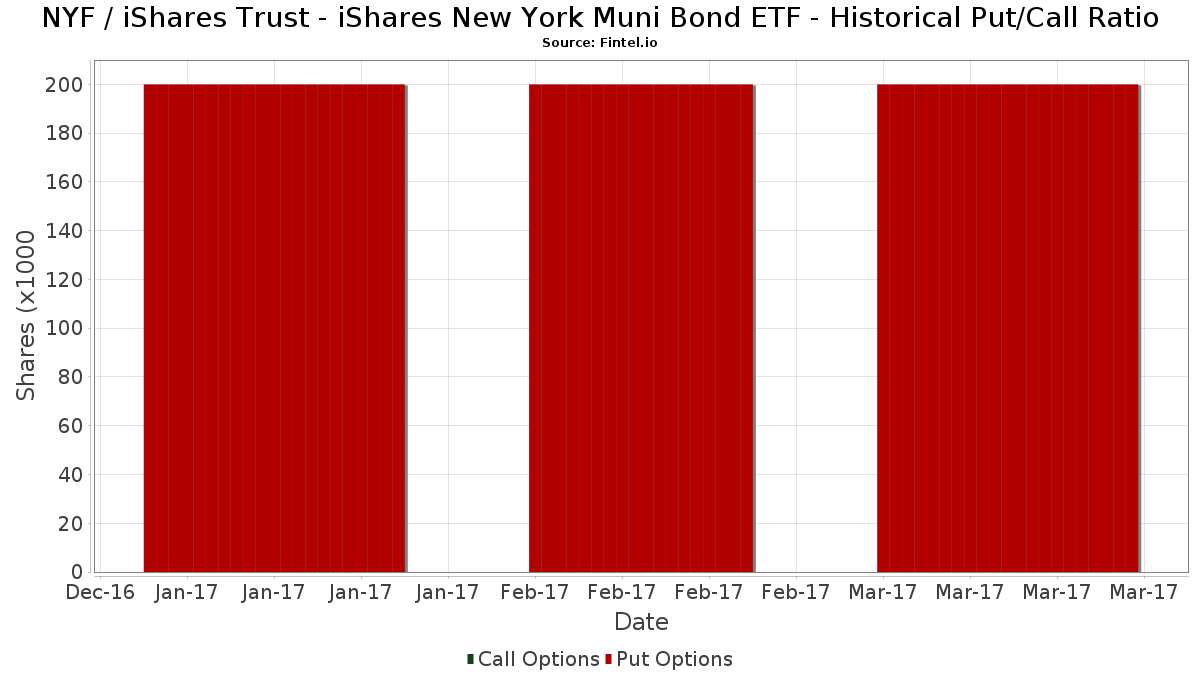
Rasio Put/Call Institusional
Selain melaporkan isu ekuitas dan utang standar, institusi dengan aset di bawah manajemen lebih dari 100 juta dolar AS juga harus mengungkapkan kepemilikan opsi put dan call mereka. Karena opsi put umumnya menunjukkan sentimen negatif, dan opsi call menunjukkan sentimen positif, kita dapat mengetahui sentimen institusional secara keseluruhan dengan memplot rasio put terhadap call. Grafik di sebelah kanan memplot rasio put/call historis untuk instrumen ini.
Menggunakan Rasio Put/Call sebagai indikator sentimen investor mengatasi salah satu kekurangan utama dari penggunaan total kepemilikan institusional, yaitu sejumlah besar aset yang dikelola diinvestasikan secara pasif untuk melacak indeks. Dana yang dikelola secara pasif biasanya tidak membeli opsi, sehingga indikator rasio put/call lebih akurat dalam melacak sentimen dana yang dikelola secara aktif.
Pengajuan 13F dan NPORT
Detail pada pengajuan 13F tersedia gratis. Detail pada pengajuan NP memerlukan keanggotaan premium. Baris berwarna hijau menunjukkan posisi baru. Baris berwarna merah menunjukkan posisi yang sudah ditutup. Klik tautan ini ikon untuk melihat riwayat transaksi selengkapnya.
Tingkatkan
untuk membuka data premium dan mengekspor ke Excel ![]() .
.
| Tanggal File | Sumber | Investor | Ketik | Presyo ng Avg (Silangan) |
Saham | Δ Saham (%) |
Dilaporkan Nilai ($1000) |
Nilai Δ (%) |
Alokasi Port (%) |
|
|---|---|---|---|---|---|---|---|---|---|---|
| 2025-08-12 | 13F | Deutsche Bank Ag\ | 3,329 | -10.39 | 174 | -11.28 | ||||
| 2025-08-08 | 13F | Creative Planning | 68,226 | 30.56 | 3,557 | 29.30 | ||||
| 2025-07-15 | 13F | North Star Investment Management Corp. | 7,050 | 0.00 | 368 | -1.08 | ||||
| 2025-07-15 | 13F | Level Financial Advisors, Inc. | 39,770 | 11.60 | 2,074 | 10.50 | ||||
| 2025-07-22 | 13F | Stanich Group LLC | 0 | -100.00 | 0 | |||||
| 2025-07-31 | 13F | CNB Bank | 5,482 | 0.00 | 286 | -1.04 | ||||
| 2025-08-07 | 13F | Cascade Financial Partners, LLC | 58,225 | 0.00 | 3,036 | -0.98 | ||||
| 2025-08-13 | 13F | Wealthedge Investment Advisors, Llc | 0 | -100.00 | 0 | |||||
| 2025-08-14 | 13F | Integrated Wealth Concepts LLC | 5,188 | 0.74 | 271 | -0.37 | ||||
| 2025-07-16 | 13F | Independent Wealth Network Inc. | 7,420 | 0.05 | 387 | -1.03 | ||||
| 2025-07-31 | 13F | Cambridge Investment Research Advisors, Inc. | 20,397 | 101.49 | 1 | |||||
| 2025-08-14 | 13F | Atomi Financial Group, Inc. | 17,069 | 27.06 | 890 | 25.74 | ||||
| 2025-07-08 | 13F | 21 West Wealth Management LLC | 4,761 | 248 | ||||||
| 2025-08-07 | 13F | Brio Consultants, LLC | 7,171 | 11.65 | 374 | 10.36 | ||||
| 2025-05-14 | 13F | Citizens Business Bank | 0 | -100.00 | 0 | |||||
| 2025-07-11 | 13F | Westfuller Advisors, LLC | 13,752 | 0.74 | 717 | -0.14 | ||||
| 2025-07-15 | 13F | Mather Group, Llc. | 0 | -100.00 | 0 | |||||
| 2025-08-14 | 13F | Stifel Financial Corp | 12,983 | 0.71 | 677 | -0.29 | ||||
| 2025-07-08 | 13F | Parallel Advisors, LLC | 28 | 0.00 | 1 | 0.00 | ||||
| 2025-08-14 | 13F | EP Wealth Advisors, Inc. | 9,910 | -20.94 | 517 | -21.70 | ||||
| 2025-07-17 | 13F | Dopkins Wealth Management, Llc | 4,477 | 233 | ||||||
| 2025-08-04 | 13F | Assetmark, Inc | 65,516 | -7.16 | 3,416 | -8.05 | ||||
| 2025-07-25 | 13F | McNamara Financial Services, Inc. | 10,214 | 0.00 | 533 | -0.93 | ||||
| 2025-07-30 | 13F | Durante & Waters, Llc | 44,050 | -0.27 | 2,297 | -1.25 | ||||
| 2025-08-05 | 13F | Tiaa Trust, National Association | 858,675 | -13.16 | 44,771 | -14.00 | ||||
| 2025-08-12 | 13F | Coldstream Capital Management Inc | 0 | -100.00 | 0 | |||||
| 2025-08-14 | 13F | Citadel Advisors Llc | 13,015 | 679 | ||||||
| 2025-07-21 | 13F | Hudson Valley Investment Advisors Inc /adv | 9,700 | -3.48 | 506 | -4.54 | ||||
| 2025-08-05 | 13F | J. W. Coons Advisors, LLC | 4,000 | 0.00 | 209 | -0.95 | ||||
| 2025-08-08 | 13F | Francis Financial, Inc. | 45,343 | -74.97 | 2,364 | -75.21 | ||||
| 2025-08-12 | 13F | Proequities, Inc. | 0 | 0 | ||||||
| 2025-05-06 | 13F | Goodwin Investment Advisory | 0 | -100.00 | 0 | |||||
| 2025-07-29 | 13F | Members Advisory Group LLC | 19,692 | 7.35 | 1,027 | 6.32 | ||||
| 2025-09-04 | 13F/A | Advisor Group Holdings, Inc. | 52,781 | -38.91 | 2,752 | -39.49 | ||||
| 2025-08-06 | 13F | Rialto Wealth Management, LLC | 402 | 28.85 | 21 | 25.00 | ||||
| 2025-08-11 | 13F | Conquis Financial Llc | 25,354 | 179.94 | 1,322 | 177.52 | ||||
| 2025-08-08 | 13F | Gts Securities Llc | 5,076 | 265 | ||||||
| 2025-07-14 | 13F | Opal Wealth Advisors, LLC | 15,033 | 8.62 | 784 | 7.55 | ||||
| 2025-07-14 | 13F | GAMMA Investing LLC | 8,286 | -2.54 | 432 | -3.36 | ||||
| 2025-04-11 | 13F | First Affirmative Financial Network | 4,450 | 234 | ||||||
| 2025-07-17 | 13F | Keystone Global Partners, LLC | 5,225 | 20.50 | 272 | 19.30 | ||||
| 2025-08-14 | 13F | Royal Bank Of Canada | 10,225 | 5.25 | 533 | 4.10 | ||||
| 2025-07-31 | 13F | Buckingham Strategic Partners | 4,477 | 233 | ||||||
| 2025-07-02 | 13F | Dentgroup LLC | 5,634 | 294 | ||||||
| 2025-07-10 | 13F | Wealth Enhancement Advisory Services, Llc | 13,617 | -6.94 | 709 | -8.05 | ||||
| 2025-04-01 | 13F | Massmutual Trust Co Fsb/adv | 0 | -100.00 | 0 | |||||
| 2025-07-29 | 13F | Stratos Wealth Partners, LTD. | 8,868 | 462 | ||||||
| 2025-08-15 | 13F | Kestra Advisory Services, LLC | 42,451 | 607.63 | 2,213 | 602.54 | ||||
| 2025-08-14 | 13F | Graney & King, LLC | 4,539 | -5.44 | 237 | -6.35 | ||||
| 2025-08-11 | 13F | Wealthspire Advisors, LLC | 19,686 | -57.41 | 1,026 | -57.83 | ||||
| 2025-08-04 | 13F | Creative Financial Designs Inc /adv | 2,223 | 0.05 | 116 | -1.71 | ||||
| 2025-08-14 | 13F | Two Sigma Securities, Llc | 3,864 | 201 | ||||||
| 2025-08-06 | 13F | Long Run Wealth Advisors, LLC | 10,520 | 0.15 | 549 | -0.90 | ||||
| 2025-08-07 | 13F | Fidelis Capital Partners, LLC | 7,290 | 0.00 | 380 | 0.26 | ||||
| 2025-05-14 | 13F | Susquehanna International Group, Llp | 0 | -100.00 | 0 | |||||
| 2025-08-14 | 13F | AllSquare Wealth Management LLC | 4,219 | -8.46 | 220 | -9.50 | ||||
| 2025-08-14 | 13F | Fairview Capital Investment Management, Llc | 0 | -100.00 | 0 | |||||
| 2025-07-23 | 13F | Sax Wealth Advisors, Llc | 0 | -100.00 | 0 | |||||
| 2025-08-14 | 13F | Marshall Investment Management, Llc | 0 | -100.00 | 0 | |||||
| 2025-07-16 | 13F | TCI Wealth Advisors, Inc. | 18,698 | 0.00 | 975 | -1.02 | ||||
| 2025-08-29 | 13F | Centaurus Financial, Inc. | 3,237 | 0 | ||||||
| 2025-04-10 | 13F | Lmcg Investments, Llc | 0 | -100.00 | 0 | -100.00 | ||||
| 2025-08-12 | 13F | O'shaughnessy Asset Management, Llc | 10,204 | 20.25 | 532 | 19.28 | ||||
| 2025-08-05 | 13F | Astra Wealth Partners LLC | 5,438 | -30.23 | 284 | -30.98 | ||||
| 2025-08-11 | 13F | Bell Investment Advisors, Inc | 8,926 | 0.73 | 465 | -0.21 | ||||
| 2025-08-07 | 13F | Allworth Financial LP | 19,474 | -1.35 | 1,015 | -0.78 | ||||
| 2025-04-23 | 13F | Spire Wealth Management | 0 | -100.00 | 0 | |||||
| 2025-07-21 | 13F | Empirical Financial Services, LLC d.b.a. Empirical Wealth Management | 9,581 | 500 | ||||||
| 2025-08-14 | 13F | Fmr Llc | 406,868 | 21.47 | 21,214 | 20.29 | ||||
| 2025-08-06 | 13F | Commonwealth Equity Services, Llc | 85,566 | 46.22 | 4 | 33.33 | ||||
| 2025-08-15 | 13F | CI Private Wealth, LLC | 22,007 | 26.59 | 1,147 | 25.36 | ||||
| 2025-08-01 | 13F | Equita Financial Network, Inc. | 23,069 | -24.79 | 1,203 | -25.53 | ||||
| 2025-08-14 | 13F | UBS Group AG | 125,921 | 4.00 | 6,566 | 3.00 | ||||
| 2025-07-15 | 13F | Farrell Financial LLC | 15,504 | -25.43 | 808 | -26.14 | ||||
| 2025-07-16 | 13F | St Germain D J Co Inc | 7,093 | -3.30 | 370 | -4.40 | ||||
| 2025-08-14 | 13F | Mercer Global Advisors Inc /adv | 14,761 | -49.46 | 770 | -49.97 | ||||
| 2025-08-14 | 13F | Ameriprise Financial Inc | 48,711 | -49.61 | 2,513 | -50.64 | ||||
| 2025-08-14 | 13F | Goldman Sachs Group Inc | 73,378 | 2.30 | 3,826 | 1.30 | ||||
| 2025-08-14 | 13F | Alliancebernstein L.p. | 88,879 | 2.94 | 4,634 | 1.94 | ||||
| 2025-07-14 | 13F | Conrad Siegel Investment Advisors, Inc. | 24,438 | 22.43 | 1,274 | 21.33 | ||||
| 2025-07-18 | 13F | SOA Wealth Advisors, LLC. | 49,768 | 82.18 | 2,595 | 80.39 | ||||
| 2025-05-15 | 13F | Lido Advisors, LLC | 0 | -100.00 | 0 | -100.00 | ||||
| 2025-08-14 | 13F | First Foundation Advisors | 27,065 | 1,411 | ||||||
| 2025-08-07 | 13F | Hennion & Walsh Asset Management, Inc. | 75,952 | 9.28 | 3,960 | 8.23 | ||||
| 2025-07-23 | 13F | Stephen J. Garry & Associates, Llc | 4,110 | 0.00 | 214 | -0.93 | ||||
| 2025-08-06 | 13F | Middleton & Co Inc/ma | 0 | -100.00 | 0 | |||||
| 2025-07-17 | 13F | LifeGoal Wealth Advisors | 17,510 | 8.37 | 913 | 7.29 | ||||
| 2025-08-14 | 13F | Sei Investments Co | 11,623 | -14.28 | 606 | -15.01 | ||||
| 2025-07-16 | 13F | Magnus Financial Group LLC | 33,128 | 35.99 | 1,727 | 34.71 | ||||
| 2025-08-01 | 13F | Envestnet Asset Management Inc | 205,163 | 4.83 | 10,697 | 3.82 | ||||
| 2025-07-02 | 13F | Boston Standard Wealth Management, LLC | 6,895 | 8.29 | 360 | 5.88 | ||||
| 2025-07-24 | 13F | IFP Advisors, Inc | 1,689 | 0.18 | 88 | 0.00 | ||||
| 2025-07-31 | 13F | Wealthfront Advisers Llc | 10,848 | -11.71 | 566 | -12.54 | ||||
| 2025-08-05 | 13F | Crestwood Advisors Group LLC | 7,333 | 0.00 | 382 | -1.04 | ||||
| 2025-08-06 | 13F | Wsfs Capital Management, Llc | 7,226 | -9.75 | 377 | -10.69 | ||||
| 2025-05-15 | 13F/A | Orion Portfolio Solutions, LLC | 10,111 | 0.00 | 532 | -1.12 | ||||
| 2025-07-09 | 13F | Alesco Advisors Llc | 292,550 | -10.54 | 15,254 | -11.41 | ||||
| 2025-07-25 | 13F | Atria Wealth Solutions, Inc. | 25,559 | 26.82 | 1,332 | 25.54 | ||||
| 2025-07-14 | 13F | Signature Securities Group Corporation | 16,085 | 2.69 | 839 | 1.70 | ||||
| 2025-07-17 | 13F | Paradigm Financial Partners, Llc | 6,371 | -6.53 | 332 | -7.26 | ||||
| 2025-08-05 | 13F | W.G. Shaheen & Associates DBA Whitney & Co | 11,544 | 1.99 | 602 | 1.01 | ||||
| 2025-08-08 | 13F | Altfest L J & Co Inc | 111,430 | 16.53 | 5,810 | 15.40 | ||||
| 2025-08-14 | 13F | Wells Fargo & Company/mn | 55,381 | 2.98 | 2,888 | 1.98 | ||||
| 2025-08-13 | 13F | Cerity Partners LLC | 9,518 | 0.00 | 496 | -1.00 | ||||
| 2025-08-14 | 13F | Mml Investors Services, Llc | 24,270 | 9.01 | 1 | 0.00 | ||||
| 2025-08-15 | 13F | Captrust Financial Advisors | 6,265 | 327 | ||||||
| 2025-08-11 | 13F | Brown Brothers Harriman & Co | 166 | 0.00 | 9 | 0.00 | ||||
| 2025-04-16 | 13F | New Century Financial Group, LLC | 0 | -100.00 | 0 | |||||
| 2025-07-18 | 13F | Northeast Financial Group, Inc. | 5,414 | -9.45 | 282 | -10.19 | ||||
| 2025-08-13 | 13F | Baird Financial Group, Inc. | 0 | -100.00 | 0 | |||||
| 2025-07-09 | 13F | High Probability Advisors, LLC | 668,495 | 5.09 | 34,855 | 4.07 | ||||
| 2025-08-06 | 13F | Adviser Investments LLC | 353,480 | 0.95 | 18,430 | -0.03 | ||||
| 2025-08-12 | 13F | Nemes Rush Group LLC | 3,930 | 0.74 | 205 | -0.49 | ||||
| 2025-08-01 | 13F | Facet Wealth, Inc. | 392,537 | 5.80 | 20,400 | 5.56 | ||||
| 2025-08-11 | 13F | Citigroup Inc | 15,430 | 165.12 | 805 | 162.75 | ||||
| 2025-07-22 | 13F | Sutton Place Investors Llc | 7,539 | -10.95 | 393 | -11.69 | ||||
| 2025-08-13 | 13F | Jones Financial Companies Lllp | 5,186 | 293.77 | 270 | 289.86 | ||||
| 2025-08-13 | 13F | American Investment Services, Inc. | 4,925 | 0.00 | 257 | -1.16 | ||||
| 2025-07-24 | 13F | Drucker Wealth 3.0, LLC | 26,700 | 42.63 | 1,391 | 41.12 | ||||
| 2025-07-29 | 13F | Private Trust Co Na | 2,018 | 0.00 | 105 | -0.94 | ||||
| 2025-08-11 | 13F | HighTower Advisors, LLC | 382,305 | -10.81 | 19,933 | -11.67 | ||||
| 2025-07-29 | 13F | Stratos Wealth Advisors, LLC | 16,808 | 0.00 | 876 | -0.90 | ||||
| 2025-08-08 | 13F | Pnc Financial Services Group, Inc. | 1,976 | 5,711.76 | 103 | 10,200.00 | ||||
| 2025-08-13 | 13F | Flow Traders U.s. Llc | 26,274 | 439.62 | 1 | |||||
| 2025-08-12 | 13F | Global Retirement Partners, LLC | 0 | -100.00 | 0 | |||||
| 2025-08-13 | 13F | Hsbc Holdings Plc | 282,000 | -0.48 | 14,703 | -1.45 | ||||
| 2025-07-22 | 13F | Relyea Zuckerberg Hanson LLC | 0 | -100.00 | 0 | |||||
| 2025-08-11 | 13F | Arrow Financial Corp | 86,275 | -2.74 | 4,498 | -3.68 | ||||
| 2025-08-15 | 13F | Morgan Stanley | 455,538 | -10.05 | 23,752 | -10.92 | ||||
| 2025-08-06 | 13F | Quadrant Private Wealth Management, LLC | 4,793 | 250 | ||||||
| 2025-08-13 | 13F | Satovsky Asset Management Llc | 328,830 | -0.88 | 17,145 | -1.84 | ||||
| 2025-07-23 | 13F | Eagle Rock Investment Company, Llc | 10,000 | 66.67 | 521 | 65.40 | ||||
| 2025-08-07 | 13F | King Luther Capital Management Corp | 723 | -0.96 | ||||||
| 2025-08-14 | 13F | Dimension Capital Management Llc | 16,379 | 0.00 | 854 | -0.93 | ||||
| 2025-08-13 | 13F | Townsquare Capital Llc | 0 | -100.00 | 0 | |||||
| 2025-08-27 | 13F/A | Brinker Capital Investments, LLC | 9,806 | -3.02 | 511 | -3.95 | ||||
| 2025-08-14 | 13F | Mpwm Advisory Solutions, Llc | 430 | 0.00 | 22 | 0.00 | ||||
| 2025-08-11 | 13F | Elequin Capital Lp | 4,916 | -72.71 | 256 | -73.00 | ||||
| 2025-08-14 | 13F | Mariner, LLC | 160,513 | -23.94 | 8,367 | -24.69 | ||||
| 2025-07-10 | 13F | Wedmont Private Capital | 46,725 | 0.09 | 2,433 | 1.63 | ||||
| 2025-07-31 | 13F | Carnegie Capital Asset Management, LLC | 50,936 | 3.35 | 2,656 | 2.35 | ||||
| 2025-07-15 | 13F | James J. Burns & Company, LLC | 58,734 | -9.38 | 3,062 | -10.26 | ||||
| 2025-07-25 | NP | FNYTX - Franklin New York Tax-free Income Fund Class A1 | 0 | -100.00 | 0 | -100.00 | ||||
| 2025-07-11 | 13F | Farther Finance Advisors, LLC | 1 | 0.00 | 0 | |||||
| 2025-07-22 | 13F | Grimes & Company, Inc. | 8,250 | 0.00 | 430 | -0.92 | ||||
| 2025-08-15 | 13F | Manhattan West Asset Management, LLC | 6,770 | -26.38 | 353 | -27.27 | ||||
| 2025-08-13 | 13F | Northwestern Mutual Wealth Management Co | 9,451 | 493 | ||||||
| 2025-08-14 | 13F | Smartleaf Asset Management LLC | 396 | 6.45 | 21 | 5.26 | ||||
| 2025-07-21 | 13F | Patriot Financial Group Insurance Agency, LLC | 30,803 | 25.77 | 1,606 | 24.59 | ||||
| 2025-08-08 | 13F | Bailard, Inc. | 39,901 | 0.84 | 2,080 | -0.14 | ||||
| 2025-08-15 | 13F | Equitable Holdings, Inc. | 15,216 | -6.12 | 793 | -7.03 | ||||
| 2025-08-12 | 13F | LPL Financial LLC | 129,081 | 8.57 | 6,730 | 7.53 | ||||
| 2025-08-12 | 13F | Jpmorgan Chase & Co | 87,760 | -14.97 | 4,576 | -15.81 | ||||
| 2025-08-08 | 13F | Tortoise Investment Management, LLC | 3,412 | -8.08 | 178 | -9.23 | ||||
| 2025-08-08 | 13F | Wealth Alliance | 6,215 | 0.94 | 324 | 0.00 | ||||
| 2025-07-28 | 13F | Davidson Investment Advisors | 4,941 | -5.04 | 258 | -5.86 | ||||
| 2025-08-08 | 13F | Cetera Investment Advisers | 134,102 | 4.99 | 6,992 | 3.99 | ||||
| 2025-07-28 | 13F | Revolve Wealth Partners, LLC | 28,716 | 15.78 | 1,497 | 14.71 | ||||
| 2025-08-14 | 13F | Colony Group, LLC | 46,482 | 0.57 | 2,424 | -0.41 | ||||
| 2025-05-15 | 13F | MAI Capital Management | 0 | -100.00 | 0 | |||||
| 2025-08-14 | 13F | Bank Of America Corp /de/ | 645,341 | 14.39 | 33,648 | 13.29 | ||||
| 2025-08-14 | 13F | Raymond James Financial Inc | 5,171 | 29.76 | 270 | 28.71 | ||||
| 2025-07-11 | 13F | Myecfo, Llc | 130,634 | -3.26 | 6,811 | -4.19 | ||||
| 2025-08-12 | 13F | AlphaCore Capital LLC | 9,618 | 0.00 | 501 | -0.99 | ||||
| 2025-07-30 | 13F | Atlantic Edge Private Wealth Management, LLC | 2,900 | 0.00 | 151 | -0.66 | ||||
| 2025-07-23 | 13F | Proffitt & Goodson Inc | 23,234 | -21.98 | 1,211 | -22.72 | ||||
| 2025-08-08 | 13F | Empower Advisory Group, LLC | 13,987 | 26.85 | 729 | 25.69 | ||||
| 2025-08-12 | 13F | Martin Worley Group | 4,211 | 0.00 | 220 | -0.90 | ||||
| 2025-08-13 | 13F | Guggenheim Capital Llc | 4,987 | 260 | ||||||
| 2025-05-12 | 13F | Financial Engines Advisors L.L.C. | 0 | -100.00 | 0 | |||||
| 2025-07-14 | 13F | Park Avenue Securities Llc | 0 | -100.00 | 0 | |||||
| 2025-08-14 | 13F | Jane Street Group, Llc | 347,152 | 296.77 | 18,101 | 292.97 | ||||
| 2025-08-08 | 13F | Avantax Advisory Services, Inc. | 9,940 | 26.37 | 518 | 25.12 | ||||
| 2025-08-06 | 13F | Thompson Siegel & Walmsley Llc | 5,031 | 23.58 | 0 | |||||
| 2025-08-04 | 13F | WNY Asset Management, LLC | 20,709 | 11.77 | 1,080 | 10.67 | ||||
| 2025-08-14 | 13F | BCS Private Wealth Management, Inc. | 7,000 | 0 | ||||||
| 2025-07-31 | 13F | Ndwm Llc | 12,583 | 0.00 | 656 | -0.91 | ||||
| 2025-08-14 | 13F | Old Mission Capital Llc | 23,441 | 1,222 | ||||||
| 2025-08-14 | 13F | Betterment LLC | 166,364 | -1.73 | 9 | 0.00 | ||||
| 2025-08-08 | 13F | Taylor, Cottrill, Erickson & Associates, Inc. | 87,330 | -20.08 | 4,553 | -20.86 | ||||
| 2025-08-11 | 13F | Rockbridge Investment Management, LCC | 15,572 | -0.18 | 812 | -1.22 | ||||
| 2025-07-23 | 13F | Nbt Bank N A /ny | 105,220 | -0.96 | 5,486 | -1.91 | ||||
| 2025-07-09 | 13F | Breakwater Capital Group | 0 | -100.00 | 0 | |||||
| 2025-08-05 | 13F | Bank of New York Mellon Corp | 11,890 | -0.92 | 620 | -1.90 | ||||
| 2025-08-14 | 13F | Seven Mile Advisory | 3,917 | 0.00 | 204 | -0.97 | ||||
| 2025-07-29 | 13F | Calamos Wealth Management LLC | 6,683 | -51.02 | 348 | -51.53 | ||||
| 2025-07-30 | 13F | Klingman & Associates, LLC | 222,354 | -2.43 | 11,594 | -3.38 | ||||
| 2025-08-07 | 13F | Resources Investment Advisors, LLC. | 4,782 | 0.00 | 249 | -0.80 | ||||
| 2025-07-14 | 13F | Armstrong Advisory Group, Inc | 4,354 | 1.21 | 227 | -0.44 | ||||
| 2025-08-12 | 13F | Steward Partners Investment Advisory, Llc | 13,744 | -3.65 | 717 | -4.66 | ||||
| 2025-08-11 | 13F | Private Advisor Group, LLC | 13,983 | -17.93 | 729 | -18.73 | ||||
| 2025-07-17 | 13F | Astoria Strategic Wealth, Inc. | 26,675 | 8.29 | 1,391 | 7.25 | ||||
| 2025-08-11 | 13F | NewEdge Wealth, LLC | 41,946 | -8.37 | 2,184 | -9.38 | ||||
| 2025-07-22 | 13F | Miracle Mile Advisors, LLC | 317,818 | 1.09 | 16,571 | 0.11 | ||||
| 2025-07-22 | 13F | MBL Wealth, LLC | 0 | -100.00 | 0 | |||||
| 2025-07-15 | 13F | Graypoint LLC | 27,500 | 0.00 | 1,434 | -0.97 | ||||
| 2025-08-14 | 13F | Note Advisors, LLC | 54,628 | 5.25 | 2,848 | 4.25 | ||||
| 2025-08-04 | 13F | Atria Investments Llc | 5,177 | 1.13 | 270 | 0.00 | ||||
| 2025-07-29 | 13F | Chicago Partners Investment Group LLC | 19,961 | 0.08 | 1,032 | -1.06 | ||||
| 2025-07-30 | 13F | Whittier Trust Co Of Nevada Inc | 1,476 | 0.00 | 77 | -1.30 | ||||
| 2025-08-01 | 13F | Brookwood Investment Group LLC | 4,141 | 0.00 | 216 | -1.38 |