Mga Batayang Estadistika
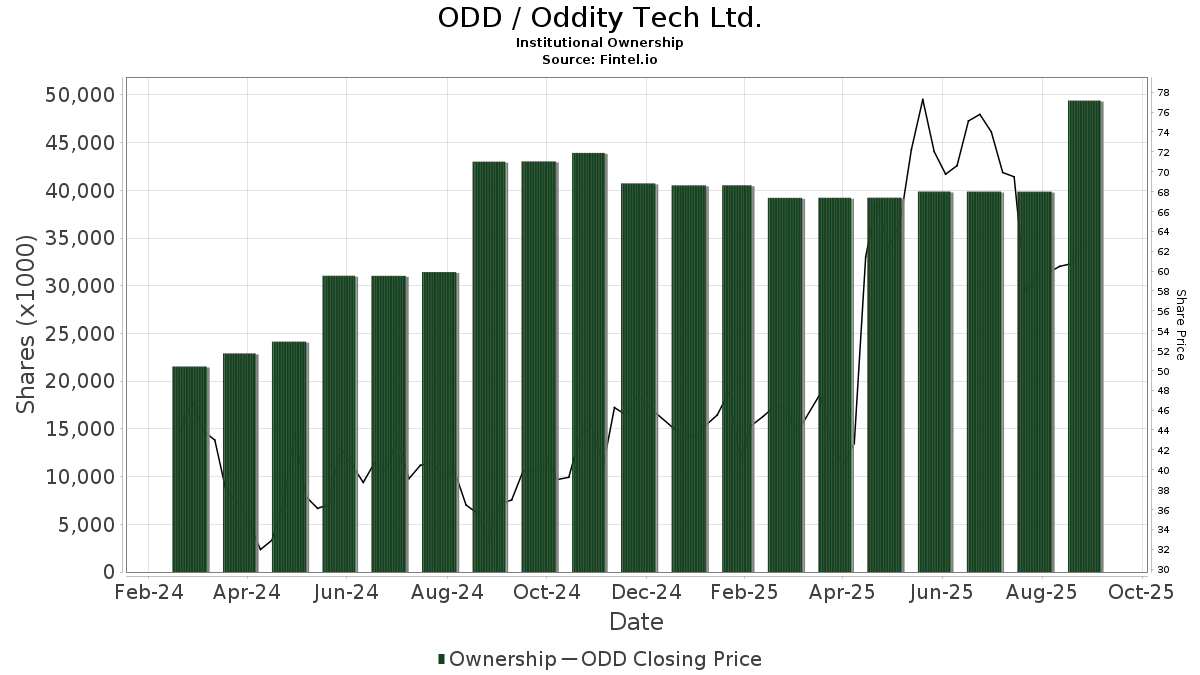
| Saham Institusional (Jangka Panjang) | 49,413,649 - 111.59% (ex 13D/G) - change of 9.53MM shares 23.90% MRQ |
| Nilai Institusional (Jangka Panjang) | $ 3,552,441 USD ($1000) |
Kepemilikan Institusional dan Pemegang Saham
Oddity Tech Ltd. (US:ODD) memiliki 247 pemilik institusional dan pemegang saham yang telah mengajukan formulir 13D/G atau 13F kepada Komisi Bursa Efek (Securities Exchange Commission/SEC). Lembaga-lembaga ini memegang total 49,422,515 saham. Pemegang saham terbesar meliputi Baillie Gifford & Co, Catterton Management Company, L.L.C., Fmr Llc, Morgan Stanley, D. E. Shaw & Co., Inc., MSD Partners, L.P., Massachusetts Financial Services Co /ma/, Franklin Resources Inc, Fundsmith LLP, and Granahan Investment Management Inc/ma .
Struktur kepemilikan institusional Oddity Tech Ltd. (NasdaqGM:ODD) menunjukkan posisi terkini di perusahaan oleh institusi dan dana, serta perubahan terbaru dalam ukuran posisi. Pemegang saham utama dapat mencakup investor individu, reksa dana, dana lindung nilai, atau institusi. Jadwal 13D menunjukkan bahwa investor memegang (atau pernah memegang) lebih dari 5% saham perusahaan dan bermaksud (atau pernah bermaksud) untuk secara aktif mengejar perubahan strategi bisnis. Jadwal 13G menunjukkan investasi pasif lebih dari 5%.
The share price as of September 5, 2025 is 63.00 / share. Previously, on September 9, 2024, the share price was 33.13 / share. This represents an increase of 90.16% over that period.
Skor Sentimen Dana
Skor Sentimen Dana (sebelumnya dikenal sebagai Skor Akumulasi Kepemilikan) menemukan saham-saham yang paling banyak dibeli oleh dana. Ini adalah hasil dari model kuantitatif multi-faktor yang canggih yang mengidentifikasi perusahaan dengan tingkat akumulasi institusional tertinggi. Model penilaian menggunakan kombinasi dari total peningkatan pemilik yang diungkapkan, perubahan dalam alokasi portofolio pada pemilik tersebut, dan metrik lainnya. Angka berkisar dari 0 hingga 100, dengan angka yang lebih tinggi menunjukkan tingkat akumulasi yang lebih tinggi dibandingkan dengan perusahaan sejenisnya, dan 50 adalah rata-ratanya.
Frekuensi Pembaruan: Setiap Hari
Lihat Ownership Explorer, yang menyediakan daftar perusahaan dengan peringkat tertinggi.
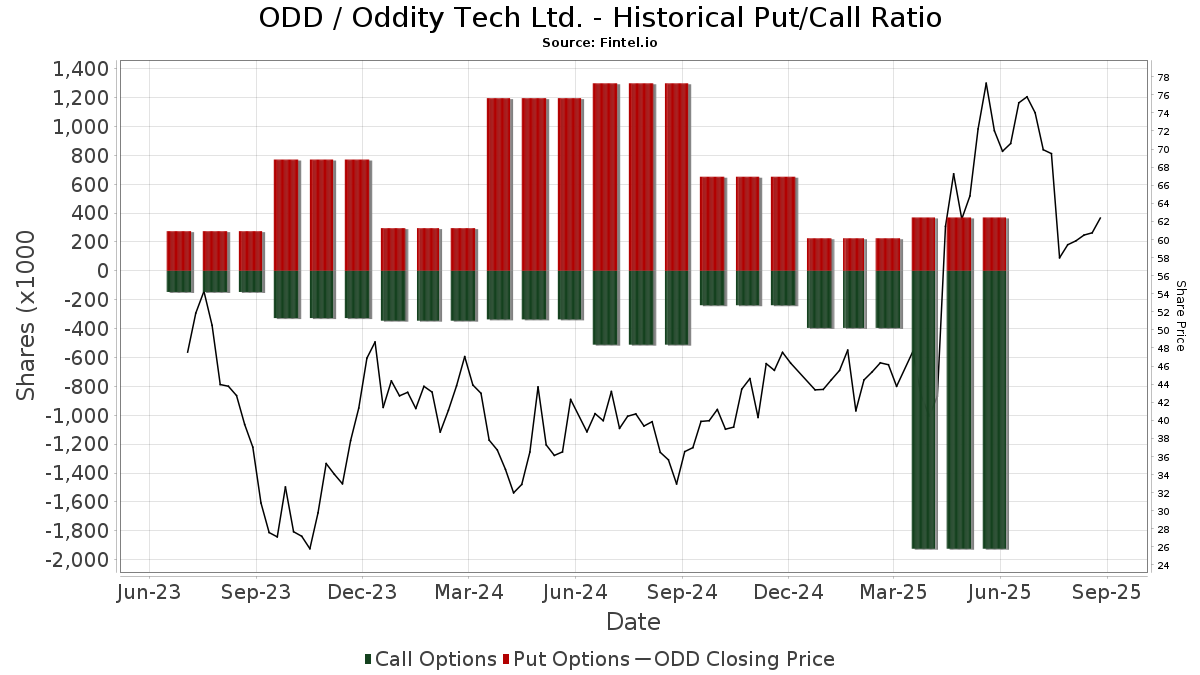
Rasio Put/Call Institusional
Selain melaporkan isu ekuitas dan utang standar, institusi dengan aset di bawah manajemen lebih dari 100 juta dolar AS juga harus mengungkapkan kepemilikan opsi put dan call mereka. Karena opsi put umumnya menunjukkan sentimen negatif, dan opsi call menunjukkan sentimen positif, kita dapat mengetahui sentimen institusional secara keseluruhan dengan memplot rasio put terhadap call. Grafik di sebelah kanan memplot rasio put/call historis untuk instrumen ini.
Menggunakan Rasio Put/Call sebagai indikator sentimen investor mengatasi salah satu kekurangan utama dari penggunaan total kepemilikan institusional, yaitu sejumlah besar aset yang dikelola diinvestasikan secara pasif untuk melacak indeks. Dana yang dikelola secara pasif biasanya tidak membeli opsi, sehingga indikator rasio put/call lebih akurat dalam melacak sentimen dana yang dikelola secara aktif.
Pengajuan 13D/G
Kami menyajikan pengajuan 13D/G secara terpisah dari pengajuan 13F karena perlakuan yang berbeda oleh SEC. Pengajuan 13D/G dapat diajukan oleh kelompok investor (dengan satu pemimpin), sedangkan pengajuan 13F tidak bisa. Hal ini mengakibatkan situasi di mana seorang investor dapat mengajukan 13D/G yang melaporkan satu nilai untuk total saham (mewakili semua saham yang dimiliki oleh kelompok investor), tetapi kemudian mengajukan 13F yang melaporkan nilai yang berbeda untuk total saham (mewakili kepemilikan mereka sendiri). Ini berarti bahwa kepemilikan saham dari pengajuan 13D/G dan pengajuan 13F seringkali tidak dapat dibandingkan secara langsung, sehingga kami menyajikannya secara terpisah.
Catatan: Mulai 16 Mei 2021, kami tidak lagi menampilkan pemilik yang belum mengajukan 13D/G dalam setahun terakhir. Sebelumnya, kami menampilkan riwayat lengkap pengajuan 13D/G. Secara umum, entitas yang diwajibkan untuk mengajukan pengajuan 13D/G harus mengajukan setidaknya setiap tahun sebelum mengirimkan pengajuan penutupan. Namun, terkadang dana keluar dari posisi tanpa mengirimkan pengajuan penutupan (misalnya, mereka menghentikan operasi), sehingga menampilkan riwayat lengkap terkadang menyebabkan kebingungan tentang kepemilikan saat ini. Untuk mencegah kebingungan, kami sekarang hanya menampilkan pemilik 'saat ini' - yaitu - pemilik yang telah mengajukan dalam setahun terakhir.
Upgrade to unlock premium data.
| Tanggal File | Formulir | Investor | Sebelumnya Saham |
Terbaru Saham |
Δ Saham (Persen) |
Kepemilikan (Persen) |
Δ Pagmamay-ari (Persen) |
|
|---|---|---|---|---|---|---|---|---|
| 2025-09-05 | LCGP3 Pro Makeup, L.P. | 4,037,472 | 3,537,472 | -12.38 | 8.00 | -13.98 | ||
| 2025-08-05 | FRANKLIN RESOURCES INC | 2,639,692 | 1,645,414 | -37.67 | 3.70 | -36.21 | ||
| 2025-05-23 | Holtzman Oran | 18,399,450 | 12,899,450 | -29.89 | 23.00 | -29.01 | ||
| 2025-05-06 | MORGAN STANLEY | 2,416,716 | 5.50 | |||||
| 2024-11-12 | FMR LLC | 3,929,945 | 8.69 |
Pengajuan 13F dan NPORT
Detail pada pengajuan 13F tersedia gratis. Detail pada pengajuan NP memerlukan keanggotaan premium. Baris berwarna hijau menunjukkan posisi baru. Baris berwarna merah menunjukkan posisi yang sudah ditutup. Klik tautan ini ikon untuk melihat riwayat transaksi selengkapnya.
Tingkatkan
untuk membuka data premium dan mengekspor ke Excel ![]() .
.
| Tanggal File | Sumber | Investor | Ketik | Presyo ng Avg (Silangan) |
Saham | Δ Saham (%) |
Dilaporkan Nilai ($1000) |
Nilai Δ (%) |
Alokasi Port (%) |
|
|---|---|---|---|---|---|---|---|---|---|---|
| 2025-09-03 | NP | MMNIX - Miller Market Neutral Income Fund Class I | Short | -7,200 | -505 | |||||
| 2025-08-14 | 13F | Fmr Llc | 3,378,533 | -7.68 | 254,978 | 61.06 | ||||
| 2025-08-14 | 13F | Algert Global Llc | 72,459 | 5 | ||||||
| 2025-08-13 | 13F | Employees Retirement System of Texas | 16,686 | 0.00 | 1 | |||||
| 2025-08-14 | 13F | Susquehanna Fundamental Investments, Llc | 47,980 | 0.00 | 3,621 | 74.51 | ||||
| 2025-06-26 | NP | CRNSX - CATHOLIC RESPONSIBLE INVESTMENTS INTERNATIONAL SMALL-CAP FUND Institutional Shares | 6,821 | 419 | ||||||
| 2025-08-14 | 13F | MIRAE ASSET GLOBAL ETFS HOLDINGS Ltd. | 483 | 4.32 | 36 | 89.47 | ||||
| 2025-08-14 | 13F | Jane Street Group, Llc | Call | 41,400 | 225.98 | 3,124 | 469.03 | |||
| 2025-08-14 | 13F | California State Teachers Retirement System | 41,679 | 23.07 | 3,146 | 114.68 | ||||
| 2025-08-14 | 13F | Jane Street Group, Llc | 367,322 | 595.96 | 27,722 | 1,114.24 | ||||
| 2025-07-29 | 13F | Private Trust Co Na | 14 | 1 | ||||||
| 2025-08-04 | 13F | Hantz Financial Services, Inc. | 50 | 0 | ||||||
| 2025-08-14 | 13F | Jane Street Group, Llc | Put | 4,700 | -38.16 | 355 | 7.93 | |||
| 2025-08-14 | 13F | Balyasny Asset Management Llc | 125,800 | 9,494 | ||||||
| 2025-08-14 | 13F | Balyasny Asset Management Llc | Put | 120,000 | 9,056 | |||||
| 2025-08-06 | 13F | First Horizon Advisors, Inc. | 9 | 1 | ||||||
| 2025-08-14 | 13F | Man Group plc | 296,548 | -27.96 | 22,380 | 25.69 | ||||
| 2025-08-14 | 13F | Graham Capital Management, L.P. | 15,706 | 134.52 | 1,185 | 310.03 | ||||
| 2025-05-05 | 13F | Morse Asset Management, Inc | 0 | -100.00 | 0 | |||||
| 2025-08-12 | 13F | Jefferies Financial Group Inc. | Call | 0 | -100.00 | 0 | -100.00 | |||
| 2025-08-14 | 13F | Symmetry Peak Management Llc | 1,230 | 93 | ||||||
| 2025-08-12 | 13F | XTX Topco Ltd | 0 | -100.00 | 0 | |||||
| 2025-08-14 | 13F | Symmetry Peak Management Llc | Call | 40,700 | 3,072 | |||||
| 2025-08-14 | 13F | Verition Fund Management LLC | 31,674 | 21.60 | 2,390 | 112.26 | ||||
| 2025-05-13 | 13F | Mark Sheptoff Financial Planning, Llc | 0 | -100.00 | 0 | -100.00 | ||||
| 2025-07-30 | 13F | FNY Investment Advisers, LLC | 40 | 0 | ||||||
| 2025-08-12 | 13F | Global Retirement Partners, LLC | 6,620 | 500 | ||||||
| 2025-08-12 | 13F | Jpmorgan Chase & Co | 671,724 | 378.47 | 50,695 | 734.76 | ||||
| 2025-05-13 | 13F | Norges Bank | 0 | -100.00 | 0 | -100.00 | ||||
| 2025-05-15 | 13F | D. E. Shaw & Co., Inc. | Call | 0 | -100.00 | 0 | -100.00 | |||
| 2025-08-06 | 13F | Penserra Capital Management LLC | 11,365 | 1 | ||||||
| 2025-08-01 | 13F | Envestnet Asset Management Inc | 9,435 | 712 | ||||||
| 2025-08-14 | 13F | LM Advisors LLC | 3,571 | 0 | ||||||
| 2025-08-14 | 13F | Nebula Research & Development LLC | 30,236 | 50.15 | 2,282 | 161.88 | ||||
| 2025-08-05 | 13F | Simplex Trading, Llc | 20,790 | -52.81 | 2 | 0.00 | ||||
| 2025-08-12 | 13F | Swiss National Bank | 76,600 | 15.89 | 5,781 | 102.20 | ||||
| 2025-08-14 | 13F | Qube Research & Technologies Ltd | 61,918 | 4,673 | ||||||
| 2025-08-11 | 13F | Y.D. More Investments Ltd | 77,387 | -17.68 | 5,840 | 43.63 | ||||
| 2025-08-13 | 13F | Winslow Capital Management, LLC | 179,907 | -67.91 | 13,578 | -44.01 | ||||
| 2025-08-19 | 13F | State of Wyoming | 2,609 | -58.04 | 197 | -26.87 | ||||
| 2025-08-14 | 13F | G2 Investment Partners Management LLC | 139,320 | 93.43 | 10,514 | 237.53 | ||||
| 2025-08-04 | 13F | Yorktown Management & Research Co Inc | 5,650 | 426 | ||||||
| 2025-08-14 | 13F | Cubist Systematic Strategies, LLC | 418,695 | 31,599 | ||||||
| 2025-07-24 | 13F | Us Bancorp \de\ | 6 | 0 | ||||||
| 2025-08-11 | 13F | Hexagon Capital Partners LLC | 0 | -100.00 | 0 | |||||
| 2025-08-12 | 13F | Aigen Investment Management, Lp | 17,391 | 1,312 | ||||||
| 2025-08-27 | NP | INSAX - Catalyst Insider Buying Fund Class A | 11,380 | -30.53 | 859 | 21.19 | ||||
| 2025-08-14 | 13F | Two Sigma Investments, Lp | 624,685 | 784.28 | 47,145 | 1,442.67 | ||||
| 2025-08-08 | 13F | SBI Securities Co., Ltd. | 72 | 3,500.00 | 5 | |||||
| 2025-08-14 | 13F | Goldman Sachs Group Inc | 188,354 | 3.60 | 14,215 | 80.76 | ||||
| 2025-08-14 | 13F | Goldman Sachs Group Inc | Put | 11,400 | 860 | |||||
| 2025-08-13 | 13F | Renaissance Technologies Llc | 761,200 | 434.55 | 57,448 | 832.58 | ||||
| 2025-07-24 | 13F | Ronald Blue Trust, Inc. | 5,703 | -24.69 | 430 | 31.50 | ||||
| 2025-08-14 | 13F | Quarry LP | 460 | -68.10 | 35 | -45.16 | ||||
| 2025-07-08 | 13F | Parallel Advisors, LLC | 1,675 | -1.47 | 126 | 72.60 | ||||
| 2025-08-14 | 13F | Driehaus Capital Management Llc | 543,159 | 40,992 | ||||||
| 2025-08-12 | 13F | Clal Insurance Enterprises Holdings Ltd | 280,300 | -45.64 | 21 | -4.55 | ||||
| 2025-08-14 | 13F | Fortress Investment Group LLC | 175,000 | 13,207 | ||||||
| 2025-07-31 | 13F | Washington Trust Advisors, Inc. | 79 | 0.00 | 6 | 66.67 | ||||
| 2025-08-13 | 13F | Northern Trust Corp | 80,307 | 21.15 | 6,061 | 111.37 | ||||
| 2025-08-13 | 13F | Walleye Trading LLC | Call | 43,300 | -9.41 | 3,268 | 58.06 | |||
| 2025-08-13 | 13F | Walleye Trading LLC | Put | 16,500 | 71.88 | 1,245 | 200.00 | |||
| 2025-08-14 | 13F | UBS Group AG | 128,174 | 486.29 | 9,673 | 923.60 | ||||
| 2025-08-28 | NP | SEEIX - Sit International Equity Fund - Class I | 5,828 | 440 | ||||||
| 2025-08-14 | 13F | Sphera Management Technology Funds Ltd | 35,000 | 16.67 | 2,641 | 103.62 | ||||
| 2025-07-25 | NP | CMIEX - Multi-Manager International Equity Strategies Fund Institutional Class | 30,046 | 2,236 | ||||||
| 2025-08-14 | 13F | Rip Road Capital Partners LP | 58,094 | 0.00 | 4,384 | 74.45 | ||||
| 2025-04-25 | 13F | New Wave Wealth Advisors Llc | 0 | -100.00 | 0 | |||||
| 2025-08-01 | 13F | Jennison Associates Llc | 5,608 | 423 | ||||||
| 2025-07-23 | 13F | Bellevue Asset Management, Llc | 30 | 0.00 | 2 | 100.00 | ||||
| 2025-08-08 | 13F | Police & Firemen's Retirement System of New Jersey | 8,650 | 14.51 | 653 | 100.00 | ||||
| 2025-08-12 | 13F | Deutsche Bank Ag\ | 1,858 | 38.66 | 140 | 145.61 | ||||
| 2025-05-09 | 13F | R Squared Ltd | 0 | -100.00 | 0 | -100.00 | ||||
| 2025-08-14 | 13F | UBS Group AG | Call | 1,303,840 | 98,401 | |||||
| 2025-08-11 | 13F | TD Waterhouse Canada Inc. | 56,888 | 98.32 | 4,218 | 228.76 | ||||
| 2025-08-13 | 13F | Quadrature Capital Ltd | 51,772 | 3,906 | ||||||
| 2025-08-14 | 13F | Susquehanna International Group, Llp | 0 | -100.00 | 0 | |||||
| 2025-08-05 | 13F | Sigma Planning Corp | 4,932 | 372 | ||||||
| 2025-08-14 | 13F | Hrt Financial Lp | 55,368 | 4 | ||||||
| 2025-08-14 | 13F | Caption Management, LLC | 0 | -100.00 | 0 | |||||
| 2025-08-05 | 13F | Bank of New York Mellon Corp | 6,736 | 20.89 | 508 | 110.79 | ||||
| 2025-08-14 | 13F | State Street Corp | 367,405 | 38.43 | 27,728 | 141.51 | ||||
| 2025-08-08 | 13F | Geode Capital Management, Llc | 75,063 | 12.87 | 5,660 | 96.80 | ||||
| 2025-08-14 | 13F | Peak6 Llc | Call | 24,100 | 30.98 | 1,819 | 128.68 | |||
| 2025-07-28 | 13F | BRYN MAWR TRUST Co | 550 | -81.35 | 42 | -67.72 | ||||
| 2025-07-29 | NP | ORSIX - NORTH SQUARE DYNAMIC SMALL CAP FUND CLASS I | 16,170 | 1,204 | ||||||
| 2025-08-14 | 13F | Fieldview Capital Management, LLC | 2,930 | 221 | ||||||
| 2025-06-26 | NP | TWAAX - Thrivent International Allocation Fund Class A | 1,455 | 89 | ||||||
| 2025-07-16 | 13F | Eagle Global Advisors Llc | 25,000 | -3.85 | 1,887 | 67.79 | ||||
| 2025-08-14 | 13F | Janus Henderson Group Plc | 938,939 | 7.87 | 70,856 | 89.43 | ||||
| 2025-08-14 | 13F | Tudor Investment Corp Et Al | 21,594 | 1,630 | ||||||
| 2025-08-04 | 13F | Quaker Wealth Management, LLC | Put | 0 | -100.00 | 0 | -100.00 | |||
| 2025-08-14 | 13F | Tudor Investment Corp Et Al | Call | 16,800 | 16.67 | 1,268 | 103.70 | |||
| 2025-08-14 | 13F | Tudor Investment Corp Et Al | Put | 4,800 | 362 | |||||
| 2025-08-12 | 13F | Franklin Resources Inc | 1,645,414 | -26.44 | 124,179 | 28.32 | ||||
| 2025-08-14 | 13F | Penn Capital Management Co Inc | 173,960 | -37.56 | 13,164 | 8.95 | ||||
| 2025-08-14 | 13F | J. Goldman & Co LP | Call | 0 | -100.00 | 0 | -100.00 | |||
| 2025-08-13 | 13F | Jones Financial Companies Lllp | 0 | -100.00 | 0 | |||||
| 2025-08-14 | 13F | Wells Fargo & Company/mn | 168,489 | 3,875.67 | 12,716 | 6,848.09 | ||||
| 2025-08-12 | 13F | LPL Financial LLC | 34,577 | 2,610 | ||||||
| 2025-05-15 | 13F | Main Management ETF Advisors, LLC | 0 | -100.00 | 0 | |||||
| 2025-08-26 | NP | DVSMX - Driehaus Small Cap Growth Fund Investor Share Class | 96,622 | 7,292 | ||||||
| 2025-08-14 | 13F | Vident Advisory, LLC | 4,853 | 366 | ||||||
| 2025-09-04 | 13F/A | Advisor Group Holdings, Inc. | 25,622 | 248.03 | 1,933 | 507.86 | ||||
| 2025-08-14 | 13F | J. Goldman & Co LP | 59,000 | 4,453 | ||||||
| 2025-07-29 | NP | SSEAX - SIIT Screened World Equity Ex-US Fund - Class A | 1,789 | 133 | ||||||
| 2025-08-11 | 13F | Citigroup Inc | 71,412 | 1,935.69 | 5,389 | 3,468.87 | ||||
| 2025-08-14 | 13F | Boothbay Fund Management, Llc | 26,334 | 76.23 | 1,987 | 207.59 | ||||
| 2025-08-14 | 13F | Jain Global LLC | 32,606 | 2,461 | ||||||
| 2025-08-14 | 13F | Lazard Asset Management Llc | 107,150 | 16.35 | 8 | 166.67 | ||||
| 2025-07-21 | 13F | Ameritas Advisory Services, LLC | 150 | 11 | ||||||
| 2025-08-26 | 13F/A | Thrivent Financial For Lutherans | 2,979 | 0 | ||||||
| 2025-08-12 | 13F | Proequities, Inc. | 0 | 0 | ||||||
| 2025-08-26 | NP | GFSYX - Strategic Alternatives Fund Institutional | Short | -1,666 | -126 | |||||
| 2025-08-14 | 13F | Mariner, LLC | 3,484 | 263 | ||||||
| 2025-08-14 | 13F | Voloridge Investment Management, Llc | 311,131 | 23,481 | ||||||
| 2025-08-07 | 13F | ProShare Advisors LLC | 11,654 | -57.88 | 880 | -26.51 | ||||
| 2025-08-13 | 13F | Marshall Wace, Llp | 464,269 | 118.73 | 35,038 | 281.59 | ||||
| 2025-08-14 | 13F | Bnp Paribas Arbitrage, Sa | 367,390 | 398.93 | 27,727 | 770.52 | ||||
| 2025-05-30 | NP | WIGTX - Seven Canyons World Innovators Fund Institutional Class | 19,400 | 839 | ||||||
| 2025-08-14 | 13F/A | Barclays Plc | 7,416 | 5.84 | 1 | |||||
| 2025-08-14 | 13F | Hood River Capital Management LLC | 715,915 | -2.93 | 54,030 | 69.35 | ||||
| 2025-08-08 | 13F | SG Americas Securities, LLC | 3,850 | -74.85 | 0 | |||||
| 2025-08-13 | 13F | Federated Hermes, Inc. | 14,791 | 236.16 | 1,116 | 487.37 | ||||
| 2025-08-13 | 13F | Russell Investments Group, Ltd. | 79,851 | -3.80 | 6,025 | 67.80 | ||||
| 2025-08-14 | 13F | Ameriprise Financial Inc | 35,605 | 44.63 | 2,687 | 153.25 | ||||
| 2025-08-12 | 13F | Coldstream Capital Management Inc | 0 | -100.00 | 0 | |||||
| 2025-07-30 | 13F | Aurora Investment Counsel | 25,129 | -49.61 | 1,896 | -12.10 | ||||
| 2025-08-13 | 13F | Invesco Ltd. | 4,327 | 327 | ||||||
| 2025-08-15 | 13F | Tower Research Capital LLC (TRC) | 33 | -95.49 | 2 | -93.55 | ||||
| 2025-07-15 | 13F | Td Private Client Wealth Llc | 236 | 18 | ||||||
| 2025-07-31 | 13F | Catalyst Capital Advisors LLC | 11,380 | -30.53 | 859 | 21.19 | ||||
| 2025-08-14 | 13F | Bank Of America Corp /de/ | 357,216 | 290.17 | 26,959 | 580.78 | ||||
| 2025-08-14 | 13F | Engineers Gate Manager LP | 163,785 | 75.91 | 12,361 | 206.93 | ||||
| 2025-08-05 | 13F | Bank Of Montreal /can/ | 7,065 | 533 | ||||||
| 2025-07-28 | NP | AVDE - Avantis International Equity ETF This fund is a listed as child fund of American Century Companies Inc and if that institution has disclosed ownership in this security, then these positions will not be double counted when calculating total shares and total value | 10,830 | 0.00 | 806 | 56.50 | ||||
| 2025-08-07 | 13F | Zurcher Kantonalbank (Zurich Cantonalbank) | 15,474 | 38.83 | 1,168 | 142.12 | ||||
| 2025-08-29 | 13F | Evolution Wealth Management Inc. | 100 | 8 | ||||||
| 2025-07-17 | 13F | Wd Rutherford Llc | 635 | 48 | ||||||
| 2025-07-25 | 13F | Allspring Global Investments Holdings, LLC | 71,051 | -21.27 | 5,362 | 37.35 | ||||
| 2025-08-27 | NP | THRIVENT SERIES FUND INC - Thrivent International Allocation Portfolio Class A | 2,979 | 225 | ||||||
| 2025-07-17 | 13F | Tempus Wealth Planning, LLC | 0 | -100.00 | 0 | |||||
| 2025-05-07 | 13F | Ibex Investors LLC | 0 | -100.00 | 0 | |||||
| 2025-08-14 | 13F | Numerai GP LLC | 38,555 | 38.10 | 2,910 | 141.01 | ||||
| 2025-06-26 | NP | USCAX - Small Cap Stock Fund Shares | 48,036 | 14.47 | 2,951 | 47.40 | ||||
| 2025-08-12 | 13F | Jefferies Financial Group Inc. | Put | 0 | -100.00 | 0 | -100.00 | |||
| 2025-08-15 | 13F | Morgan Stanley | 3,329,167 | 24.46 | 251,252 | 117.13 | ||||
| 2025-07-28 | NP | AVDS - Avantis International Small Cap Equity ETF | 1,094 | 681.43 | 81 | 1,250.00 | ||||
| 2025-05-15 | 13F | Caption Management, LLC | Call | 0 | -100.00 | 0 | -100.00 | |||
| 2025-08-05 | 13F | Catterton Management Company, L.L.C. | 4,037,472 | 0.00 | 304,708 | 74.46 | ||||
| 2025-08-27 | NP | TPAIX - Timothy Israel Common Values Fund Class A | 25,000 | -3.85 | 1,887 | 67.79 | ||||
| 2025-08-12 | 13F | Entropy Technologies, LP | 9,000 | 679 | ||||||
| 2025-08-13 | 13F | Pictet Asset Management Holding SA | 7,903 | 0.00 | 596 | 74.78 | ||||
| 2025-08-18 | 13F | Wolverine Trading, Llc | Put | 0 | -100.00 | 0 | ||||
| 2025-08-14 | 13F | Raymond James Financial Inc | 13,422 | 16.88 | 1,013 | 104.03 | ||||
| 2025-08-14 | 13F | Susquehanna International Group, Llp | Put | 58,600 | 623.46 | 4,423 | 1,163.43 | |||
| 2025-08-14 | 13F | Ubs Asset Management Americas Inc | 114,011 | 49.78 | 8,604 | 161.36 | ||||
| 2025-08-14 | 13F | Gotham Asset Management, LLC | 18,520 | -41.26 | 1,397 | 2.42 | ||||
| 2025-08-14 | 13F | Susquehanna International Group, Llp | Call | 314,700 | 246.59 | 23,750 | 504.63 | |||
| 2025-08-13 | 13F | EverSource Wealth Advisors, LLC | 110 | -25.17 | 8 | 33.33 | ||||
| 2025-08-08 | 13F | Pnc Financial Services Group, Inc. | 6 | 0 | ||||||
| 2025-08-14 | 13F | Canada Pension Plan Investment Board | 56,194 | 0.00 | 4,241 | 74.49 | ||||
| 2025-08-14 | 13F | Van Eck Associates Corp | 8,443 | 1 | ||||||
| 2025-07-07 | 13F | Wesbanco Bank Inc | 18,600 | 0.00 | 1,404 | 74.50 | ||||
| 2025-08-05 | 13F | Pier Capital, LLC | 68,959 | 5,204 | ||||||
| 2025-08-08 | 13F | Massachusetts Financial Services Co /ma/ | 1,709,195 | 32.55 | 128,993 | 131.24 | ||||
| 2025-07-08 | 13F | Atwood & Palmer Inc | 50 | 0.00 | 4 | 50.00 | ||||
| 2025-08-06 | 13F | Baillie Gifford & Co | 6,117,671 | -2.20 | 461,701 | 70.62 | ||||
| 2025-08-14 | 13F | Susquehanna Portfolio Strategies, LLC | 59,108 | 972.55 | 4,461 | 1,773.95 | ||||
| 2025-07-22 | 13F | Gsa Capital Partners Llp | 10,625 | 109.32 | 1 | |||||
| 2025-07-31 | 13F | Oppenheimer Asset Management Inc. | 3,060 | 231 | ||||||
| 2025-07-31 | 13F | Cambridge Investment Research Advisors, Inc. | 7,150 | 1 | ||||||
| 2025-05-12 | 13F | Nomura Asset Management Co Ltd | 0 | 0 | ||||||
| 2025-07-30 | 13F | D.a. Davidson & Co. | 13,354 | -47.58 | 1,008 | -8.62 | ||||
| 2025-08-08 | 13F | Calamos Advisors LLC | Call | 83,600 | 3,617 | |||||
| 2025-08-13 | 13F | Quantbot Technologies LP | 97,134 | 111.49 | 7,331 | 269.08 | ||||
| 2025-08-08 | 13F | Calamos Advisors LLC | 42,342 | 57.59 | 3,196 | 174.96 | ||||
| 2025-03-18 | 13F/A | Bank Of America Corp /de/ | Put | 0 | -100.00 | 0 | -100.00 | |||
| 2025-07-07 | 13F | Zevenbergen Capital Investments Llc | 3,750 | 283 | ||||||
| 2025-08-11 | 13F | Principal Securities, Inc. | 33 | 2 | ||||||
| 2025-04-16 | 13F | Wealth Enhancement Advisory Services, Llc | 0 | -100.00 | 0 | |||||
| 2025-07-28 | NP | AVDEX - Avantis International Equity Fund Institutional Class This fund is a listed as child fund of American Century Companies Inc and if that institution has disclosed ownership in this security, then these positions will not be double counted when calculating total shares and total value | 575 | 0.00 | 43 | 55.56 | ||||
| 2025-08-14 | 13F | Fundsmith LLP | 1,416,956 | -12.27 | 106,938 | 53.05 | ||||
| 2025-07-31 | 13F | State of New Jersey Common Pension Fund D | 14,323 | 74.86 | 1,081 | 205.08 | ||||
| 2025-08-14 | 13F | Group One Trading, L.p. | 32,120 | 2,654.72 | 2,424 | 4,748.00 | ||||
| 2025-07-28 | 13F | Mowery & Schoenfeld Wealth Management, LLC | 21 | 0.00 | 2 | |||||
| 2025-07-23 | 13F | Prime Capital Investment Advisors, LLC | 3,235 | -35.36 | 244 | 12.96 | ||||
| 2025-07-29 | 13F | William Blair Investment Management, Llc | 142,548 | -46.70 | 10,758 | -7.02 | ||||
| 2025-05-08 | 13F | Banque Cantonale Vaudoise | 0 | -100.00 | 0 | |||||
| 2025-07-25 | 13F | Cwm, Llc | 175 | 0.00 | 0 | |||||
| 2025-08-13 | 13F | Arrowstreet Capital, Limited Partnership | 835,315 | 8,711.34 | 63,041 | 15,275.85 | ||||
| 2025-08-13 | 13F | BCJ Capital Management, LLC | 38,217 | 2,884 | ||||||
| 2025-08-05 | 13F | Corton Capital Inc. | 4,202 | 317 | ||||||
| 2025-05-14 | 13F | Peak6 Llc | 0 | -100.00 | 0 | |||||
| 2025-07-29 | 13F | Nordea Investment Management Ab | 81,500 | 2.00 | 6,087 | 73.37 | ||||
| 2025-08-14 | 13F | PDT Partners, LLC | 99,165 | -9.45 | 7,484 | 57.97 | ||||
| 2025-08-21 | NP | MXMTX - Great-West Small Cap Growth Fund Investor Class | 35,673 | 12.22 | 2,692 | 95.78 | ||||
| 2025-05-15 | 13F | PharVision Advisers, LLC | 0 | -100.00 | 0 | |||||
| 2025-08-13 | 13F | ExodusPoint Capital Management, LP | 0 | -100.00 | 0 | |||||
| 2025-08-14 | 13F/A | Skopos Labs, Inc. | 68 | 5 | ||||||
| 2025-08-14 | 13F | Sei Investments Co | 80,421 | 146.14 | 6,069 | 329.51 | ||||
| 2025-08-18 | 13F/A | National Bank Of Canada /fi/ | 378 | -22.06 | 29 | 40.00 | ||||
| 2025-08-15 | 13F | State of Tennessee, Treasury Department | 20,961 | 64.14 | 1,582 | 186.41 | ||||
| 2025-08-14 | 13F | Granahan Investment Management Inc/ma | 1,355,347 | -12.85 | 102,288 | 52.04 | ||||
| 2025-07-15 | 13F | Sheets Smith Wealth Management | 16,958 | -18.44 | 1,280 | 42.27 | ||||
| 2025-08-13 | 13F | Walleye Capital LLC | 120,682 | 9,108 | ||||||
| 2025-08-14 | 13F | Fred Alger Management, Llc | 47,841 | -19.72 | 3,611 | 40.09 | ||||
| 2025-08-14 | 13F | Royal Bank Of Canada | 20,380 | 311.22 | 1,538 | 618.69 | ||||
| 2025-08-08 | 13F | Larson Financial Group LLC | 0 | -100.00 | 0 | |||||
| 2025-08-11 | 13F | HighTower Advisors, LLC | 4,565 | 345 | ||||||
| 2025-08-13 | 13F | Capital International Investors | 596,306 | -56.34 | 45,003 | -23.83 | ||||
| 2025-08-04 | 13F | Quaker Wealth Management, LLC | 264 | 20 | ||||||
| 2025-08-13 | 13F | Walleye Capital LLC | Call | 11,100 | 21.98 | 838 | 112.98 | |||
| 2025-08-13 | 13F | Walleye Capital LLC | Put | 19,100 | 536.67 | 1,441 | 1,017.05 | |||
| 2025-07-28 | 13F | Td Asset Management Inc | 6,153 | 464 | ||||||
| 2025-08-28 | NP | QCSTRX - Stock Account Class R1 | 30,869 | 13.16 | 2,330 | 97.37 | ||||
| 2025-07-09 | 13F | Harbor Capital Advisors, Inc. | 25,701 | 20.74 | 2 | |||||
| 2025-08-14 | 13F | Altshuler Shaham Ltd | 20,323 | -16.45 | 1,534 | 45.72 | ||||
| 2025-08-12 | 13F | Legal & General Group Plc | 936 | 71 | ||||||
| 2025-08-19 | 13F | Cim, Llc | 25,370 | 1,915 | ||||||
| 2025-08-13 | 13F | Polen Capital Management Llc | 33,751 | 2,547 | ||||||
| 2025-07-17 | 13F | Janney Montgomery Scott LLC | 0 | -100.00 | 0 | |||||
| 2025-08-18 | 13F | Wolverine Trading, Llc | Call | 0 | -100.00 | 0 | ||||
| 2025-08-14 | 13F | Alliancebernstein L.p. | 55,479 | 4,187 | ||||||
| 2025-08-14 | 13F | Wellington Management Group Llp | 0 | -100.00 | 0 | |||||
| 2025-08-18 | 13F | Wolverine Trading, Llc | 0 | -100.00 | 0 | |||||
| 2025-07-25 | 13F | Atria Wealth Solutions, Inc. | 3,905 | 296 | ||||||
| 2025-08-14 | 13F | Massar Capital Management, LP | 0 | -100.00 | 0 | |||||
| 2025-08-04 | 13F | Migdal Insurance & Financial Holdings Ltd. | 245,764 | -3.91 | 19 | 63.64 | ||||
| 2025-08-12 | 13F | BlackRock, Inc. | 953,475 | 20.45 | 71,959 | 110.14 | ||||
| 2025-08-13 | 13F | Amundi | 166,549 | 39.61 | 12,509 | 153.99 | ||||
| 2025-07-15 | 13F | Public Employees Retirement System Of Ohio | 62,503 | 561.34 | 4,717 | 1,056.13 | ||||
| 2025-05-15 | 13F | Centiva Capital, LP | 0 | -100.00 | 0 | -100.00 | ||||
| 2025-08-14 | 13F | Woodline Partners LP | 400,112 | -9.18 | 30,196 | 58.45 | ||||
| 2025-08-12 | 13F | Landscape Capital Management, L.l.c. | 71,652 | 1.50 | 5,408 | 77.10 | ||||
| 2025-08-13 | 13F | New York State Common Retirement Fund | 132,095 | -23.58 | 10 | 28.57 | ||||
| 2025-05-15 | 13F | Twinbeech Capital Lp | 0 | -100.00 | 0 | |||||
| 2025-08-14 | 13F | Citadel Advisors Llc | 777,411 | 255.04 | 58,671 | 519.42 | ||||
| 2025-08-01 | 13F | Peregrine Capital Management Llc | 145,885 | -3.63 | 11,010 | 68.13 | ||||
| 2025-08-12 | 13F | American Century Companies Inc | 14,300 | 17.26 | 1,079 | 104.74 | ||||
| 2025-08-14 | 13F | Citadel Advisors Llc | Put | 135,400 | 2.81 | 10,219 | 79.36 | |||
| 2025-07-11 | 13F | Diversified Trust Co | 2,721 | 205 | ||||||
| 2025-08-14 | 13F | Schonfeld Strategic Advisors LLC | 22,628 | 361.80 | 1,708 | 709.00 | ||||
| 2025-07-23 | 13F | Klp Kapitalforvaltning As | 14,800 | 8.82 | 1,117 | 89.80 | ||||
| 2025-07-29 | NP | WEUSX - Siit World Equity Ex-us Fund - Class A | 41,423 | 3,083 | ||||||
| 2025-08-12 | 13F | Virtu Financial LLC | 19,225 | 1 | ||||||
| 2025-08-14 | 13F | Citadel Advisors Llc | Call | 45,200 | -15.51 | 3,411 | 47.41 | |||
| 2025-07-08 | 13F | Nbc Securities, Inc. | 3,797 | 0 | ||||||
| 2025-08-22 | NP | Columbia Funds Variable Series Trust II - Variable Portfolio - Partners Small Cap Growth Fund Class 1 | 0 | -100.00 | 0 | -100.00 | ||||
| 2025-07-14 | 13F | Counterpoint Mutual Funds LLC | 10,165 | 767 | ||||||
| 2025-08-07 | 13F | Acadian Asset Management Llc | 821,759 | 507.76 | 62 | 1,120.00 | ||||
| 2025-05-15 | 13F | Barclays Plc | Put | 0 | -100.00 | 0 | ||||
| 2025-08-13 | 13F | Bare Financial Services, Inc | 12 | -45.45 | 1 | |||||
| 2025-08-08 | 13F | Principal Financial Group Inc | 10,962 | 827 | ||||||
| 2025-08-14 | 13F | Daiwa Securities Group Inc. | 15,200 | 1 | ||||||
| 2025-08-12 | 13F | Nuveen, LLC | 52,130 | 91.09 | 3,934 | 233.39 | ||||
| 2025-08-14 | 13F | Millennium Management Llc | 429,800 | 175.72 | 32,437 | 381.05 | ||||
| 2025-07-31 | 13F | Caitong International Asset Management Co., Ltd | 106 | 8 | ||||||
| 2025-08-28 | NP | CPAEX - Counterpoint Tactical Equity Fund Class A Shares | 10,165 | 767 | ||||||
| 2025-07-31 | 13F | Acuitas Investments, LLC | 0 | -100.00 | 0 | |||||
| 2025-08-05 | 13F | NewSquare Capital LLC | 10 | 1 | ||||||
| 2025-07-17 | 13F | Wolff Wiese Magana Llc | 116 | -18.88 | 9 | 33.33 | ||||
| 2025-08-14 | 13F | Sculptor Capital LP | 72,200 | 5,449 | ||||||
| 2025-08-27 | 13F/A | Squarepoint Ops LLC | 4,614 | 348 | ||||||
| 2025-08-26 | NP | GSCYX - SMALL CAP EQUITY FUND Institutional | 16,499 | 1,245 | ||||||
| 2025-08-14 | 13F | Two Sigma Advisers, Lp | 281,600 | 3,252.38 | 21,252 | 5,754.55 | ||||
| 2025-08-13 | 13F | Options Solutions, Llc | 25,113 | 1,895 | ||||||
| 2025-07-16 | 13F | ORG Partners LLC | 111 | 1,010.00 | 8 | |||||
| 2025-08-14 | 13F | Ghisallo Capital Management LLC | 150,000 | 11,320 | ||||||
| 2025-08-14 | 13F | Federation des caisses Desjardins du Quebec | 100 | 8 | ||||||
| 2025-08-28 | NP | WMKSX - WesMark Small Company Growth Fund | 18,600 | 0.00 | 1,404 | 74.50 | ||||
| 2025-08-13 | 13F | Jump Financial, LLC | 174,281 | 13,153 | ||||||
| 2025-08-12 | 13F | Jefferies Financial Group Inc. | 10,591 | -79.83 | 799 | -64.82 | ||||
| 2025-08-14 | 13F | Lord, Abbett & Co. Llc | 385,193 | 101.40 | 29 | 262.50 | ||||
| 2025-07-31 | 13F | Orion Capital Management LLC | 0 | -100.00 | 0 | |||||
| 2025-08-14 | 13F | D. E. Shaw & Co., Inc. | 2,060,732 | 1,747.06 | 155,523 | 3,122.61 | ||||
| 2025-08-18 | 13F | Ashford Capital Management Inc | 564,954 | -21.10 | 42,637 | 37.65 | ||||
| 2025-07-18 | 13F | Robeco Institutional Asset Management B.V. | 34,068 | 2,571 | ||||||
| 2025-08-11 | 13F | Vanguard Group Inc | 34,483 | 19.08 | 2,602 | 107.83 | ||||
| 2025-08-12 | 13F | Trexquant Investment LP | 164,144 | 191.44 | 12,388 | 408.50 | ||||
| 2025-08-14 | 13F | Holocene Advisors, LP | 4,143 | 313 | ||||||
| 2025-08-14 | 13F | MSD Partners, L.P. | 1,781,661 | 0.00 | 134,462 | 74.46 | ||||
| 2025-07-28 | NP | AVSD - Avantis Responsible International Equity ETF | 572 | 0.00 | 43 | 55.56 | ||||
| 2025-08-14 | 13F | Bamco Inc /ny/ | 1,237,433 | -13.33 | 93,389 | 51.20 | ||||
| 2025-05-15 | 13F | Point72 Asset Management, L.P. | 0 | -100.00 | 0 | -100.00 | ||||
| 2025-08-14 | 13F | Two Sigma Securities, Llc | 0 | -100.00 | 0 | |||||
| 2025-08-14 | 13F | Headlands Technologies LLC | 1,434 | 108 | ||||||
| 2025-05-13 | 13F | Knuff & Co LLC | 0 | -100.00 | 0 | |||||
| 2025-08-14 | 13F | Susquehanna Advisors Group, Inc. | 59,200 | 4,468 | ||||||
| 2025-08-01 | 13F | Teacher Retirement System Of Texas | 17,108 | 11.91 | 1,291 | 95.31 | ||||
| 2025-07-11 | 13F | Farther Finance Advisors, LLC | 45 | 0.00 | 3 | 50.00 | ||||
| 2025-08-05 | 13F | Huntington National Bank | 3 | 0 | ||||||
| 2025-08-14 | 13F | USS Investment Management Ltd | 13,058 | 985 | ||||||
| 2025-07-24 | 13F | Blair William & Co/il | 2,700 | 204 | ||||||
| 2025-07-11 | 13F | Harbour Capital Advisors, LLC | 4,435 | 333 | ||||||
| 2025-04-29 | 13F/A | Huntleigh Advisors, Inc. | 0 | -100.00 | 0 | |||||
| 2025-08-26 | NP | NORTHERN FUNDS - NORTHERN SMALL CAP CORE FUND Class K | 6,894 | -5.55 | 520 | 65.08 | ||||
| 2025-08-07 | 13F | Teachers Retirement System Of The State Of Kentucky | 64,060 | -5.33 | 5 | 100.00 | ||||
| 2025-08-14 | 13F | Frontier Capital Management Co Llc | 285,300 | 21,532 | ||||||
| 2025-04-22 | 13F | Mendota Financial Group, LLC | 0 | -100.00 | 0 | |||||
| 2025-07-10 | 13F | Moody National Bank Trust Division | 94,216 | -10.93 | 7,110 | 55.38 | ||||
| 2025-08-04 | 13F | Assetmark, Inc | 713 | 54 | ||||||
| 2025-08-14 | 13F | Winton Capital Group Ltd | 3,921 | 296 | ||||||
| 2025-08-29 | NP | JAVTX - Janus Henderson Venture Fund Class T | 516,155 | 0.00 | 38,954 | 74.46 | ||||
| 2025-08-08 | 13F | Commonwealth Of Pennsylvania Public School Empls Retrmt Sys | 13,633 | 1,029 | ||||||
| 2025-08-14 | 13F | Shellback Capital, LP | 5,000 | 377 |
Other Listings
| DE:KW7 |