PLBY - Playboy, Inc. Saham - Harga Saham, Kepemilikan Institusional, Pemegang Saham (NasdaqGM)

Playboy, Inc.
US ˙ NasdaqGM ˙ US72814P1093

Mga Batayang Estadistika
Pemilik Institusional 80 total, 74 long only, 1 short only, 5 long/short - change of 0.00% MRQ
Alokasi Portofolio Rata-rata 0.0217 % - change of 5.74% MRQ
Jumlah Saham Beredar shares (source: Capital IQ)
Saham Institusional (Jangka Panjang) 16,095,416 - 14.97% (ex 13D/G) - change of -1.40MM shares -7.98% MRQ
Nilai Institusional (Jangka Panjang) $ 25,835 USD ($1000)
Kepemilikan Institusional dan Pemegang Saham

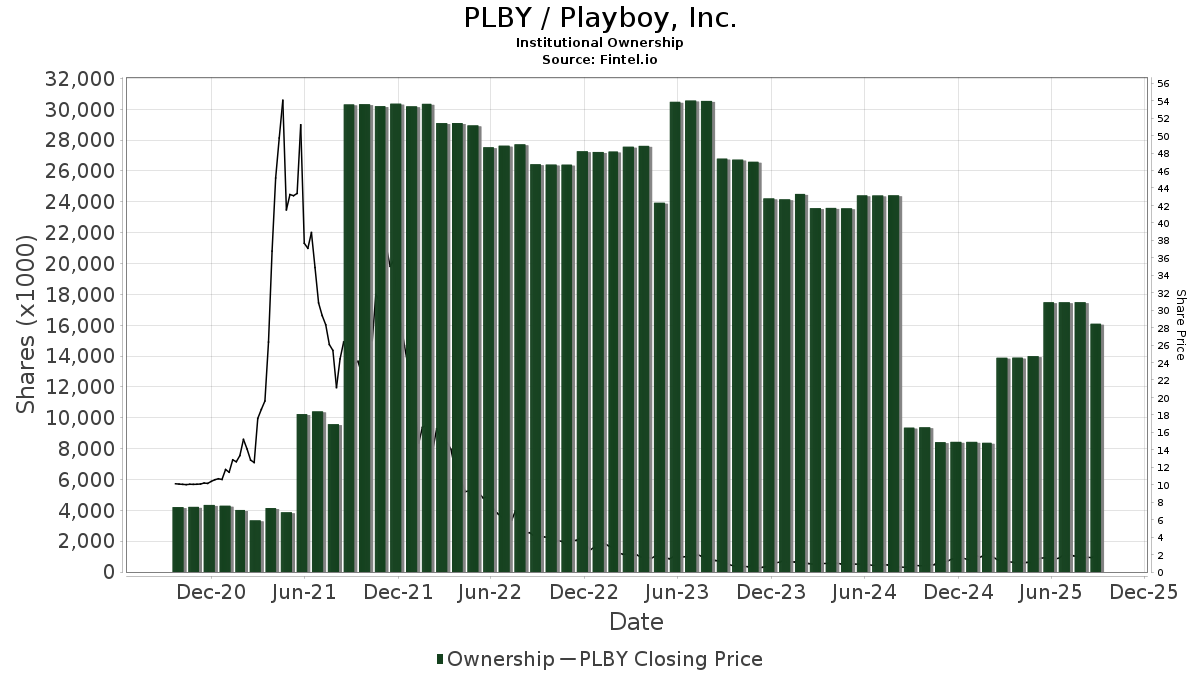
Playboy, Inc. (US:PLBY) memiliki 80 pemilik institusional dan pemegang saham yang telah mengajukan formulir 13D/G atau 13F kepada Komisi Bursa Efek (Securities Exchange Commission/SEC). Lembaga-lembaga ini memegang total 16,095,416 saham. Pemegang saham terbesar meliputi Fortress Investment Group LLC, Vanguard Group Inc, VTSMX - Vanguard Total Stock Market Index Fund Investor Shares, VEXMX - Vanguard Extended Market Index Fund Investor Shares, Geode Capital Management, Llc, Crcm Lp, Morgan Stanley, UBS Group AG, Renaissance Technologies Llc, and Citadel Advisors Llc .

Struktur kepemilikan institusional Playboy, Inc. (NasdaqGM:PLBY) menunjukkan posisi terkini di perusahaan oleh institusi dan dana, serta perubahan terbaru dalam ukuran posisi. Pemegang saham utama dapat mencakup investor individu, reksa dana, dana lindung nilai, atau institusi. Jadwal 13D menunjukkan bahwa investor memegang (atau pernah memegang) lebih dari 5% saham perusahaan dan bermaksud (atau pernah bermaksud) untuk secara aktif mengejar perubahan strategi bisnis. Jadwal 13G menunjukkan investasi pasif lebih dari 5%.

The share price as of September 5, 2025 is 1.74 / share. Previously, on September 9, 2024, the share price was 0.57 / share. This represents an increase of 205.32% over that period.

PLBY / Playboy, Inc. Institutional Ownership
Skor Sentimen Dana

Skor Sentimen Dana (sebelumnya dikenal sebagai Skor Akumulasi Kepemilikan) menemukan saham-saham yang paling banyak dibeli oleh dana. Ini adalah hasil dari model kuantitatif multi-faktor yang canggih yang mengidentifikasi perusahaan dengan tingkat akumulasi institusional tertinggi. Model penilaian menggunakan kombinasi dari total peningkatan pemilik yang diungkapkan, perubahan dalam alokasi portofolio pada pemilik tersebut, dan metrik lainnya. Angka berkisar dari 0 hingga 100, dengan angka yang lebih tinggi menunjukkan tingkat akumulasi yang lebih tinggi dibandingkan dengan perusahaan sejenisnya, dan 50 adalah rata-ratanya.

Frekuensi Pembaruan: Setiap Hari

Lihat Ownership Explorer, yang menyediakan daftar perusahaan dengan peringkat tertinggi.

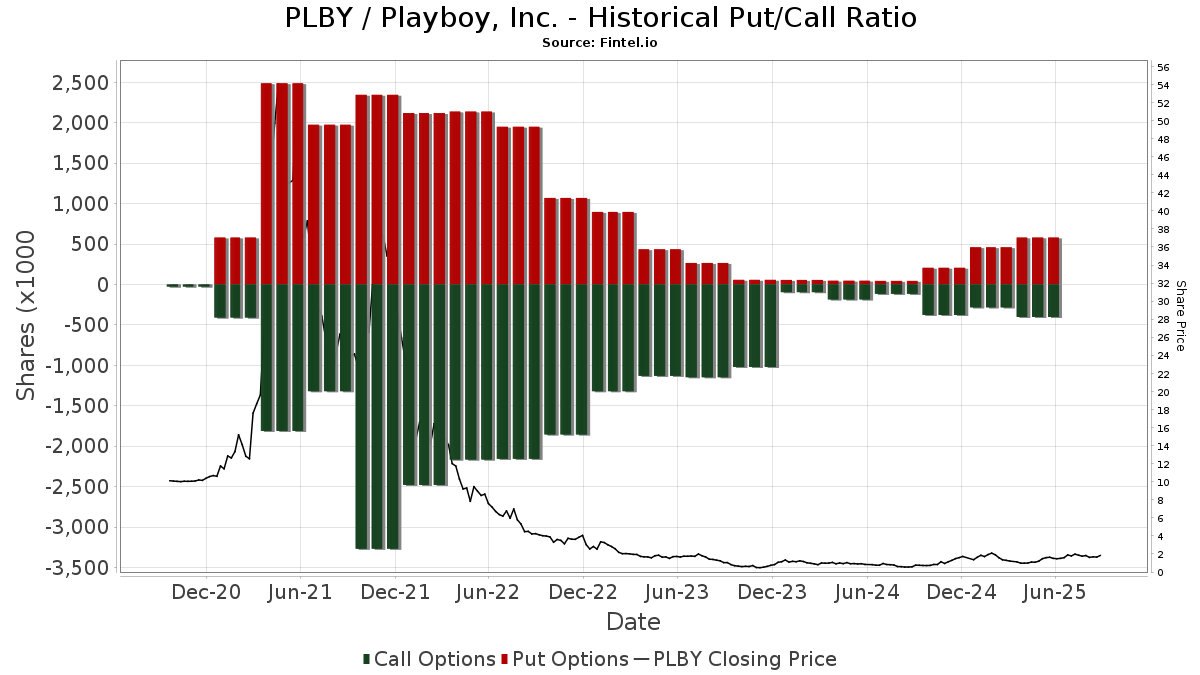
Rasio Put/Call Institusional

Selain melaporkan isu ekuitas dan utang standar, institusi dengan aset di bawah manajemen lebih dari 100 juta dolar AS juga harus mengungkapkan kepemilikan opsi put dan call mereka. Karena opsi put umumnya menunjukkan sentimen negatif, dan opsi call menunjukkan sentimen positif, kita dapat mengetahui sentimen institusional secara keseluruhan dengan memplot rasio put terhadap call. Grafik di sebelah kanan memplot rasio put/call historis untuk instrumen ini.

Menggunakan Rasio Put/Call sebagai indikator sentimen investor mengatasi salah satu kekurangan utama dari penggunaan total kepemilikan institusional, yaitu sejumlah besar aset yang dikelola diinvestasikan secara pasif untuk melacak indeks. Dana yang dikelola secara pasif biasanya tidak membeli opsi, sehingga indikator rasio put/call lebih akurat dalam melacak sentimen dana yang dikelola secara aktif.

PLBY / Playboy, Inc. Historical Put/Call Ratio
Pengajuan 13D/G

Kami menyajikan pengajuan 13D/G secara terpisah dari pengajuan 13F karena perlakuan yang berbeda oleh SEC. Pengajuan 13D/G dapat diajukan oleh kelompok investor (dengan satu pemimpin), sedangkan pengajuan 13F tidak bisa. Hal ini mengakibatkan situasi di mana seorang investor dapat mengajukan 13D/G yang melaporkan satu nilai untuk total saham (mewakili semua saham yang dimiliki oleh kelompok investor), tetapi kemudian mengajukan 13F yang melaporkan nilai yang berbeda untuk total saham (mewakili kepemilikan mereka sendiri). Ini berarti bahwa kepemilikan saham dari pengajuan 13D/G dan pengajuan 13F seringkali tidak dapat dibandingkan secara langsung, sehingga kami menyajikannya secara terpisah.

Catatan: Mulai 16 Mei 2021, kami tidak lagi menampilkan pemilik yang belum mengajukan 13D/G dalam setahun terakhir. Sebelumnya, kami menampilkan riwayat lengkap pengajuan 13D/G. Secara umum, entitas yang diwajibkan untuk mengajukan pengajuan 13D/G harus mengajukan setidaknya setiap tahun sebelum mengirimkan pengajuan penutupan. Namun, terkadang dana keluar dari posisi tanpa mengirimkan pengajuan penutupan (misalnya, mereka menghentikan operasi), sehingga menampilkan riwayat lengkap terkadang menyebabkan kebingungan tentang kepemilikan saat ini. Untuk mencegah kebingungan, kami sekarang hanya menampilkan pemilik 'saat ini' - yaitu - pemilik yang telah mengajukan dalam setahun terakhir.

Upgrade to unlock premium data.

Tanggal File Formulir Investor Sebelumnya
Saham
Terbaru
Saham
Δ Saham
(Persen)
Kepemilikan
(Persen)
Δ Pagmamay-ari
(Persen)
2025-08-26 13G/A FIG Buyer GP, LLC 5,848,953 16,589,531 183.63 15.40 148.39
2025-08-26 13D/A Docler Holding S.a r.l. 14,900,000 14,900,000 0.00 13.90 -12.58
2025-05-06 13D/A RIZVI SUHAIL 18,123,282 18,319,661 1.08 19.50 -21.40
Pengajuan 13F dan NPORT

Detail pada pengajuan 13F tersedia gratis. Detail pada pengajuan NP memerlukan keanggotaan premium. Baris berwarna hijau menunjukkan posisi baru. Baris berwarna merah menunjukkan posisi yang sudah ditutup. Klik tautan ini ikon untuk melihat riwayat transaksi selengkapnya.

Tingkatkan untuk membuka data premium dan mengekspor ke Excel .

Tanggal File Sumber Investor Ketik Presyo ng Avg
(Silangan)
Saham Δ Saham
(%)
Dilaporkan
Nilai
($1000)
Nilai Δ
(%)
Alokasi Port
(%)
2025-08-05 13F Simplex Trading, Llc 89,451 -14.71 0
2025-08-05 13F Simplex Trading, Llc Call 18,800 370.00 0
2025-08-07 13F Resources Investment Advisors, LLC. 13,784 -3.16 22 46.67
2025-08-14 13F Graham Capital Management, L.P. 73,896 -58.00 120 -38.34
2025-08-14 13F Group One Trading, L.p. Put 62,400 -23.62 101 13.48
2025-08-05 13F Simplex Trading, Llc Put 40,600 -36.06 0
2025-05-14 13F Group One Trading, L.p. 0 -100.00 0 -100.00
2025-08-14 13F Group One Trading, L.p. Call 153,600 607.83 249 978.26
2025-08-14 13F Bank Of America Corp /de/ 77,846 -2.74 126 43.18
2025-08-13 13F Northern Trust Corp 184,494 18.12 299 74.27
2025-08-14 13F Headlands Technologies LLC 30,038 9.48 49 60.00
2025-08-14 13F Goldman Sachs Group Inc 79,673 413.89 129 658.82
2025-09-04 13F/A Advisor Group Holdings, Inc. 29,535 -2.52 48 42.42
2025-08-14 13F Wells Fargo & Company/mn 6,500 -1.52 11 42.86
2025-07-28 13F Copia Wealth Management 3,267 -19.35 5 25.00
2025-08-08 13F SBI Securities Co., Ltd. 622 32.34 1
2025-08-18 13F Wolverine Trading, Llc 0 -100.00 0 -100.00
2025-05-28 NP VBINX - Vanguard Balanced Index Fund Investor Shares This fund is a listed as child fund of Vanguard Group Inc and if that institution has disclosed ownership in this security, then these positions will not be double counted when calculating total shares and total value 0 -100.00 0 -100.00
2025-08-18 13F Wolverine Trading, Llc Call 62,800 2.95 104 62.50
2025-07-22 13F IMC-Chicago, LLC Put 162,000 262
2025-08-18 13F Wolverine Trading, Llc Put 42,100 55.35 70 146.43
2025-07-30 13F Insight Advisors, LLC/ PA 23,705 -16.07 38 22.58
2025-07-09 13F Mirador Capital Partners LP 22,089 0.00 36 45.83
2025-08-13 13F Quadrature Capital Ltd 33,656 54
2025-07-15 13F Alhambra Investment Partners LLC 24,962 -10.73 40 33.33
2025-04-25 13F Smallwood Wealth Investment Management, LLC 4 0
2025-04-15 13F West Paces Advisors Inc. 0 -100.00 0
2025-08-14 13F Engineers Gate Manager LP 22,895 57.84 37 146.67
2025-08-12 13F Jpmorgan Chase & Co 3,719 0.00 6 50.00
2025-05-15 13F Cantor Fitzgerald, L. P. 0 -100.00 0 -100.00
2025-08-14 13F Capstone Investment Advisors, Llc 0 -100.00 0
2025-08-05 13F Bank Of Montreal /can/ 49,500 0.00 80 48.15
2025-08-14 13F GWM Advisors LLC 1,542 -69.42 2 -60.00
2025-08-13 13F OMERS ADMINISTRATION Corp 0 -100.00 0 -100.00
2025-08-14 13F Jane Street Group, Llc 17,170 -81.07 28 -72.73
2025-08-14 13F Fortress Investment Group LLC 5,848,953 0.00 9,475 47.29
2025-08-12 13F Steward Partners Investment Advisory, Llc 13,655 29.62 22 100.00
2025-08-14 13F Millennium Management Llc 84,554 -63.35 137 -46.25
2025-07-25 13F Cwm, Llc 1,350 0.00 0
2025-07-24 NP FNCMX - Fidelity Nasdaq Composite Index Fund This fund is a listed as child fund of Fmr Llc and if that institution has disclosed ownership in this security, then these positions will not be double counted when calculating total shares and total value 32,279 0.00 51 2.00
2025-08-15 13F Morse Asset Management, Inc 100 0.00 0
2025-08-14 13F Sunbelt Securities, Inc. 364 0.00 1
2025-08-14 13F Boothbay Fund Management, Llc 25,158 41
2025-05-15 13F Balyasny Asset Management Llc 0 -100.00 0 -100.00
2025-08-15 13F Morgan Stanley 667,226 8.56 1,081 59.76
2025-08-11 13F Vanguard Group Inc 2,662,847 2.79 4,314 51.39
2025-05-15 13F Hrt Financial Lp 0 -100.00 0
2025-08-14 13F State Street Corp 313,051 22.63 507 81.07
2025-07-24 NP FSKAX - Fidelity Total Market Index Fund This fund is a listed as child fund of Fmr Llc and if that institution has disclosed ownership in this security, then these positions will not be double counted when calculating total shares and total value 125,033 0.00 198 2.07
2025-08-08 13F Geode Capital Management, Llc 765,950 0.26 1,241 47.74
2025-08-26 NP EQ ADVISORS TRUST - 1290 VT Micro Cap Portfolio Class IB 11,810 13.67 19 137.50
2025-08-12 13F PSI Advisors, LLC 0 -100.00 0
2025-08-14 13F Qube Research & Technologies Ltd 0 -100.00 0
2025-08-14 13F Royal Bank Of Canada 54,840 338.86 89 584.62
2025-08-08 13F Fortis Group Advisors, LLC 10,210 -16.38 19 38.46
2025-08-28 NP IWC - iShares Micro-Cap ETF This fund is a listed as child fund of BlackRock Inc. and if that institution has disclosed ownership in this security, then these positions will not be double counted when calculating total shares and total value 128,114 19.39 208 149.40
2025-08-05 13F Bank of New York Mellon Corp 10,546 0.00 17 54.55
2025-07-21 13F Patriot Financial Group Insurance Agency, LLC 30,760 42.41 50 113.04
2025-07-21 13F J2 Capital Management Inc 25,000 0.00 40 48.15
2025-08-13 13F Northwestern Mutual Wealth Management Co 1,000 0.00 2 0.00
2025-08-12 13F Virtu Financial LLC 22,231 -64.55 0
2025-06-26 NP USMIX - Extended Market Index Fund 4,600 -22.73 5 -54.55
2025-08-13 13F Renaissance Technologies Llc 643,127 28.43 1,042 89.27
2025-07-28 13F Harbour Investments, Inc. 9,800 0.00 16 50.00
2025-08-27 NP VEXMX - Vanguard Extended Market Index Fund Investor Shares This fund is a listed as child fund of Vanguard Group Inc and if that institution has disclosed ownership in this security, then these positions will not be double counted when calculating total shares and total value 1,009,879 3.76 1,636 52.90
2025-07-30 13F Bogart Wealth, LLC 10,000 0.00 16 45.45
2025-07-31 13F Cambridge Investment Research Advisors, Inc. 0 -100.00 0
2025-08-27 NP VITNX - Vanguard Institutional Total Stock Market Index Fund Institutional Shares This fund is a listed as child fund of Vanguard Group Inc and if that institution has disclosed ownership in this security, then these positions will not be double counted when calculating total shares and total value 35,714 58
2025-08-12 13F LPL Financial LLC 11,168 -8.56 18 38.46
2025-08-14 13F Bnp Paribas Arbitrage, Sa 13,260 -18.65 21 23.53
2025-07-24 NP FSMAX - Fidelity Extended Market Index Fund This fund is a listed as child fund of Fmr Llc and if that institution has disclosed ownership in this security, then these positions will not be double counted when calculating total shares and total value 382,480 4.30 604 6.34
2025-08-13 13F Jones Financial Companies Lllp 432 0.00 1
2025-07-24 NP FCFMX - Fidelity Series Total Market Index Fund This fund is a listed as child fund of Fmr Llc and if that institution has disclosed ownership in this security, then these positions will not be double counted when calculating total shares and total value 113,149 29.37 179 31.85
2025-08-12 13F Proequities, Inc. Put 0 0
2025-08-12 13F Proequities, Inc. Call 0 0
2025-08-12 13F Proequities, Inc. 0 0
2025-07-11 13F Farther Finance Advisors, LLC 0 -100.00 0
2025-07-29 NP Guggenheim Active Allocation Fund 337 0.00 1
2025-05-15 13F Two Sigma Securities, Llc 0 -100.00 0 -100.00
2025-08-14 13F UBS Group AG 652,955 -46.87 1,058 -21.76
2025-08-15 13F Tower Research Capital LLC (TRC) 300 -84.70 0 -100.00
2025-08-12 13F MAI Capital Management 4,347 0.00 7 75.00
2025-08-27 NP VTSMX - Vanguard Total Stock Market Index Fund Investor Shares This fund is a listed as child fund of Vanguard Group Inc and if that institution has disclosed ownership in this security, then these positions will not be double counted when calculating total shares and total value 1,582,683 0.00 2,564 47.30
2025-07-15 13F/A Kure Advisory, LLC 18,596 0.00 30 50.00
2025-08-14 13F Susquehanna International Group, Llp Put 206,800 21.58 335 79.14
2025-08-14 13F Susquehanna International Group, Llp 194,445 83.49 315 171.55
2025-08-14 13F Susquehanna International Group, Llp Call 117,700 -34.36 191 -3.55
2025-08-14 13F Citadel Advisors Llc Put 67,000 -43.12 109 -16.28
2025-08-14 13F Money Concepts Capital Corp 31,622 -2.99 51 45.71
2025-08-15 13F Kestra Advisory Services, LLC 19,277 -4.42 31 40.91
2025-08-12 13F XTX Topco Ltd 124,310 192.37 201 336.96
2025-08-14 13F Citadel Advisors Llc 570,612 -9.78 924 32.95
2025-08-14 13F Citadel Advisors Llc Call 50,000 190.70 81 350.00
2025-08-14 13F Raymond James Financial Inc 3,539 6
2025-05-13 13F Caitong International Asset Management Co., Ltd 0 -100.00 0
2025-05-29 NP JAFEX - Total Stock Market Index Trust NAV 1,519 150.25 2
2025-08-13 13F Crcm Lp 706,620 -57.50 1,145 -37.45
2025-08-27 13F/A Squarepoint Ops LLC 75,052 -21.36 122 16.35
2025-08-12 13F Sfmg, Llc 275,000 -33.09 446 -1.55
2025-08-12 13F BlackRock, Inc. 565,237 34.51 916 98.05
2025-08-14 13F Cubist Systematic Strategies, LLC 36,248 59
2025-08-11 13F Citigroup Inc 5 0.00 0
2025-08-12 13F CIBC Private Wealth Group, LLC 4,000 0.00 6 100.00
Fintel data has been cited in the following publications:
Daily Mail Fox Business Business Insider Wall Street Journal The Washington Post Bloomberg Financial Times Globe and Mail
NASDAQ.com Reuters The Guardian Associated Press FactCheck.org Snopes Politifact
Federal Register The Intercept Forbes Fortune Magazine TheStreet Time Magazine Canadian Broadcasting Corporation International Business Times
Cambridge University Press Investopedia MarketWatch NY Daily News Entrepreneur Newsweek Barron's El Economista