Mga Batayang Estadistika
| Pemilik Institusional | 259 total, 257 long only, 0 short only, 2 long/short - change of 85.00% MRQ |
| Alokasi Portofolio Rata-rata | 0.2303 % - change of -5.51% MRQ |
| Saham Institusional (Jangka Panjang) | 18,834,717 (ex 13D/G) - change of 8.01MM shares 74.04% MRQ |
| Nilai Institusional (Jangka Panjang) | $ 1,061,643 USD ($1000) |
Kepemilikan Institusional dan Pemegang Saham
Global X Funds - Global X Defense Tech ETF (US:SHLD) memiliki 259 pemilik institusional dan pemegang saham yang telah mengajukan formulir 13D/G atau 13F kepada Komisi Bursa Efek (Securities Exchange Commission/SEC). Lembaga-lembaga ini memegang total 18,834,717 saham. Pemegang saham terbesar meliputi Bank Of America Corp /de/, LPL Financial LLC, Morgan Stanley, MIRAE ASSET GLOBAL ETFS HOLDINGS Ltd., Royal Bank Of Canada, Thrivent Financial For Lutherans, Stifel Financial Corp, Raymond James Financial Inc, Benjamin Edwards Inc, and Advisor Group Holdings, Inc. .
Struktur kepemilikan institusional Global X Funds - Global X Defense Tech ETF (ARCA:SHLD) menunjukkan posisi terkini di perusahaan oleh institusi dan dana, serta perubahan terbaru dalam ukuran posisi. Pemegang saham utama dapat mencakup investor individu, reksa dana, dana lindung nilai, atau institusi. Jadwal 13D menunjukkan bahwa investor memegang (atau pernah memegang) lebih dari 5% saham perusahaan dan bermaksud (atau pernah bermaksud) untuk secara aktif mengejar perubahan strategi bisnis. Jadwal 13G menunjukkan investasi pasif lebih dari 5%.
The share price as of September 5, 2025 is 62.12 / share. Previously, on September 9, 2024, the share price was 36.42 / share. This represents an increase of 70.57% over that period.

Skor Sentimen Dana
Skor Sentimen Dana (sebelumnya dikenal sebagai Skor Akumulasi Kepemilikan) menemukan saham-saham yang paling banyak dibeli oleh dana. Ini adalah hasil dari model kuantitatif multi-faktor yang canggih yang mengidentifikasi perusahaan dengan tingkat akumulasi institusional tertinggi. Model penilaian menggunakan kombinasi dari total peningkatan pemilik yang diungkapkan, perubahan dalam alokasi portofolio pada pemilik tersebut, dan metrik lainnya. Angka berkisar dari 0 hingga 100, dengan angka yang lebih tinggi menunjukkan tingkat akumulasi yang lebih tinggi dibandingkan dengan perusahaan sejenisnya, dan 50 adalah rata-ratanya.
Frekuensi Pembaruan: Setiap Hari
Lihat Ownership Explorer, yang menyediakan daftar perusahaan dengan peringkat tertinggi.
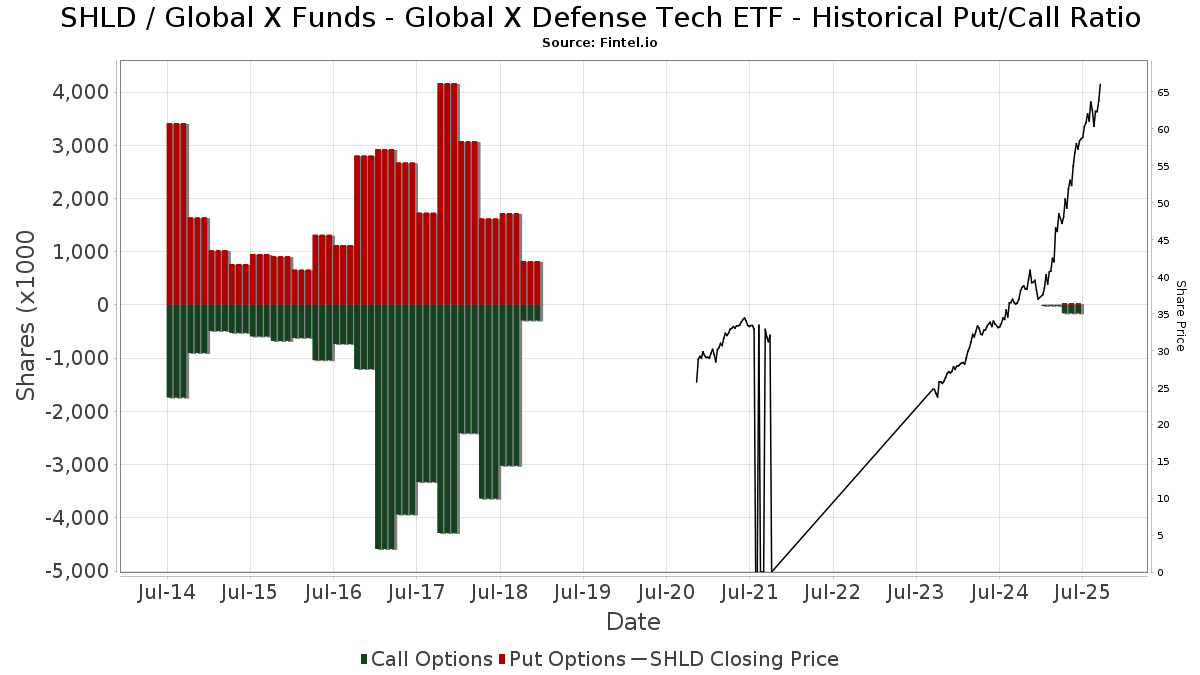
Rasio Put/Call Institusional
Selain melaporkan isu ekuitas dan utang standar, institusi dengan aset di bawah manajemen lebih dari 100 juta dolar AS juga harus mengungkapkan kepemilikan opsi put dan call mereka. Karena opsi put umumnya menunjukkan sentimen negatif, dan opsi call menunjukkan sentimen positif, kita dapat mengetahui sentimen institusional secara keseluruhan dengan memplot rasio put terhadap call. Grafik di sebelah kanan memplot rasio put/call historis untuk instrumen ini.
Menggunakan Rasio Put/Call sebagai indikator sentimen investor mengatasi salah satu kekurangan utama dari penggunaan total kepemilikan institusional, yaitu sejumlah besar aset yang dikelola diinvestasikan secara pasif untuk melacak indeks. Dana yang dikelola secara pasif biasanya tidak membeli opsi, sehingga indikator rasio put/call lebih akurat dalam melacak sentimen dana yang dikelola secara aktif.
Pengajuan 13F dan NPORT
Detail pada pengajuan 13F tersedia gratis. Detail pada pengajuan NP memerlukan keanggotaan premium. Baris berwarna hijau menunjukkan posisi baru. Baris berwarna merah menunjukkan posisi yang sudah ditutup. Klik tautan ini ikon untuk melihat riwayat transaksi selengkapnya.
Tingkatkan
untuk membuka data premium dan mengekspor ke Excel ![]() .
.
| Tanggal File | Sumber | Investor | Ketik | Presyo ng Avg (Silangan) |
Saham | Δ Saham (%) |
Dilaporkan Nilai ($1000) |
Nilai Δ (%) |
Alokasi Port (%) |
|
|---|---|---|---|---|---|---|---|---|---|---|
| 2025-08-11 | 13F | Kirtland Hills Capital Management, Llc | 6,923 | 417 | ||||||
| 2025-08-05 | 13F | American Institute for Advanced Investment Management, LLP | 11,630 | 701 | ||||||
| 2025-07-31 | 13F | Cambridge Investment Research Advisors, Inc. | 174,566 | 81.78 | 11 | 150.00 | ||||
| 2025-07-18 | 13F | Truist Financial Corp | 8,322 | 58.09 | 501 | 104.49 | ||||
| 2025-08-13 | 13F | BCJ Capital Management, LLC | 7,694 | 464 | ||||||
| 2025-07-08 | 13F | Zrc Wealth Management, Llc | 1,888 | 182.21 | 114 | 264.52 | ||||
| 2025-08-11 | 13F | Wealthspire Advisors, LLC | 10,885 | 45.17 | 656 | 87.68 | ||||
| 2025-08-14 | 13F | D. E. Shaw & Co., Inc. | 161,965 | 9,758 | ||||||
| 2025-08-11 | 13F | Private Advisor Group, LLC | 45,592 | 2,747 | ||||||
| 2025-08-12 | 13F | Inscription Capital, LLC | 5,725 | 345 | ||||||
| 2025-08-12 | 13F | OneAscent Financial Services LLC | 12,079 | 1 | ||||||
| 2025-08-14 | 13F | Qube Research & Technologies Ltd | 29,734 | 3,654.29 | 1,791 | 4,875.00 | ||||
| 2025-07-17 | 13F | HB Wealth Management, LLC | 6,261 | 377 | ||||||
| 2025-07-08 | 13F | Baker Ellis Asset Management LLC | 3,360 | 202 | ||||||
| 2025-07-07 | 13F | Fox Hill Wealth Management | 3,663 | 221 | ||||||
| 2025-04-23 | 13F | Mascagni Wealth Management, Inc. | 0 | -100.00 | 0 | -100.00 | ||||
| 2025-07-17 | 13F | Oak Family Advisors, Llc | 153,014 | 140.34 | 9,219 | 211.14 | ||||
| 2025-08-13 | 13F | Keystone Financial Group | 5,285 | 15.42 | 318 | 49.30 | ||||
| 2025-07-09 | 13F | Sterling Manor Financial, LLC | 123,111 | -16.94 | 7,418 | 7.51 | ||||
| 2025-05-15 | 13F | Certior Financial Group, Llc | 0 | -100.00 | 0 | |||||
| 2025-05-01 | 13F | Diversify Wealth Management, Llc | 0 | -100.00 | 0 | |||||
| 2025-08-13 | 13F | Brown Advisory Inc | 18,868 | 82.95 | 1,137 | 136.67 | ||||
| 2025-08-12 | 13F | Pathstone Holdings, LLC | 4,950 | 298 | ||||||
| 2025-08-05 | 13F | Bank of New York Mellon Corp | 7,353 | 38.32 | 443 | 79.35 | ||||
| 2025-04-30 | 13F | Cerity Partners LLC | 0 | -100.00 | 0 | |||||
| 2025-07-15 | 13F | StoneCrest Wealth Management, Inc. | 74,645 | 4,497 | ||||||
| 2025-08-12 | 13F | MAI Capital Management | 17,293 | 40.67 | 1,042 | 81.99 | ||||
| 2025-08-11 | 13F | HighTower Advisors, LLC | 14,611 | 880 | ||||||
| 2025-08-05 | 13F | Dunhill Financial, LLC | 250 | 0.00 | 15 | 36.36 | ||||
| 2025-06-30 | NP | SMILX - SMI 50/40/10 Fund | 19,910 | 1,032 | ||||||
| 2025-07-08 | 13F | Parallel Advisors, LLC | 1,702 | 103 | ||||||
| 2025-08-06 | 13F | Ethos Financial Group, LLC | 55,561 | -4.49 | 3,354 | 53.57 | ||||
| 2025-07-22 | 13F | Kercheville Advisors, LLC | 4,700 | 283 | ||||||
| 2025-08-18 | 13F | Wolverine Trading, Llc | Call | 33,100 | 1,959 | |||||
| 2025-07-28 | 13F | RFG Advisory, LLC | 17,816 | 7.66 | 1,073 | 39.35 | ||||
| 2025-08-15 | 13F | Equitable Holdings, Inc. | 25,717 | 73.28 | 1,549 | 124.49 | ||||
| 2025-08-07 | 13F | Resources Investment Advisors, LLC. | 4,748 | -3.71 | 286 | 24.89 | ||||
| 2025-08-14 | 13F | Royal Bank Of Canada | 699,226 | 36.53 | 42,129 | 76.72 | ||||
| 2025-07-29 | 13F | TFC Financial Management | 0 | -100.00 | 0 | |||||
| 2025-08-08 | 13F | Creative Planning | 4,198 | 253 | ||||||
| 2025-07-16 | 13F | Perigon Wealth Management, LLC | 49,270 | 2,969 | ||||||
| 2025-07-10 | 13F | Signal Advisors Wealth, LLC | 9,103 | 45.65 | 548 | 88.97 | ||||
| 2025-07-16 | 13F | Signaturefd, Llc | 167 | 209.26 | 10 | 400.00 | ||||
| 2025-07-24 | 13F | IFP Advisors, Inc | 8,999 | 260.97 | 542 | 367.24 | ||||
| 2025-07-24 | 13F | Us Bancorp \de\ | 500 | 30 | ||||||
| 2025-08-01 | 13F | First Command Advisory Services, Inc. | 539 | 32 | ||||||
| 2025-07-16 | 13F | Highline Wealth Partners Llc | 3,425 | 1,270.00 | 206 | 1,772.73 | ||||
| 2025-08-08 | 13F | Cetera Investment Advisers | 253,522 | 189.77 | 15,275 | 275.10 | ||||
| 2025-08-14 | 13F | Old Mission Capital Llc | 29,446 | -69.99 | 1,774 | -61.16 | ||||
| 2025-08-06 | 13F | Hallmark Capital Management Inc | 98,396 | -9.57 | 5,928 | 17.06 | ||||
| 2025-08-13 | 13F | Custom Index Systems, Llc | 10,274 | 43.19 | 619 | 85.89 | ||||
| 2025-08-15 | 13F | Morgan Stanley | 1,711,271 | 124.79 | 103,104 | 190.95 | ||||
| 2025-07-31 | 13F/A | Avion Wealth | 1,000 | 0 | ||||||
| 2025-08-07 | 13F | Investment Management Corp /va/ /adv | 35 | 2 | ||||||
| 2025-08-13 | 13F | Per Stirling Capital Management, LLC. | 7,724 | 465 | ||||||
| 2025-07-31 | 13F | Trademark Financial Management, LLC | 4,300 | 259 | ||||||
| 2025-05-12 | 13F | Sandy Spring Bank | 0 | -100.00 | 0 | |||||
| 2025-08-13 | 13F | Renaissance Technologies Llc | 76,897 | 4,633 | ||||||
| 2025-08-08 | 13F | Evolution Wealth Advisors, LLC | 28,650 | 1,726 | ||||||
| 2025-07-10 | 13F | Wealth Enhancement Advisory Services, Llc | 3,936 | 233 | ||||||
| 2025-07-10 | 13F | Focus Financial Network, Inc. | 0 | -100.00 | 0 | |||||
| 2025-07-16 | 13F | ORG Partners LLC | 17,565 | 3.00 | 1,034 | 28.93 | ||||
| 2025-08-12 | 13F | Jpmorgan Chase & Co | 291,846 | 202.12 | 17,584 | 291.08 | ||||
| 2025-07-14 | 13F | Westend Capital Management LLC | 25 | 2 | ||||||
| 2025-08-07 | 13F | Cascade Financial Partners, LLC | 12,457 | 0.06 | 751 | 29.53 | ||||
| 2025-08-12 | 13F | Proequities, Inc. | 0 | 0 | ||||||
| 2025-08-14 | 13F | Wells Fargo & Company/mn | 6,960 | -34.18 | 419 | -14.84 | ||||
| 2025-08-11 | 13F | Alteri Wealth LLC | 4,827 | 12.18 | 291 | 45.00 | ||||
| 2025-08-18 | 13F | Hollencrest Capital Management | 25 | 0.00 | 2 | 0.00 | ||||
| 2025-08-13 | 13F | Centiva Capital, LP | 35,000 | 2,109 | ||||||
| 2025-08-13 | 13F | Northwestern Mutual Wealth Management Co | 5,708 | 89.89 | 344 | 146.76 | ||||
| 2025-08-14 | 13F | Toroso Investments, LLC | 38,000 | 2,290 | ||||||
| 2025-08-11 | 13F | Regal Investment Advisors LLC | 5,079 | 306 | ||||||
| 2025-08-14 | 13F | Visionary Wealth Advisors | 9,013 | -31.94 | 543 | -11.85 | ||||
| 2025-05-07 | 13F | Norden Group Llc | 0 | -100.00 | 0 | |||||
| 2025-08-13 | 13F | Colonial Trust Advisors | 150 | 9 | ||||||
| 2025-08-14 | 13F | CoreCap Advisors, LLC | 65 | 18.18 | 4 | 50.00 | ||||
| 2025-05-13 | 13F | Alliance Wealth Advisors, LLC /UT | 0 | -100.00 | 0 | |||||
| 2025-08-08 | 13F | SBI Securities Co., Ltd. | 9,633 | 580 | ||||||
| 2025-05-12 | 13F | Townsquare Capital Llc | 0 | -100.00 | 0 | |||||
| 2025-08-13 | 13F | Jones Financial Companies Lllp | 0 | -100.00 | 0 | -100.00 | ||||
| 2025-09-04 | 13F/A | Advisor Group Holdings, Inc. | 372,597 | 111.03 | 22,448 | 173.16 | ||||
| 2025-08-14 | 13F | Raymond James Financial Inc | 427,821 | -56.16 | 25,776 | -43.26 | ||||
| 2025-05-07 | 13F | Prosperity Consulting Group, LLC | 0 | -100.00 | 0 | |||||
| 2025-07-24 | 13F | Stonebridge Financial Group, LLC | 0 | -100.00 | 0 | |||||
| 2025-08-13 | 13F | Cresset Asset Management, LLC | 5,482 | 331 | ||||||
| 2025-08-05 | 13F | Prosperity Wealth Management, Inc. | 10,642 | 25.67 | 641 | 62.69 | ||||
| 2025-08-07 | 13F | New England Private Wealth Advisors LLC | 9,973 | 86.13 | 609 | 144.58 | ||||
| 2025-08-04 | 13F | Atria Investments Llc | 15,123 | 84.54 | 911 | 139.11 | ||||
| 2025-08-14 | 13F | Mariner, LLC | 21,754 | 1,311 | ||||||
| 2025-08-14 | 13F | Comerica Bank | 7,280 | -9.39 | 439 | 17.43 | ||||
| 2025-07-30 | 13F | Bleakley Financial Group, LLC | 27,340 | 1,647 | ||||||
| 2025-08-14 | 13F | MIRAE ASSET GLOBAL ETFS HOLDINGS Ltd. | 1,063,557 | 342.13 | 63,393 | 466.40 | ||||
| 2025-08-18 | 13F/A | National Bank Of Canada /fi/ | 37,478 | 108.79 | 2,256 | 170.50 | ||||
| 2025-07-30 | NP | ENDW - Cambria Endowment Style ETF | 21 | 1 | ||||||
| 2025-08-04 | 13F | Migdal Insurance & Financial Holdings Ltd. | 0 | -100.00 | 0 | |||||
| 2025-08-04 | 13F | Pensionmark Financial Group, Llc | 41,195 | 78.98 | 2,482 | 131.65 | ||||
| 2025-08-04 | 13F | Virtus Family Office LLC | 9,746 | 0.00 | 588 | 29.80 | ||||
| 2025-08-14 | 13F | Beck Capital Management, Llc | 163,698 | 53.57 | 9,863 | 98.75 | ||||
| 2025-08-13 | 13F | JT Stratford LLC | 3,850 | 232 | ||||||
| 2025-08-12 | 13F | Bravias Capital Group, LLC | 5,333 | 321 | ||||||
| 2025-07-11 | 13F | Farther Finance Advisors, LLC | 15,585 | 939 | ||||||
| 2025-08-13 | 13F | Walleye Capital LLC | 18,835 | 1,135 | ||||||
| 2025-07-16 | 13F | Strategic Investment Solutions, Inc. /IL | 873 | 31.48 | 53 | 73.33 | ||||
| 2025-07-11 | 13F | Pinnacle Bancorp, Inc. | 79 | 5 | ||||||
| 2025-08-13 | 13F | Channing Global Advisors, Llc | 49 | 0.00 | 3 | 0.00 | ||||
| 2025-08-12 | 13F | Insigneo Advisory Services, Llc | 7,133 | 11.75 | 430 | 44.44 | ||||
| 2025-08-14 | 13F | CIBC World Markets Inc. | 24,451 | 1,473 | ||||||
| 2025-08-05 | 13F | Bank Of Montreal /can/ | 7,139 | 1,099.83 | 430 | 1,492.59 | ||||
| 2025-08-14 | 13F | Great Valley Advisor Group, Inc. | 12,578 | 28.16 | 758 | 66.01 | ||||
| 2025-08-12 | 13F | Hillsdale Investment Management Inc. | 120 | 166.67 | 7 | 250.00 | ||||
| 2025-05-13 | 13F | Marathon Trading Investment Management LLC | 0 | -100.00 | 0 | |||||
| 2025-05-01 | 13F | 3EDGE Asset Management, LP | 0 | -100.00 | 0 | |||||
| 2025-07-10 | 13F | Sharkey, Howes & Javer | 92,574 | 4.45 | 5,578 | 35.20 | ||||
| 2025-07-18 | 13F | Marks Wealth, LLC | 230,922 | 13,913 | ||||||
| 2025-08-14 | 13F | Mml Investors Services, Llc | 223,498 | 141.85 | 13 | 225.00 | ||||
| 2025-08-14 | 13F | Menora Mivtachim Holdings Ltd. | 22,050 | 69.62 | 1,329 | 119.50 | ||||
| 2025-08-15 | 13F | Prevail Innovative Wealth Advisors, Llc | 33,935 | 2,045 | ||||||
| 2025-07-22 | 13F | Belpointe Asset Management LLC | 52,707 | 644.24 | 3,176 | 865.05 | ||||
| 2025-08-11 | 13F | Western Wealth Management, LLC | 3,652 | 220 | ||||||
| 2025-08-07 | 13F | Proficio Capital Partners LLC | 100,694 | 6,067 | ||||||
| 2025-07-07 | 13F | Investors Research Corp | 683 | 0.44 | 41 | 32.26 | ||||
| 2025-08-13 | 13F | Tranquilli Financial Advisor LLC | 10,005 | 603 | ||||||
| 2025-07-23 | 13F | Clear Creek Financial Management, LLC | 5,730 | 345 | ||||||
| 2025-08-12 | 13F | Manchester Capital Management LLC | 3,447 | 208 | ||||||
| 2025-07-22 | 13F | Valeo Financial Advisors, LLC | 3,838 | 231 | ||||||
| 2025-08-14 | 13F | Citadel Advisors Llc | 137,105 | 521.00 | 8,261 | 704.28 | ||||
| 2025-08-14 | 13F | Citadel Advisors Llc | Put | 20,700 | 2,200.00 | 1,247 | 2,941.46 | |||
| 2025-07-22 | 13F | Brown Miller Wealth Management, LLC | 14,861 | -0.19 | 895 | 29.15 | ||||
| 2025-07-29 | 13F | Swmg, Llc | 3,639 | 221 | ||||||
| 2025-08-14 | 13F | Citadel Advisors Llc | Call | 55,600 | 55,500.00 | 3,350 | 83,625.00 | |||
| 2025-08-05 | 13F | Chase Investment Counsel Corp | 10,997 | 1 | ||||||
| 2025-07-15 | 13F | BigSur Wealth Management LLC | 13,245 | 800 | ||||||
| 2025-07-07 | 13F | Nova Wealth Management, Inc. | 152 | 9 | ||||||
| 2025-08-11 | 13F | Intrepid Financial Planning Group LLC | 4,730 | 285 | ||||||
| 2025-08-08 | 13F | New England Capital Financial Advisors LLC | 132 | 8 | ||||||
| 2025-08-04 | 13F | Integrity Alliance, Llc. | 13,706 | 826 | ||||||
| 2025-08-07 | 13F | Kestra Private Wealth Services, Llc | 10,884 | 9.09 | 656 | 41.16 | ||||
| 2025-08-12 | 13F | O'shaughnessy Asset Management, Llc | 671 | -55.27 | 40 | -42.03 | ||||
| 2025-08-14 | 13F | Bank Of America Corp /de/ | 3,522,494 | 74.09 | 212,230 | 125.33 | ||||
| 2025-04-23 | 13F | Continuum Advisory, LLC | 0 | -100.00 | 0 | -100.00 | ||||
| 2025-07-17 | 13F | Janney Montgomery Scott LLC | 14,073 | 6.57 | 1 | |||||
| 2025-08-14 | 13F | Jane Street Group, Llc | 320,000 | 161.70 | 19,280 | 238.72 | ||||
| 2025-07-29 | 13F | Stratos Wealth Partners, LTD. | 95,310 | 183.80 | 5,742 | 267.37 | ||||
| 2025-08-14 | 13F/A | Rockefeller Capital Management L.P. | 48,442 | 22.39 | 2,919 | 58.41 | ||||
| 2025-07-23 | 13F | Capstone Wealth Management Group, Llc | 0 | -100.00 | 0 | |||||
| 2025-07-16 | 13F | St Germain D J Co Inc | 122 | 7 | ||||||
| 2025-08-14 | 13F | Integrated Wealth Concepts LLC | 4,279 | 258 | ||||||
| 2025-08-14 | 13F | Gotham Asset Management, LLC | 17,702 | 1.24 | 1,067 | 31.12 | ||||
| 2025-08-06 | 13F | SOUTH STATE Corp | 0 | -100.00 | 0 | |||||
| 2025-08-15 | 13F | Keel Point, LLC | 40,032 | -0.06 | 2,412 | 29.35 | ||||
| 2025-08-19 | 13F | Advisory Services Network, LLC | 16,482 | 1,011 | ||||||
| 2025-07-11 | 13F | First PREMIER Bank | 650 | 0.00 | 0 | |||||
| 2025-07-29 | 13F | Activest Wealth Management | 0 | 0 | ||||||
| 2025-08-08 | 13F | Principal Financial Group Inc | 28,039 | 1,689 | ||||||
| 2025-07-21 | 13F | Ameritas Advisory Services, LLC | 1,790 | 108 | ||||||
| 2025-08-14 | 13F | Benjamin Edwards Inc | 381,878 | -24.65 | 23,008 | -2.48 | ||||
| 2025-08-08 | 13F | Comprehensive Financial Planning, Inc./PA | 0 | -100.00 | 0 | |||||
| 2025-08-01 | 13F | Vision Financial Markets Llc | 100 | 6 | ||||||
| 2025-08-11 | 13F | Principal Securities, Inc. | 18,501 | 7,300.40 | 1,115 | 12,277.78 | ||||
| 2025-08-05 | 13F | Sigma Planning Corp | 7,844 | 473 | ||||||
| 2025-08-12 | 13F | Terra Nova Asset Management LLC | 23,414 | 1.41 | 1,411 | 31.28 | ||||
| 2025-08-12 | 13F | Edmond De Rothschild Holding S.a. | 20,233 | 0.00 | 1,219 | 29.54 | ||||
| 2025-08-12 | 13F | Financial Advocates Investment Management | 28,748 | 10.15 | 1,732 | 42.67 | ||||
| 2025-08-14 | 13F | Financial Network Wealth Advisors LLC | 129 | 0.00 | 8 | 16.67 | ||||
| 2025-07-28 | 13F | Mutual Advisors, LLC | 3,505 | 217 | ||||||
| 2025-07-30 | 13F | Prosperity Financial Group, Inc. | 23,105 | 0.28 | 1,392 | 29.85 | ||||
| 2025-07-15 | 13F | Mather Group, Llc. | 0 | -100.00 | 0 | |||||
| 2025-08-08 | 13F | Gts Securities Llc | 25,392 | 1,530 | ||||||
| 2025-05-14 | 13F | Flow Traders U.s. Llc | 0 | -100.00 | 0 | |||||
| 2025-08-13 | 13F | Lauer Wealth, LLC | 10,164 | 622 | ||||||
| 2025-07-31 | 13F | Oppenheimer & Co Inc | 62,153 | 25.41 | 3,745 | 62.36 | ||||
| 2025-08-15 | 13F | Tower Research Capital LLC (TRC) | 166 | 10 | ||||||
| 2025-04-14 | 13F | Toth Financial Advisory Corp | 0 | -100.00 | 0 | |||||
| 2025-05-05 | 13F | Diversify Advisory Services, LLC | 0 | -100.00 | 0 | |||||
| 2025-08-05 | 13F | Financial Sense Advisors, Inc. | 66,616 | 39.44 | 4,014 | 80.52 | ||||
| 2025-08-08 | 13F | Parker Investment Management, LLC | 319,966 | 19,278 | ||||||
| 2025-07-28 | 13F | Copia Wealth Management | 1,383 | 83 | ||||||
| 2025-08-12 | 13F | Marshall & Sterling Wealth Advisors Inc. | 2,661 | 160 | ||||||
| 2025-05-09 | 13F | GeoWealth Management, LLC | 0 | -100.00 | 0 | |||||
| 2025-08-14 | 13F | Manufacturers Life Insurance Company, The | 5,365 | 323 | ||||||
| 2025-08-06 | 13F | Commonwealth Equity Services, Llc | 104,078 | 91.75 | 6 | 200.00 | ||||
| 2025-04-24 | 13F | Gold Investment Management Ltd. | 0 | -100.00 | 0 | |||||
| 2025-08-11 | 13F | Inspire Advisors, LLC | 4,765 | 287 | ||||||
| 2025-08-01 | 13F | Y-Intercept (Hong Kong) Ltd | 4,021 | 242 | ||||||
| 2025-05-15 | 13F | National Wealth Management Group, LLC | 7,914 | 42.21 | 368 | 76.92 | ||||
| 2025-07-18 | 13F | SMI Advisory Services, LLC | 159,858 | 9,724 | ||||||
| 2025-08-04 | 13F | Joseph P. Lucia & Associates, LLC | 5,048 | 0.00 | 304 | 29.91 | ||||
| 2025-08-13 | 13F | Smith, Moore & Co. | 8,737 | 16.52 | 526 | 50.72 | ||||
| 2025-08-14 | 13F | Hrt Financial Lp | 14,650 | 1 | ||||||
| 2025-08-13 | 13F | Summit Financial, LLC | 5,678 | 343 | ||||||
| 2025-08-14 | 13F | MGB Wealth Management, LLC | 18,654 | 23.15 | 1,123 | 59.29 | ||||
| 2025-05-15 | 13F | Vista Cima Wealth Management LLC | 45,000 | 0 | ||||||
| 2025-08-08 | 13F | Kingsview Wealth Management, LLC | 4,180 | 252 | ||||||
| 2025-08-14 | 13F | Horizon Investments, LLC | 4 | 0 | ||||||
| 2025-08-07 | 13F | Financially Speaking Inc | 88,580 | 5,337 | ||||||
| 2025-08-12 | 13F | Change Path, LLC | 0 | -100.00 | 0 | |||||
| 2025-08-14 | 13F | First International Bank of Israel Ltd. | 37,490 | 2,259 | ||||||
| 2025-07-30 | 13F | Bogart Wealth, LLC | 45 | 3 | ||||||
| 2025-08-07 | 13F | Pinnacle Wealth Management Advisory Group, LLC | 5,000 | 0.00 | 301 | 29.74 | ||||
| 2025-08-06 | 13F | AE Wealth Management LLC | 145,647 | 6,288.03 | 8,775 | 8,178.30 | ||||
| 2025-07-15 | 13F | North Star Investment Management Corp. | 800 | 819.54 | 48 | 2,300.00 | ||||
| 2025-07-25 | 13F | Cwm, Llc | 1,311 | 20.83 | 0 | |||||
| 2025-08-08 | 13F | POM Investment Strategies, LLC | 933 | 56 | ||||||
| 2025-07-30 | 13F | Wallace Advisory Group, LLC | 0 | -100.00 | 0 | |||||
| 2025-08-08 | 13F | Thoroughbred Financial Services, Llc | 20,242 | 304.84 | 1 | |||||
| 2025-08-14 | 13F | UBS Group AG | 142,236 | -34.03 | 8,570 | -14.62 | ||||
| 2025-08-01 | 13F | Solstein Capital, LLC | 24,410 | 12,680.10 | 1,471 | 18,275.00 | ||||
| 2025-07-30 | 13F | D.a. Davidson & Co. | 22,648 | 33.34 | 1,365 | 72.66 | ||||
| 2025-08-14 | 13F | Stifel Financial Corp | 486,463 | -22.55 | 29,310 | 0.25 | ||||
| 2025-08-19 | 13F | Newbridge Financial Services Group, Inc. | 75 | 5 | ||||||
| 2025-04-28 | 13F | American Capital Advisory, LLC | 0 | -100.00 | 0 | |||||
| 2025-08-08 | 13F | Pnc Financial Services Group, Inc. | 100 | 6 | ||||||
| 2025-07-17 | 13F | Tempus Wealth Planning, LLC | 4,103 | 247 | ||||||
| 2025-07-16 | 13F | Essex Financial Services, Inc. | 7,125 | 429 | ||||||
| 2025-08-12 | 13F | Global Retirement Partners, LLC | 1,927 | 116 | ||||||
| 2025-05-15 | 13F | Mercer Global Advisors Inc /adv | 0 | -100.00 | 0 | |||||
| 2025-07-25 | 13F | LRI Investments, LLC | 750 | 45 | ||||||
| 2025-07-15 | 13F | Financial Partners Group, Inc | 6,673 | 402 | ||||||
| 2025-07-30 | 13F | Crewe Advisors LLC | 1,741 | 105 | ||||||
| 2025-08-14 | 13F | Susquehanna International Group, Llp | Put | 8,500 | 512 | |||||
| 2025-05-14 | 13F | CIBC Private Wealth Group, LLC | 0 | -100.00 | 0 | -100.00 | ||||
| 2025-07-29 | 13F | Ballast, Inc. | 5,048 | 304 | ||||||
| 2025-08-14 | 13F | Susquehanna International Group, Llp | 37,989 | 17.80 | 2,289 | 52.43 | ||||
| 2025-08-26 | 13F/A | Thrivent Financial For Lutherans | 495,610 | 30 | ||||||
| 2025-07-22 | 13F | Foguth Wealth Management, LLC. | 9,188 | 47.01 | 554 | 90.69 | ||||
| 2025-08-04 | 13F | Pinnacle Associates Ltd | 9,675 | 9.32 | 583 | 41.61 | ||||
| 2025-08-12 | 13F | LPL Financial LLC | 1,995,676 | 71.62 | 120,239 | 122.13 | ||||
| 2025-08-01 | 13F | James Investment Research Inc | 74,020 | 55.68 | 4,460 | 101.49 | ||||
| 2025-07-22 | 13F | Merit Financial Group, LLC | 79,331 | -51.93 | 4,780 | -37.79 | ||||
| 2025-08-01 | 13F | Envestnet Asset Management Inc | 124,237 | 91.79 | 7,485 | 148.26 | ||||
| 2025-08-07 | 13F | Allworth Financial LP | 240 | 0.00 | 14 | 16.67 | ||||
| 2025-07-01 | 13F | Confluence Investment Management Llc | 160,759 | -26.72 | 9,686 | -5.15 | ||||
| 2025-08-20 | 13F/A | Thompson Davis & Co., Inc. | 6,000 | 362 | ||||||
| 2025-07-24 | 13F | Cascade Investment Group, Inc. | 3,545 | 214 | ||||||
| 2025-08-04 | 13F | Hantz Financial Services, Inc. | 101 | 0 | ||||||
| 2025-08-11 | 13F | Aptus Capital Advisors, LLC | 3,389 | 204 | ||||||
| 2025-08-14 | 13F | Potentia Wealth | 0 | -100.00 | 0 | |||||
| 2025-07-11 | 13F | Seacrest Wealth Management, Llc | 4,363 | 263 | ||||||
| 2025-07-16 | 13F | Owen LaRue, LLC | 14,626 | -12.68 | 881 | 13.09 | ||||
| 2025-08-01 | 13F | Brookwood Investment Group LLC | 3,844 | 232 | ||||||
| 2025-08-13 | 13F | EverSource Wealth Advisors, LLC | 23 | 1 | ||||||
| 2025-07-30 | 13F | Phoenix Holdings Ltd. | 139,088 | 6.53 | 8,381 | 37.91 | ||||
| 2025-08-12 | 13F | Steward Partners Investment Advisory, Llc | 71,785 | 773.40 | 4,325 | 1,032.20 | ||||
| 2025-08-14 | 13F | Susquehanna International Group, Llp | Call | 65,900 | 435.77 | 3,970 | 594.06 | |||
| 2025-08-05 | 13F | Obermeyer Wood Investment Counsel, Lllp | 4,155 | 250 | ||||||
| 2025-08-27 | 13F/A | Brinker Capital Investments, LLC | 14,201 | 856 | ||||||
| 2025-08-29 | NP | JAVAX - James Aggressive Allocation Fund | 4,500 | 271 | ||||||
| 2025-05-14 | 13F | Stelac Advisory Services LLC | 0 | -100.00 | 0 | |||||
| 2025-08-28 | NP | TFAFX - Tactical Growth Allocation Fund Class I | 735 | 44 | ||||||
| 2025-08-18 | 13F | Geneos Wealth Management Inc. | 1,235 | 131.71 | 74 | 208.33 | ||||
| 2025-08-13 | 13F | Twin Peaks Wealth Advisors, LLC | 43 | 3 | ||||||
| 2025-08-08 | 13F | Hartland & Co., LLC | 100 | 6 | ||||||
| 2025-08-12 | 13F | Archer Investment Corp | 2,015 | 121 | ||||||
| 2025-08-29 | 13F | Evolution Wealth Management Inc. | 413 | 25 | ||||||
| 2025-04-21 | 13F | Ronald Blue Trust, Inc. | 0 | -100.00 | 0 | |||||
| 2025-04-10 | 13F | Portside Wealth Group, LLC | 42,560 | 0.00 | 1,592 | 0.00 | ||||
| 2025-08-05 | 13F | Simplex Trading, Llc | 25,233 | 2 | ||||||
| 2025-08-22 | 13F | Carter Financial Group, INC. | 26,842 | 1,620 | ||||||
| 2025-07-22 | 13F | Valley National Advisers Inc | 576 | 0 | ||||||
| 2025-07-02 | 13F | HBW Advisory Services LLC | 14,209 | 178.39 | 856 | 261.18 | ||||
| 2025-08-11 | 13F | Rothschild Investment Llc | 150 | 0.00 | 9 | 50.00 | ||||
| 2025-07-28 | 13F | WJ Wealth Management, LLC | 145,268 | 8,752 | ||||||
| 2025-07-25 | 13F | Apollon Wealth Management, LLC | 12,230 | 36.50 | 737 | 76.50 | ||||
| 2025-08-14 | 13F | Fmr Llc | 310 | -26.19 | 19 | -5.26 | ||||
| 2025-05-14 | 13F | Ameriprise Financial Inc | 0 | -100.00 | 0 | -100.00 | ||||
| 2025-08-12 | 13F | XTX Topco Ltd | 4,333 | 261 | ||||||
| 2025-07-21 | 13F | Mirae Asset Global Investments Co., Ltd. | 12,160 | -74.13 | 733 | -66.51 | ||||
| 2025-07-29 | 13F | Private Trust Co Na | 2,426 | 348.43 | 146 | 484.00 | ||||
| 2025-07-14 | 13F | AdvisorNet Financial, Inc | 2,209 | 133 | ||||||
| 2025-08-04 | 13F | Spire Wealth Management | 200 | 12 | ||||||
| 2025-08-29 | NP | GLRBX - James Balanced: Golden Rainbow Fund Retail Class | 32,502 | 12.53 | 1,958 | 45.68 | ||||
| 2025-07-08 | 13F | Nbc Securities, Inc. | 714 | 207.76 | 0 | |||||
| 2025-05-16 | 13F | Arete Wealth Advisors, LLC | 0 | -100.00 | 0 | |||||
| 2025-08-06 | 13F | Founders Financial Securities Llc | 9,485 | 571 | ||||||
| 2025-08-12 | 13F | Quadcap Wealth Management, LLC | 92,688 | -7.91 | 5,584 | 19.19 | ||||
| 2025-08-14 | 13F | Riggs Asset Managment Co. Inc. | 119,643 | 7,208 | ||||||
| 2025-08-08 | 13F | Larson Financial Group LLC | 1,985 | 120 | ||||||
| 2025-07-15 | 13F | Herbst Group, Llc | 58,562 | 5.49 | 3,528 | 36.53 | ||||
| 2025-08-12 | 13F | J.w. Cole Advisors, Inc. | 11,266 | 34.31 | 679 | 73.85 | ||||
| 2025-06-30 | NP | SMIFX - Sound Mind Investing Fund | 21,340 | 1,106 | ||||||
| 2025-07-23 | 13F | Hall Capital Management Co Inc | 3,500 | 211 | ||||||
| 2025-08-11 | 13F | Y.D. More Investments Ltd | 21,575 | -1.93 | 1,300 | 26.86 | ||||
| 2025-07-31 | 13F | Glass Jacobson Investment Advisors llc | 361 | 22 | ||||||
| 2025-08-08 | 13F | Avantax Advisory Services, Inc. | 10,818 | 652 | ||||||
| 2025-08-14 | 13F | Family Office Research LLC | 5,218 | 0.00 | 314 | 29.75 | ||||
| 2025-07-21 | 13F | Synergy Financial Management, LLC | 25,869 | 1,559 | ||||||
| 2025-08-11 | 13F | TD Waterhouse Canada Inc. | 23,570 | 217.87 | 1,386 | 297.13 | ||||
| 2025-07-22 | 13F | IMC-Chicago, LLC | 16,852 | 1,015 | ||||||
| 2025-08-15 | 13F | CI Private Wealth, LLC | 11,187 | 674 | ||||||
| 2025-08-13 | 13F | Great Diamond Partners, LLC | 39,323 | 2,369 | ||||||
| 2025-08-06 | 13F | Prospera Financial Services Inc | 5,487 | 331 | ||||||
| 2025-08-07 | 13F | Sound View Wealth Advisors Group, LLC | 4,800 | 289 | ||||||
| 2025-08-12 | 13F | Prudential Plc | 74,800 | -7.77 | 4,507 | 19.36 | ||||
| 2025-08-15 | 13F | Kestra Advisory Services, LLC | 7,588 | 72.53 | 457 | 124.02 | ||||
| 2025-07-09 | 13F | David J Yvars Group | 6,445 | 388 | ||||||
| 2025-08-14 | 13F | Federation des caisses Desjardins du Quebec | 3,525 | 49.05 | 212 | 92.73 | ||||
| 2025-08-26 | NP | USAF - Atlas America Fund | 7,843 | 473 | ||||||
| 2025-08-14 | 13F | GWM Advisors LLC | 21,791 | -22.45 | 1,313 | 0.31 | ||||
| 2025-07-22 | 13F | Bank Hapoalim Bm | 35,410 | 2.08 | 2 | 100.00 | ||||
| 2025-08-13 | 13F | Quadrature Capital Ltd | 333,665 | 20,110 |